Contact Us
Hedgewise advisors are available to every potential client because you deserve to know and trust who is managing your money.
E-mail
Questions / Comments
SUBMIT
X CLOSE
Investments That Outperform
Thanks! Only $1,000,000 remaining.
You can help accelerate launch by referring a few friends.
X CLOSE
PERFORMANCE ABOUT NEWSLETTER LIVE
CLIENT LOGIN
PERFORMANCE
ABOUT
NEWSLETTER
DEMO
CONTACT US
TOPICS
About Us
|
Account
|
FAQ
|
Investment Strategy
|
Market Commentary
|
April 2024: An Excellent Recovery
Posted in Market Commentary on 2024-04-29

Summary

  • Since January 2023, the Risk Parity Max strategy has gained almost 10% despite a persistent drawdown in fixed income and heightened market volatility. It has also outperformed its benchmarks by over 6%.
  • Equities, gold, energy, and copper have all contributed to net gains in the portfolio since the peak in January 2022. Bonds have also contributed gains since October 2022 despite rising yields, which highlights the resilience of fixed income once rates have become restrictive.
  • Bonds are expected to gain at least 25% once rates fall back to 3.5% or below. However, there is no rush for this to happen, as they should yield 5-6% annually through a combination of higher coupons and volatility management.
  • Overall, the recovery has gone very well and in line with expectations. Unfortunately, short-term volatility in the bond market can distract from this bigger picture despite it posing little threat to long-run returns.

Introduction: The Big Picture Recovery Looks Excellent

A remarkable feature of the post-pandemic investing landscape has been its short-termism. Between the retail crowd, the dominance of options contracts, and the hyper-short news cycle, there is now much greater interest in what might happen over the next few days rather than the next few years. This has resulted in many bizarre market outcomes, most easily viewed through the lens of “meme stocks”, but also applicable to entire asset classes like Treasury bonds.

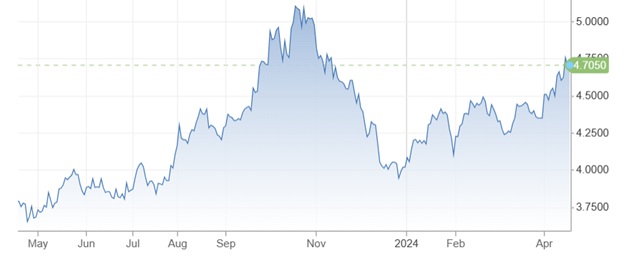
For example, last fall, we saw yields on the 30yr bond jump from 4% to 5% almost overnight, only to fall back below 4% a few months later. As discussed in prior newsletters, this had little to do with any fundamental shift to the economy; the best explanation is that a notable hedge fund manager tweeted that he thought yields were too low and set off a panic chain-reaction. Once this subsided, yields quickly reversed.

12 Month Trailing 30yr Treasury Bond Yield

Source: CNBC

While rates have surged yet again this year, the story rhymes. The dominant explanation this time is that the Fed is going to leave rates higher for longer, but more restrictive short-term rates are designed to slow future growth and inflation. The more time that the Fed leaves rates at 5.5%, the more likely that 30yr rates eventually fall.

Debate will go on about why the market appears frequently hijacked by fast money and irrational prices, but it does not matter from a Hedgewise perspective. This is true across all asset classes, but especially so for Treasury bonds given their formulaic nature. Unfortunately, this meaningless yield rollercoaster can make it much harder to recognize how well the Hedgewise strategy has been performing.

Hedgewise Significantly Outperforming Its Benchmarks Since 2022

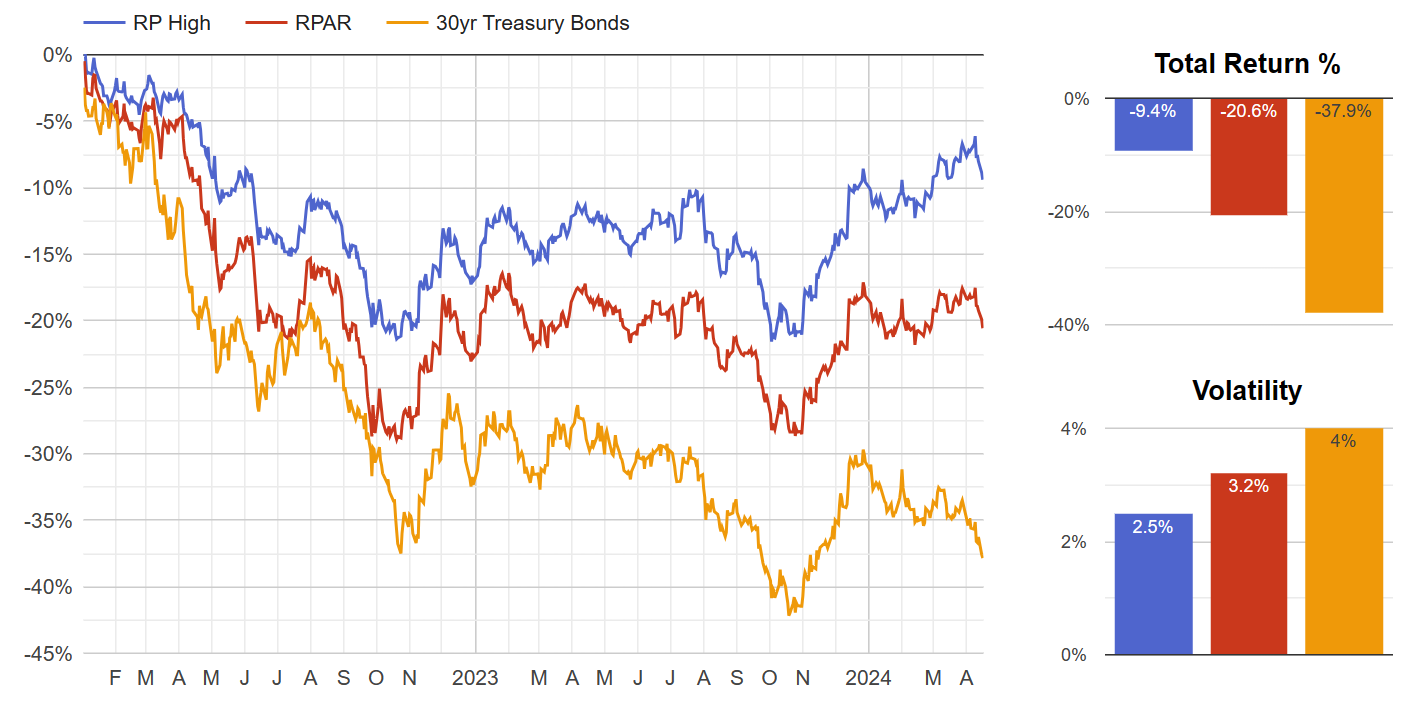
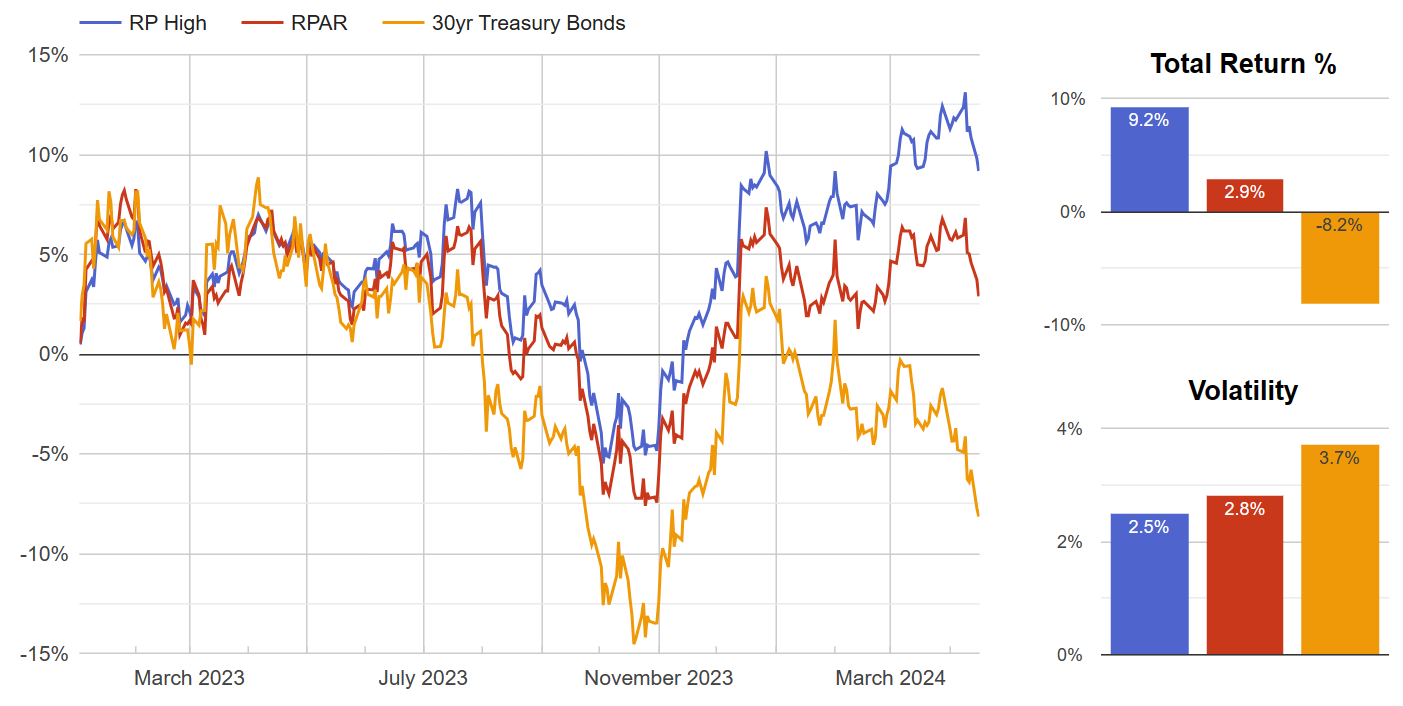
Since 2022, Hedgewise has outperformed a passive Risk Parity benchmark (as measured by the RPAR ETF) by over 5% annually, and it has outperformed a passive investment in 30yr Treasury bonds by 14% annually.

Source: FRED, Nasdaq Data Link, Hedgewise. RP High performance is a composite of live client performance at that risk level and includes all fees, costs, and dividends. RPAR is a publicly traded ETF with a volatility level similar to the RP High product. Data includes all dividends paid. 30yr Treasury bonds based on benchmark interest rates and includes an estimate for all coupons paid. Data as of April 16, 2024.

We can also zoom in on the period from 2023 to confirm the consistency of this relative outperformance.

Source: See prior illustration.

A differential of over +6% (compared to RPAR) is remarkable over such a short timeframe.

The Recovery Is Precisely On Track

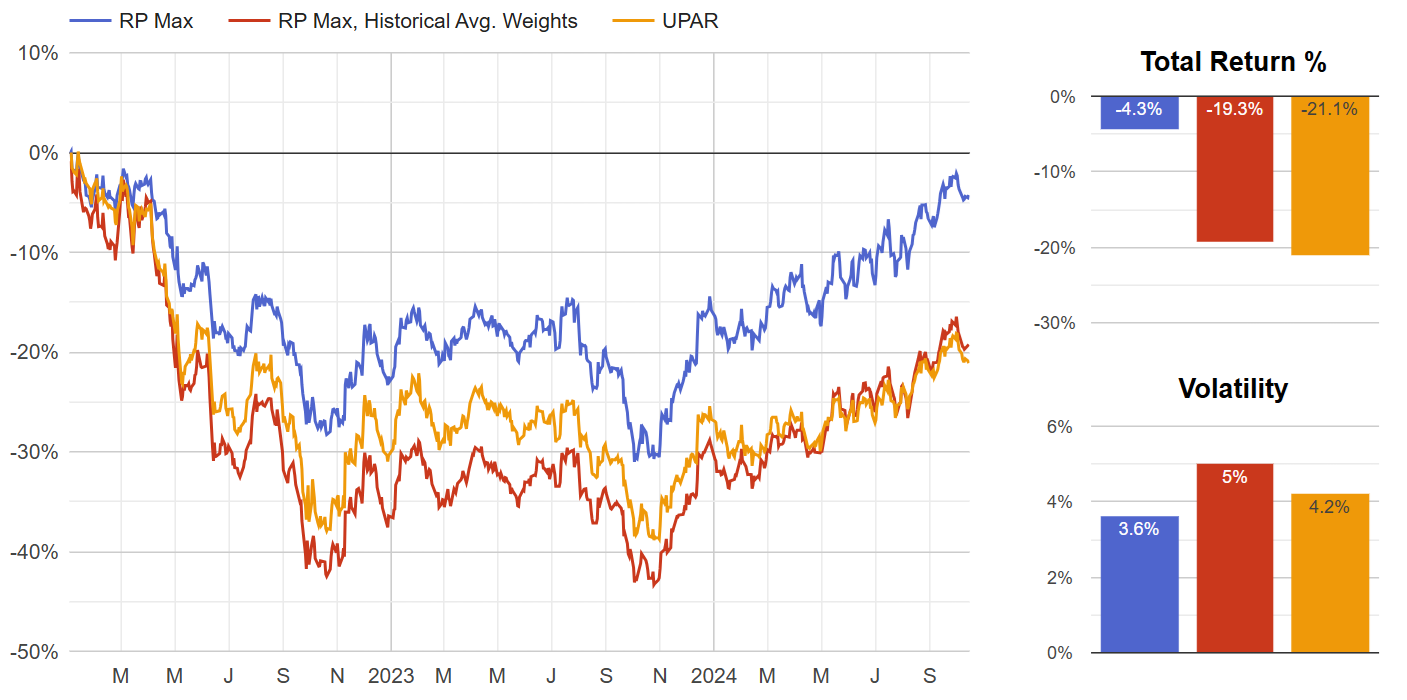
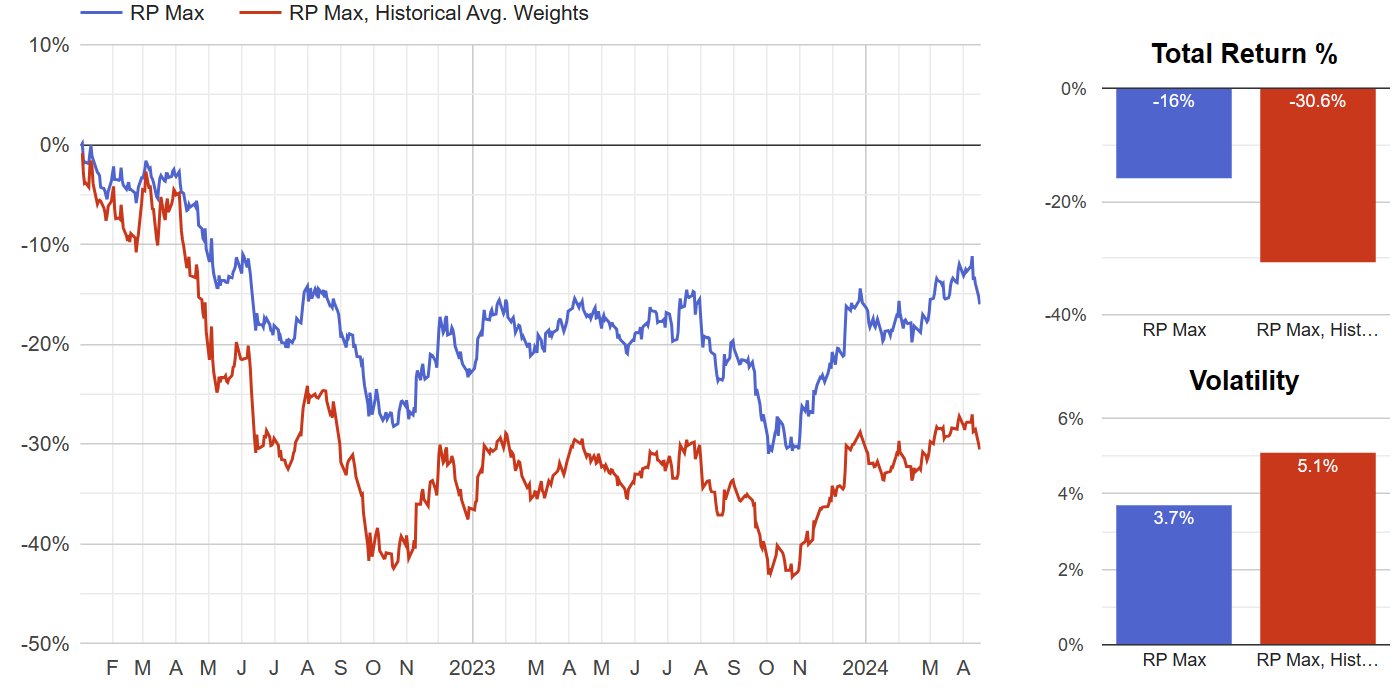
Back in July 2022, this newsletter projected that Hedgewise would eventually "create" new gains of 5-20% as a function of the drawdown that year. More specifically, since Hedgewise had successfully mitigated losses, it merely had to return to historically average asset weights to generate an outsized recovery. To visualize this, the following chart compares the live RP Max strategy to a model portfolio composed of historically average asset weights at the same risk level.

Source: Hedgewise Analysis. RP Max performance is a composite of live client performance at that risk level and includes all fees, costs, and dividends. The historical average weights of the RP Max portfolio are 21% copper, 17% gold, 78% bonds, 52% equities, and 6% energy. Data as of April 16, 2024.

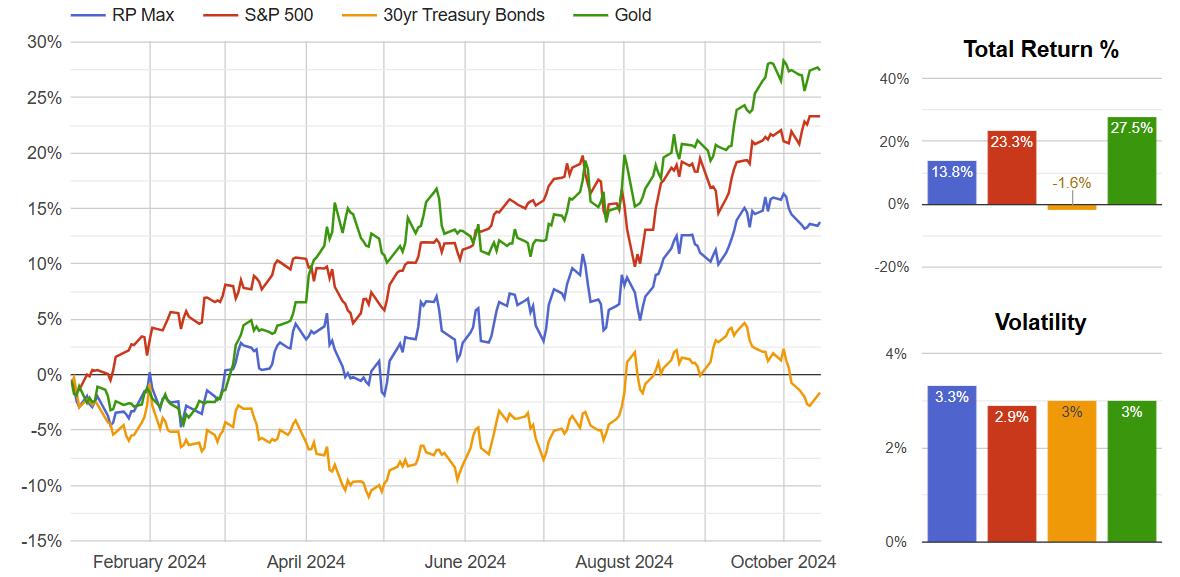
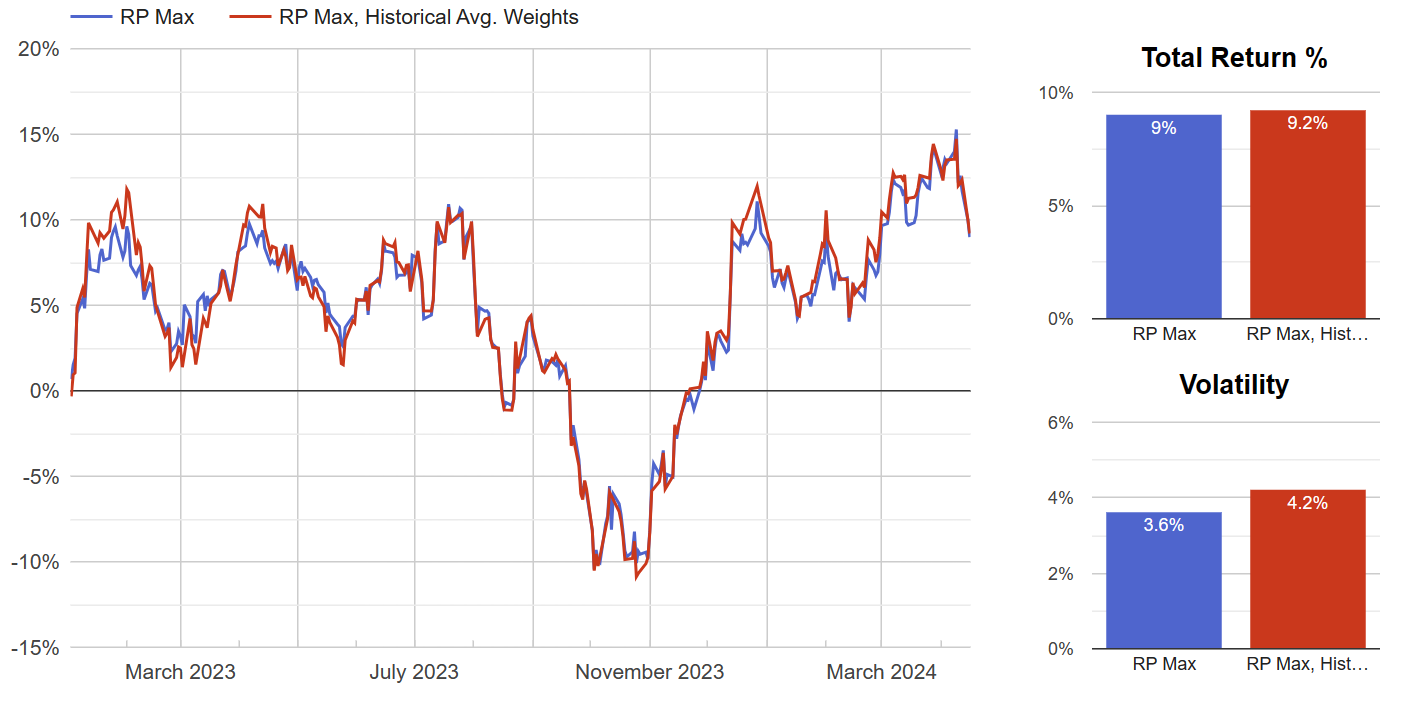
The gap between the blue and red lines represents these potential "new" gains, or the amount that the Hedgewise Max strategy would expect to gain when the red line returns to breakeven. As of April 16, this is worth around 21%, which is north of the upper end of the original estimates. The key to fully realizing this gain is simply to track the red line as it recovers. The following chart zooms in on how this has gone since January 2023.

Source: See prior illustration.

This story is simple and compelling. Hedgewise avoided a big drawdown, and is now fully participating in the recovery, which had reached 9% in April. This is a great outcome in a little over a year, and there is still a huge amount of upside remaining.

Every Asset Class Has Generated Net New Gains, Except Bonds

A more granular way to analyze the recovery is to break down how each individual asset class has impacted the Hedgewise portfolio since the peak in January 2022, which is shown in the following table.

AssetNet Impact on RP Max Since Jan 2022
S&P 5002.5%
Commodities9.9%
Bonds-24.3%
Est. Leverage Cost-4.1%
Total-16%
Source: Hedgewise Analysis. Calculated by using the live weights in the RP Max portfolio in each asset class multiplied by the actual return on those assets each month since January 2022. Includes an estimate for all dividends and coupons paid.

Both equities and commodities have already reached or surpassed their January 2022 peaks. Just as the model predicted, these asset classes have also generated net new gains for the RP Max portfolio. This highlights how the theory is no longer hypothetical; the goal was achieved in line with expectations for these cases. We are simply waiting for bonds, but bonds are unique in how little it matters whether the recovery happens in six months or six years.

Why Bond Math Is Amazing and Often Misunderstood

Once interest rates become restrictive, fixed income has three tailwinds that make it very compelling as an investment. First, investors receive higher coupons. Second, assuming rates truly are dampening economic activity, they will tend to reverse lower once inflationary pressure has abated. Third, and unique to Hedgewise, there is an opportunity to systematically take advantage of bond volatility, as it makes sense to add exposure as rates go higher and vice versa.

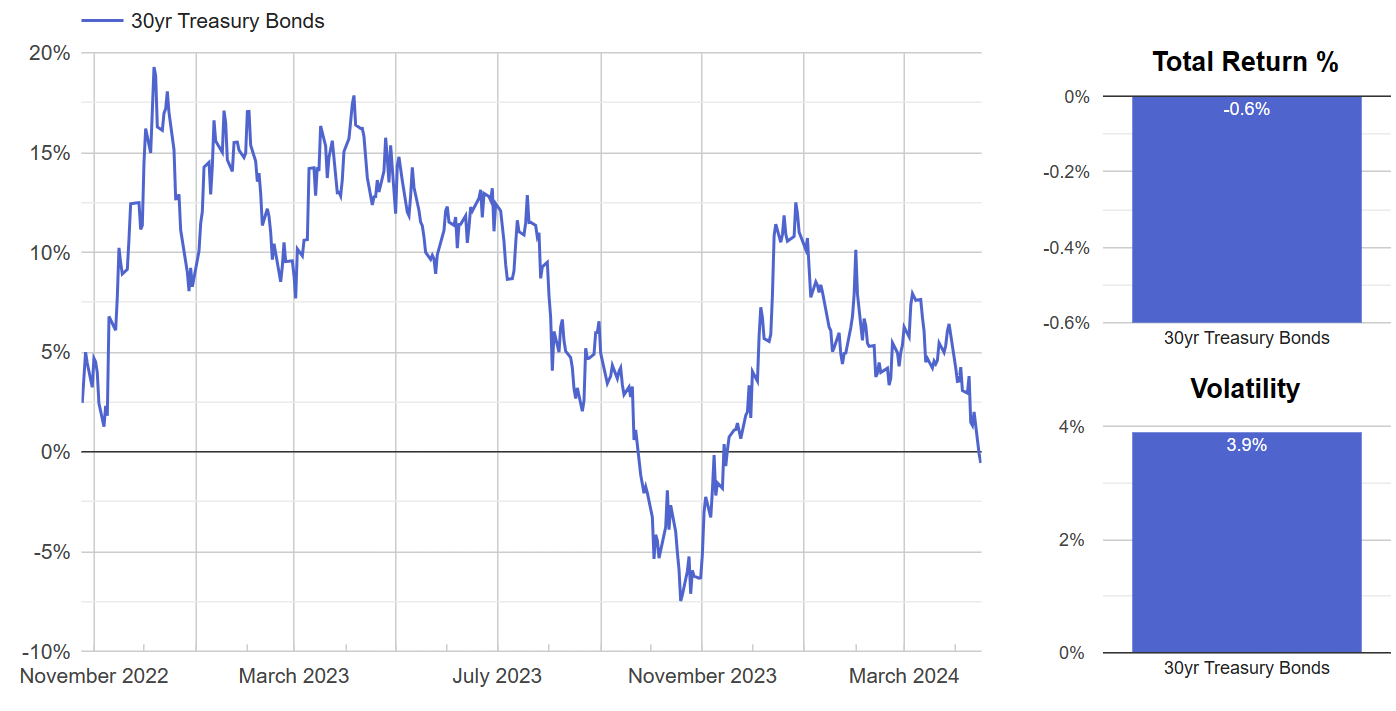
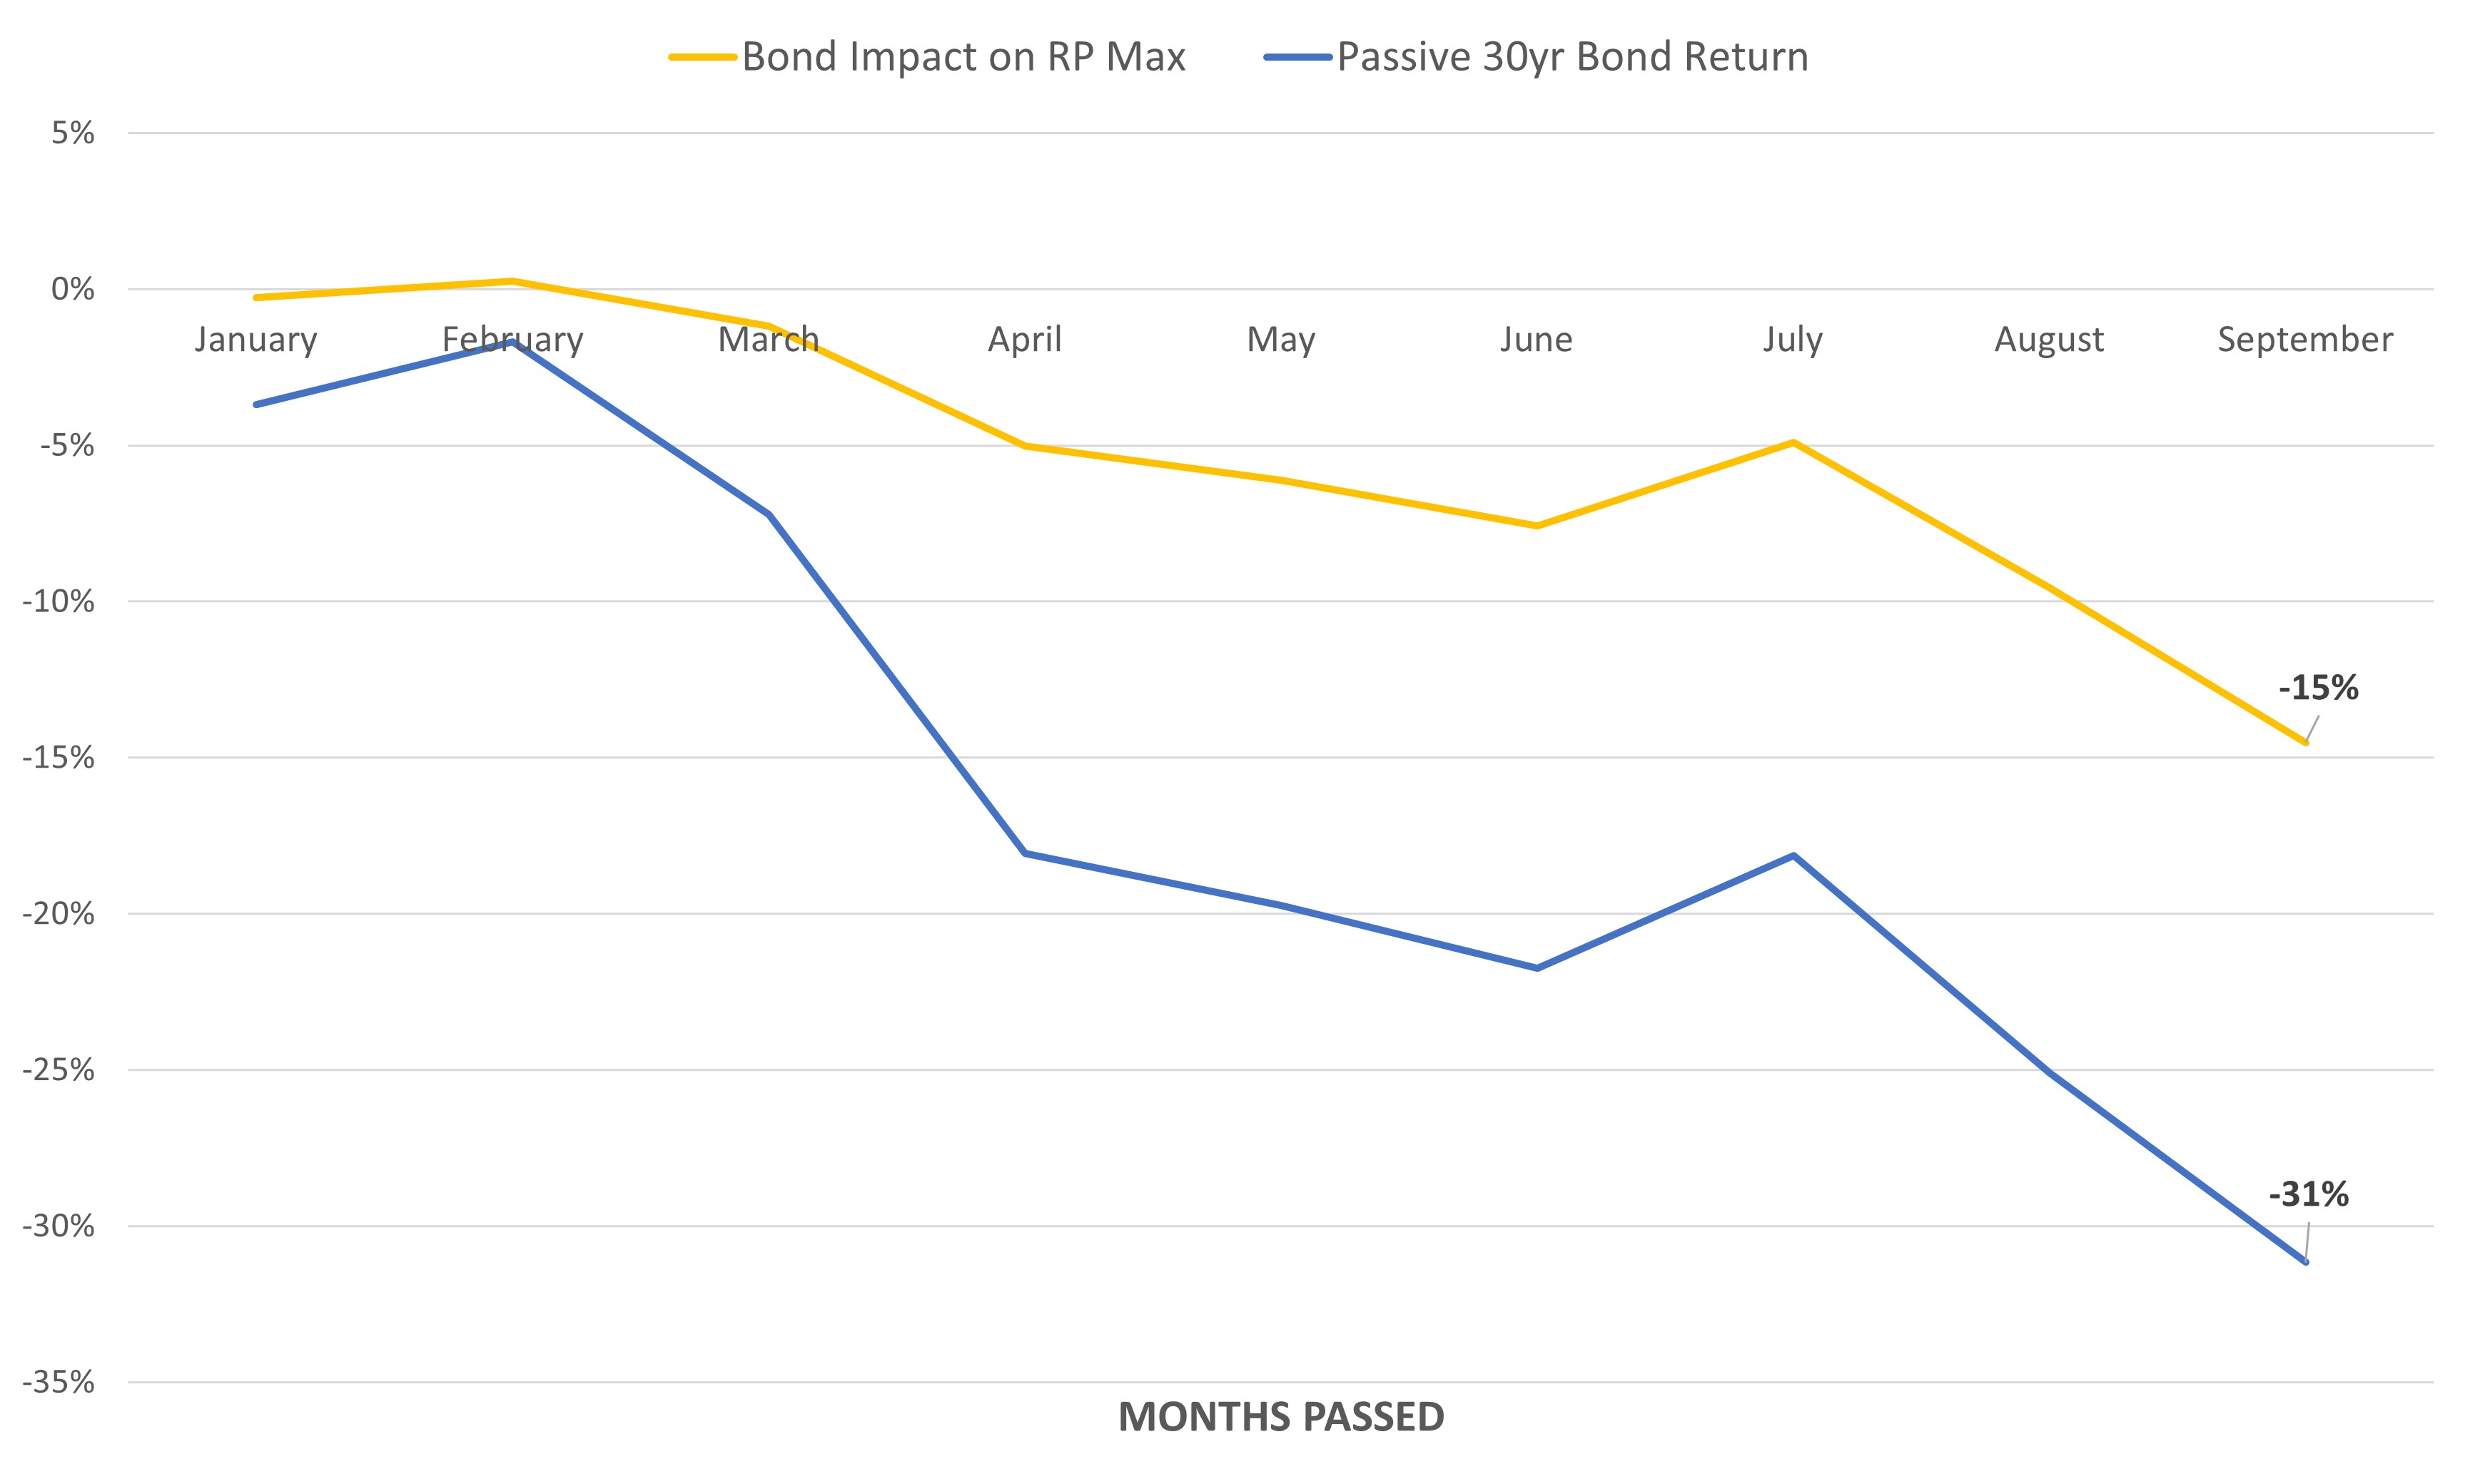
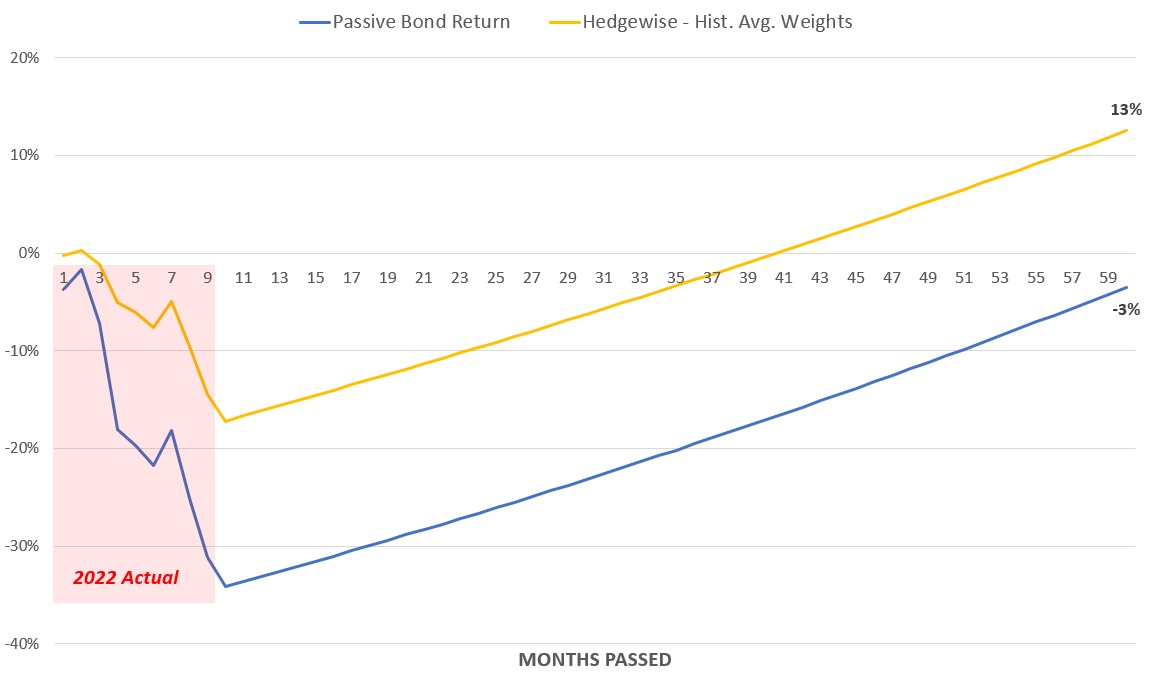
Taken together, these factors make it very hard to lose money in bonds over a medium time horizon (i.e., 2 years or longer). However, it can be difficult to see this benefit without the proper perspective. For example, 30yr Treasury bonds have lost over 37% since January 2022. But it is more useful to separate it into two periods - the initial drawdown from January to October 2022, and the period thereafter. This allows for a more accurate assessment of how bonds have performed once rates became restrictive.

30yr Treasury Bond Performance Since October 2022

Source: Hedgewise Analysis, FRED. Includes an estimate for all dividends and coupons. Data as of April 16, 2024.

Since the end of October, 30yr bonds are basically breakeven. This is even though bond yields have risen from a peak of 4.4% back then to 4.8% today. Within the Hedgewise portfolio, volatility management has also added another 3% over this timeframe, making it a net positive investment. If rates merely return to the original level of 4.4%, bonds will have provided north of a 10% gain.

This is why the wild short-term swings over the past year and a half have been relatively meaningless in the larger scheme. Once rates get this high, bonds are a sound investment because there is such a large buffer accruing over time. We take advantage of the volatility on the margins, but these month-to-month movements, however large, do not change the underlying investment thesis.

From this perspective, there isn't much to second guess about how the framework has managed bonds since October 2022. But what about the initial drawdown? It's all part of the same theory, and it's all still going to plan.

Evaluating the Initial Bond Drawdown

The basic idea of risk-managed drawdowns is always the same: the impact of the initial loss needs to be less than the subsequent gain. We explored earlier how this has already been successful for equities and commodities since January 2022. Bonds are replicating the same process, just on a longer timeframe. For bonds uniquely, the length of this timeframe does not really matter.

It is easier to understand this with data and scenario planning. For a moment, imagine that 30yr bonds return to a 3% yield at some point in the future. The following table models the expected net impact to the RP Max portfolio from January 2022 to that final date, with the only variable being how long it takes to resolve. For example, the first row assumes that 30yr rates fall to 3% by this July. In that scenario, bonds would gain a total of +7% in the RP Max portfolio, measured from January 2022 (equal to 2.6% annualized over two and a half years), and 38% measured from today. Note that this is incorporating live data through April, and model assumptions begin looking forward from today.

Scenario 1: 30yr Rates Fall to 3%

TimeReturn From Jan 22AnnualizedReturn From Today
2 months7%2.6%38%
2 years16%3.3%50%
4 years26%3.5%62%
10 years59%3.7%105%
Source: Hedgewise Analysis. The Bond Impact on RP Max calculated using live recommended portfolio weights in client portfolios multiplied by an estimation of the benchmark return on 30yr nominal bonds and 30yr TIPS. Includes an estimate for all coupons paid. Assumes bond exposure averages 100% after the interest rate peak, and volatility management yields an average of 1.5% gain annually, which is consistent with live gains generated since January 2022..

The longer it takes for rates to fall, the larger the expected annualized return. The math behind this is not complicated - bonds yield somewhere between 5-6% annually in the model through a combination of coupon and volatility management. The longer you get this yield, the higher the final annualized return will be. All these numbers include the initial drawdown, which is more than recovered regardless of when rates return to 3%.

There are a few big takeaways. The first is that much of the work was done during the initial drawdown from January to October 2022, when Hedgewise approximately halved bond losses compared to a passive investment. This is the amount that can be recaptured upon recovery and anchors the numbers in the prior table.

Second, bonds are the unique asset class where time amplifies expected returns. You do not get a higher coupon or the benefit of volatility management in equities or commodities, but this is a systematic feature within fixed income.

Finally, though we are ambivalent to the interim volatility, the fact that rates have swung as high as 5% recently only increases the likelihood that they will fall to 3% or below in the future. Any company or individual that refinances at these punishing levels will be impacted for years, and it is worse the higher rates go. In fact, a recent paper by the San Francisco Fed found tight monetary policy can reduce potential output for over a decade.

Fun With Rate Scenarios

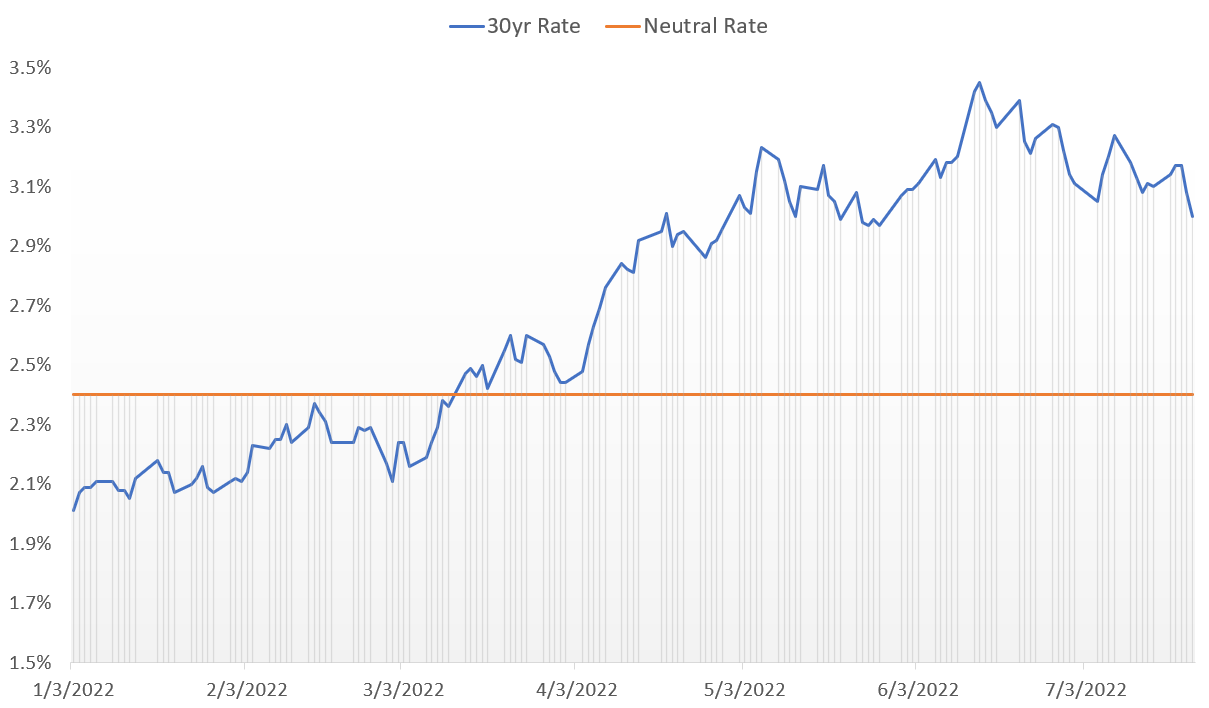
The biggest underlying assumption is that 30yr rates eventually fall to 3%. Considering the Fed pegs its neutral rate at 2.7%, that we spent the better part of a decade with rates under 3%, and that current rate levels have essentially frozen entire parts of the economy (e.g., housing and car loans), I don't think this is a big stretch. To settle at 3.5% or above, productivity and/or population growth would need to surge in the years ahead. But just for fun, we can model a couple other rate scenarios.

Bear in mind that any final rate below today's (roughly 4.8%) represents a gain, and that a 0% return measured from January 2022 is the same as a ~30% gain measured from today.

Scenario 2: 30yr Rates Fall to 3.5%

TimeReturn from Jan 22AnnualizedReturn From Today
2 months-2%-0.9%26%
2 years6%1.3%37%
4 years16%2.2%49%
10 years48%3.2%91%
Source: See prior table.

Scenario 3: 30yr Rates Fall to 4.5%

TimeReturn from Jan 22AnnualizedReturn From Today
2 months-18%-7.2%6%
2 years-10%-2.2%17%
4 years-1%-0.1%28%
10 years31%2.1%69%
Source: See prior table.

I think the most interesting number is the 10yr annualized return in the 4.5% scenario. Even in this edge case, bonds will still have contributed a 2% annual gain to the portfolio measured from January 2022. This drives home the bigger picture that the 2-4% annual return range is boringly consistent. If rates settle higher, it just takes longer to eventually get to the same place.

The other notable observation is how high the return from today is across all scenarios. Outside of a permanent rise in yields above 4.8%, bonds should be an excellent investment irrespective of how it compares to January 2022.

Addressing a Few Outstanding Questions

But what if rates do go up to 5% or 6%? Such levels would very likely break the economy and cause a recession like the Volcker-induced slowdown in the early 1980s. Otherwise, you need to assume some combination of permanently higher inflation (3.5%+) and permanently restrictive rates (2.5%+), and it requires mental gymnastics to imagine this realistically. Presuming rates do get this high but only temporarily, the analysis of this article remains the same with a small boost from higher coupons and additional volatility management.

The initial bond losses from January to October 2022 were significant. Could that have been better managed? For reference, 30yr Treasures lost around 33% in those 10 months, compared to an impact of -17% on the RP Max portfolio. Historically speaking, this was both the largest bond drawdown and the most successful loss reduction as far back as data can be modeled. A more aggressive intervention would have required some level of active management and timing.

Finally, why does it make sense to ignore the bond volatility since October 2022 rather than try to take advantage of the swings? Hedgewise has been adjusting exposure throughout, and that is referred to as bond volatility management. It is just in small amounts (i.e., 1-5% monthly) by design. This is because bonds have an asymmetric payoff profile with rates this high. If yields go up another 1%, bonds lose 14%, but they gain 18% if yields fall by the same amount. There are also the tailwinds discussed earlier: a 5-6% annual yield, plus the constant squeeze on the economy from restrictive rates. Lastly, the swings in the market have been rapid and often driven by nothing fundamental - from a risk management perspective, it is much more dangerous to try and time such an environment than to simply wait it out.

Conclusion: But Why Is All This Happening?

Short-term fluctuations have never been very meaningful to Hedgewise, and hopefully this analysis makes it easier to look past the noise. Yet the frequency, extremity, and seeming irrationality of the markets over the past few years has understandably drawn attention. It is not necessary to demystify this for Risk Parity to be successful, but I'd say the crux of it is that the Fed messed up badly, and as a result has become excessively data-dependent and backwards looking. This has fed into post-pandemic market dynamics of leveraged short-term bets and price dislocation that often overwhelms fundamentals over periods of a few months.

The big questions are whether interest rates are restrictive and why it may take a little longer than usual to see the impact. Instead, the Fed is saying "we don't know what is going on", which forces the broader market to react similarly. If one bad inflation print happens, maybe rates are not restrictive, maybe we have to re-think everything. Maybe rates will have to go up even more!

There is a relatively easy story to contextualize this: interest rates are restrictive for the parts of the economy where debt is required, like mortgages and car loans, but not enough of the economy has been impacted yet. It is not realistic to expect growth and inflation to slow down until it affects more individuals and companies. The main question is how long that will take, not how high rates have to be or whether rates matter at all.

If the Fed had strong credibility and conviction, it could explain this. Perhaps it will take 3 years to have enough bite, and inflation will slowly drift down from 3.5% over that time, but there isn't really a way to speed it up that involves interest rates alone. A coherent narrative like this would stabilize long-term interest rates and limit overreactions from month-to-month, but since it doesn't exist, we are left with the current situation.

Interest rates may already be too restrictive, meaning that the parts of the economy that are affected are being punished too severely when they won't meaningfully impact headline inflation either way. This would likely remain true even with higher rates, which would then only matter if they had a psychological impact of pushing the economy into a downturn. Yet inflation may already be on its way to being under control if the Fed could present this forward guidance believably. Unfortunately, it lost too much credibility in 2021 to do so.

If this is happening, rates will stay too high for too long. If the Fed cannot tolerate 3-3.5% inflation while this process plays through, a hard landing may be the only option. Keep this in mind if we do see additional pressure on yields and try not to sweat the volatility.

Disclosure

This information does not constitute investment advice or an offer to invest or to provide management services and is subject to correction, completion and amendment without notice. Hedgewise makes no warranties and is not responsible for your use of this information or for any errors or inaccuracies resulting from your use. Hedgewise may recommend some of the investments mentioned in this article for use in its clients' portfolios. Past performance is no indicator or guarantee of future results. Investing involves risk, including the risk of loss. All performance data shown prior to the inception of each Hedgewise framework (Risk Parity in October 2014, Momentum in November 2016) is based on a hypothetical model and there is no guarantee that such performance could have been achieved in a live portfolio, which would have been affected by material factors including market liquidity, bid-ask spreads, intraday price fluctuations, instrument availability, and interest rates. Model performance data is based on publicly available index or asset price information and all dividend or coupon payments are included and assumed to be reinvested monthly. Hedgewise products have substantially different levels of volatility and exposure to separate risk factors, such as commodity prices and the use of leverage via derivatives, compared to traditional benchmarks like the S&P 500. Any comparisons to benchmarks are provided as a generic baseline for a long-term investment portfolio and do not suggest that Hedgewise products will exhibit similar characteristics. When live client data is shown, it includes all fees, commissions, and other expenses incurred during management. Only performance figures from the earliest live client accounts available or from a composite average of all client accounts are used. Other accounts managed by Hedgewise will have performed slightly differently than the numbers shown for a variety of reasons, though all accounts are managed according to the same underlying strategy model. Hedgewise relies on sophisticated algorithms which present technological risk, including data availability, system uptime and speed, coding errors, and reliance on third party vendors.

October Update: Quick Perspective on Bond Volatility
Posted in Market Commentary on 2023-10-16

Summary

  • Real interest rates continue to swing around wildly, despite little news of note regarding the long-term growth and inflation outlook. While this is contributing to significant volatility in the Hedgewise portfolio, longer-term risk is declining every day that rates remain this high.
  • The economy is naturally restricted by real interest rates above underlying real growth, which is driven exclusively by worker productivity and population. These factors are unaffected by fiscal deficits, bond auctions, and supply/demand curves. If the current real rate is above this level of growth, the economy will be constricted.
  • Long-term real expected GPD growth is estimated to be 1.8%, and the long-term real interest rate is currently near 2.5%. This dynamic will negatively impact the economy, thus limiting its ability to persist. The longer it continues, the more future growth will suffer (and the lower future interest rates will likely be).
  • Since these rates are unsustainable, Hedgewise focuses on how to systematically take advantage of the situation. Ironically, the best opportunities arise the longer that rates stay high, and the slower that they come down.

Bonds Feel Scary, but They Are Not

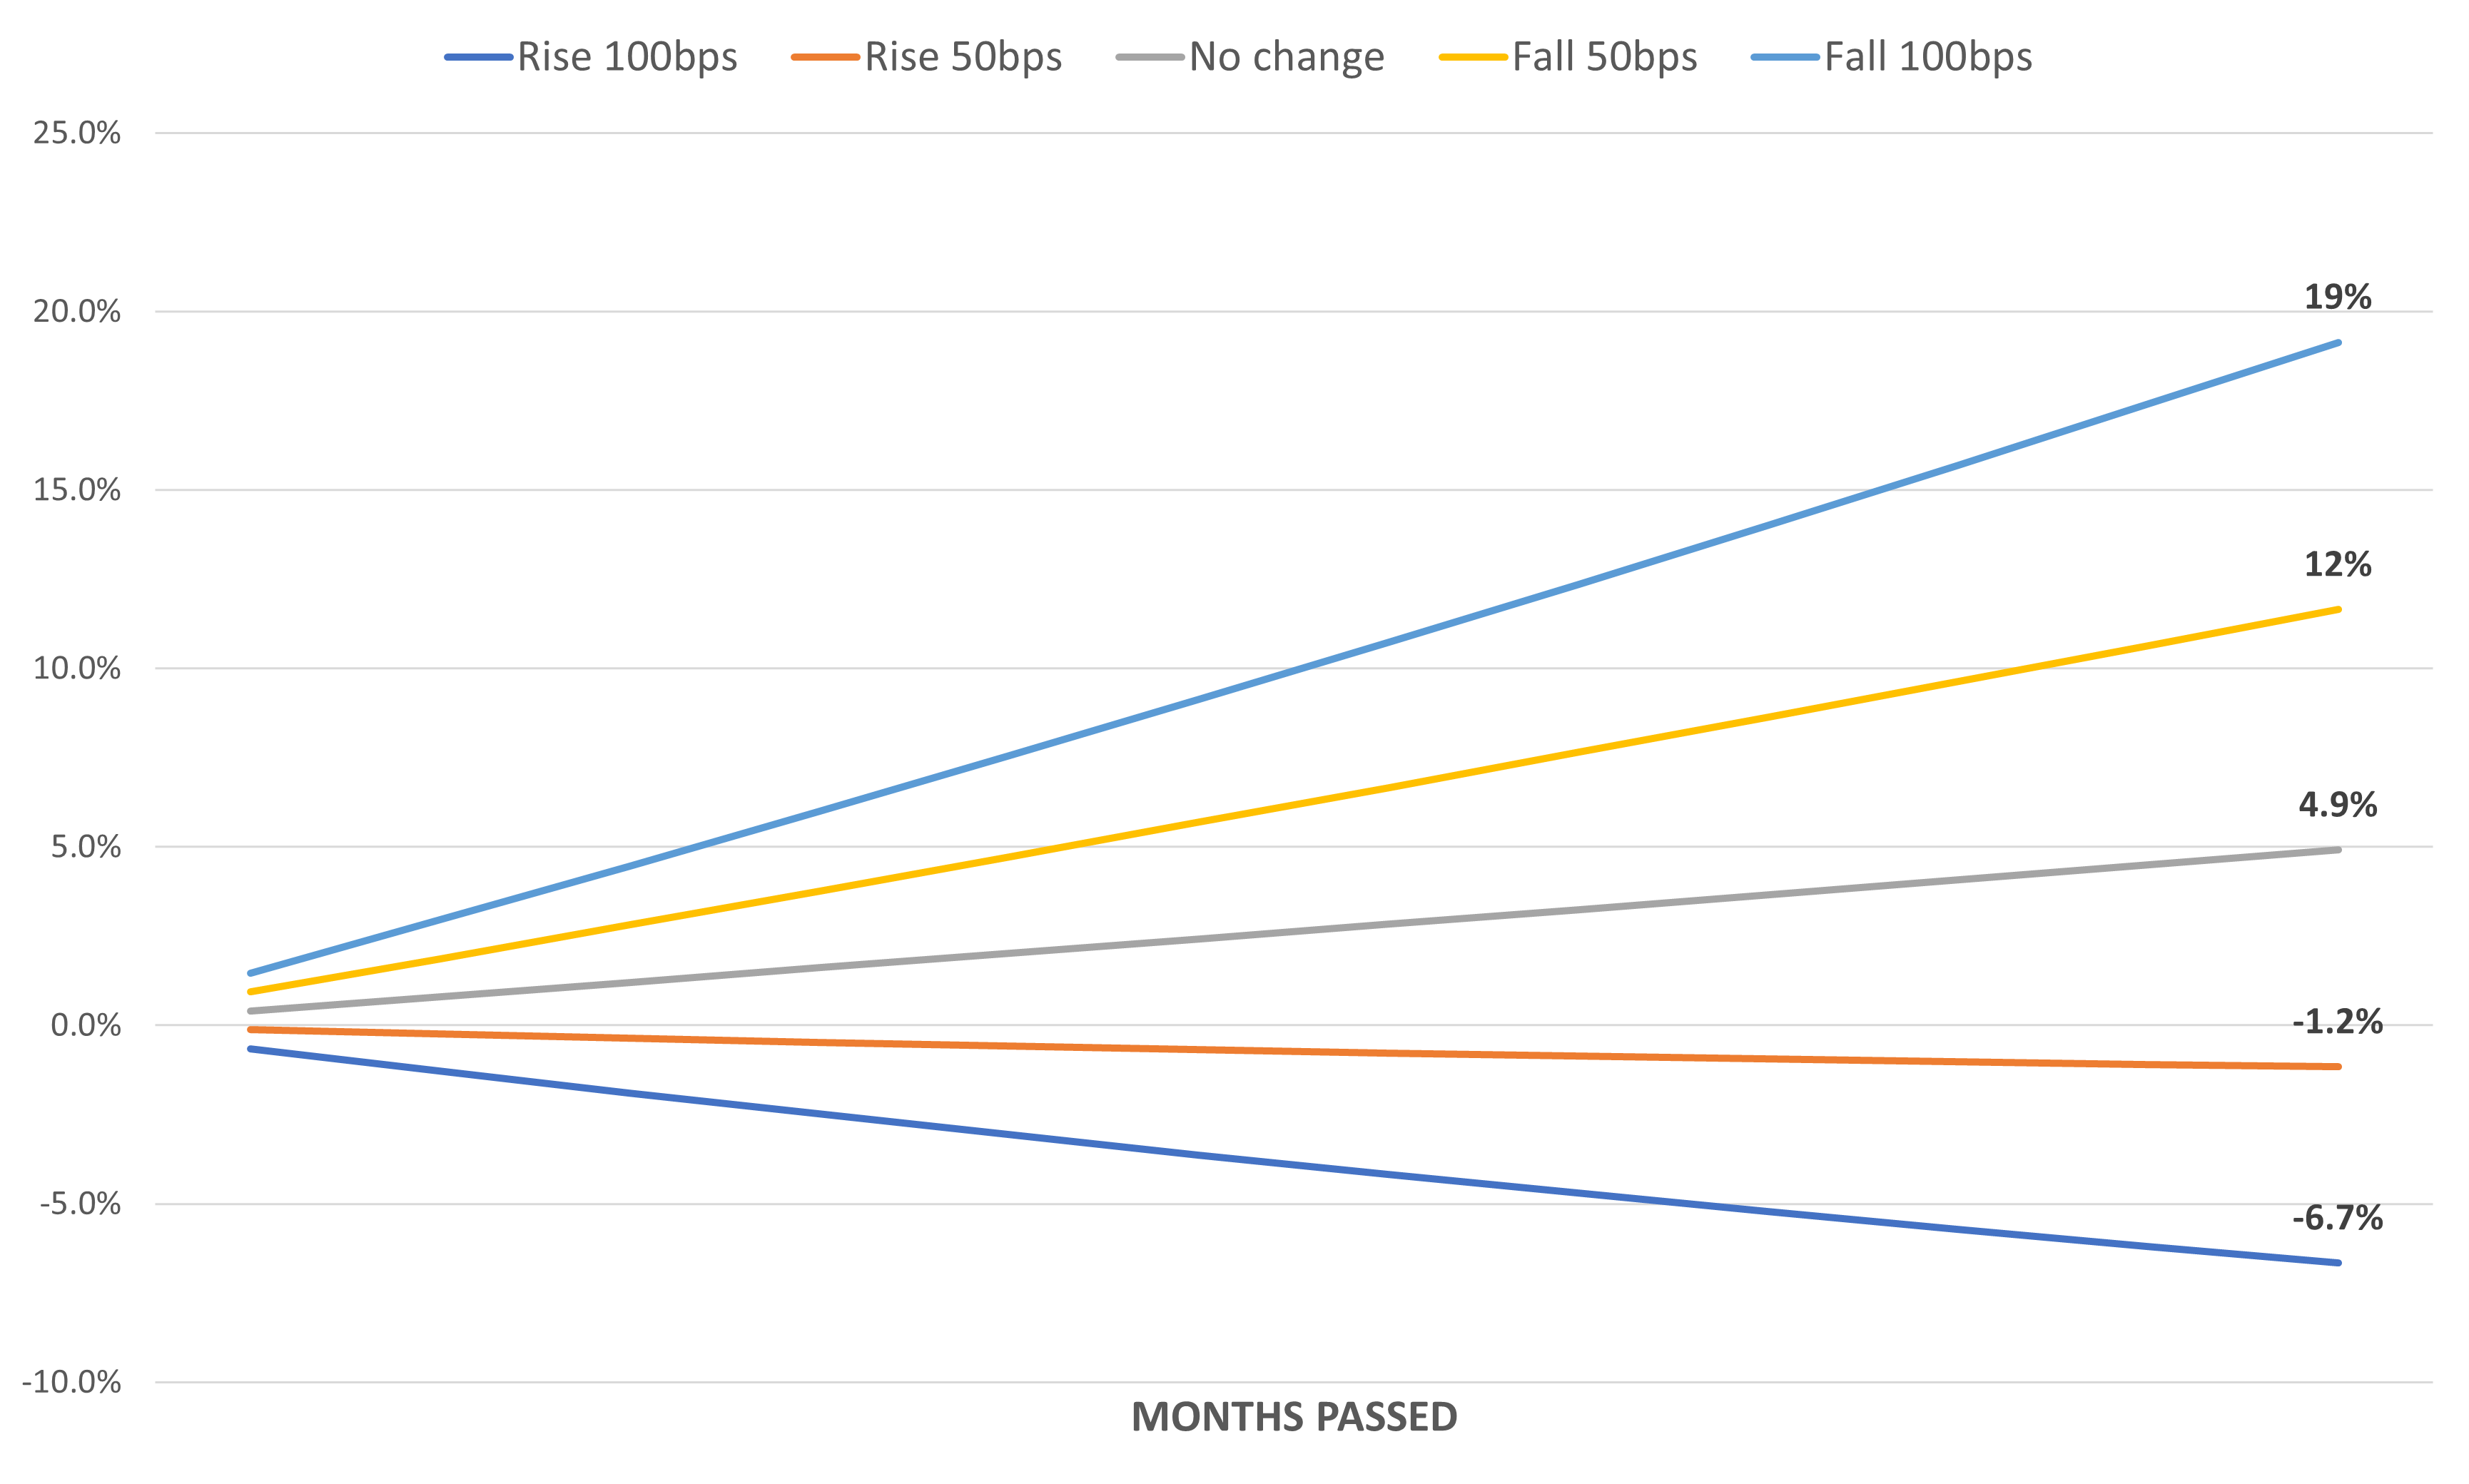
For a moment, put aside the crazy bond market volatility over the past few months, and consider the following. If you invest in 20yr Treasuries at 4.85%, you will gain 12% over the next 12 months if rates fall 50bps, and you will lose 1.1% if rates rise 50bps. Expanding on this, here is a view of expected 20yr Treasury performance across a variety of interest rate scenarios over the next 12 months.

Bond Scenarios Over Next 12 Months

Source: Hedgewise Analysis

If you have a time horizon of at least one year, it will be very difficult to lose money with these bonds. Even if rates rise all the way to 5.85%, which would be extreme for many different reasons, further losses would be limited to under 7%. This perspective is easily lost amidst the significant volatility over the last two months, but it is far more important than what is happening day-to-day, and a much more accurate picture of true "risk".

This picture improves even further if you add on a layer of probability. Given that real rates are now the highest in the past 25 years, and meant to be restrictive on the economy, there is a much better chance that rates will fall than that they will rise.

If you can maintain this broader perspective, the recent volatility is much easier to tolerate. What happens over a few days or weeks has little to do with the 12-month horizon. To the extent that rates become more restrictive over the short-term, this increases the chance of lower long-term rates because it will tighten financial conditions and threaten growth.

A challenging aspect to this story is that it was already true when rates were at 4%, and the sheer size and speed of the recent losses can create a sense of panic and second guessing. However, it is very risky to try and time losses as rates go from somewhat restrictive to very restrictive. Not only is it unlikely to persist for very long, but you also miss out on higher coupon payments along the way. Instead, Hedgewise avoids these pitfalls by systematically adding to its exposure as rates go higher, which increases long-term expected returns without any timing risk.

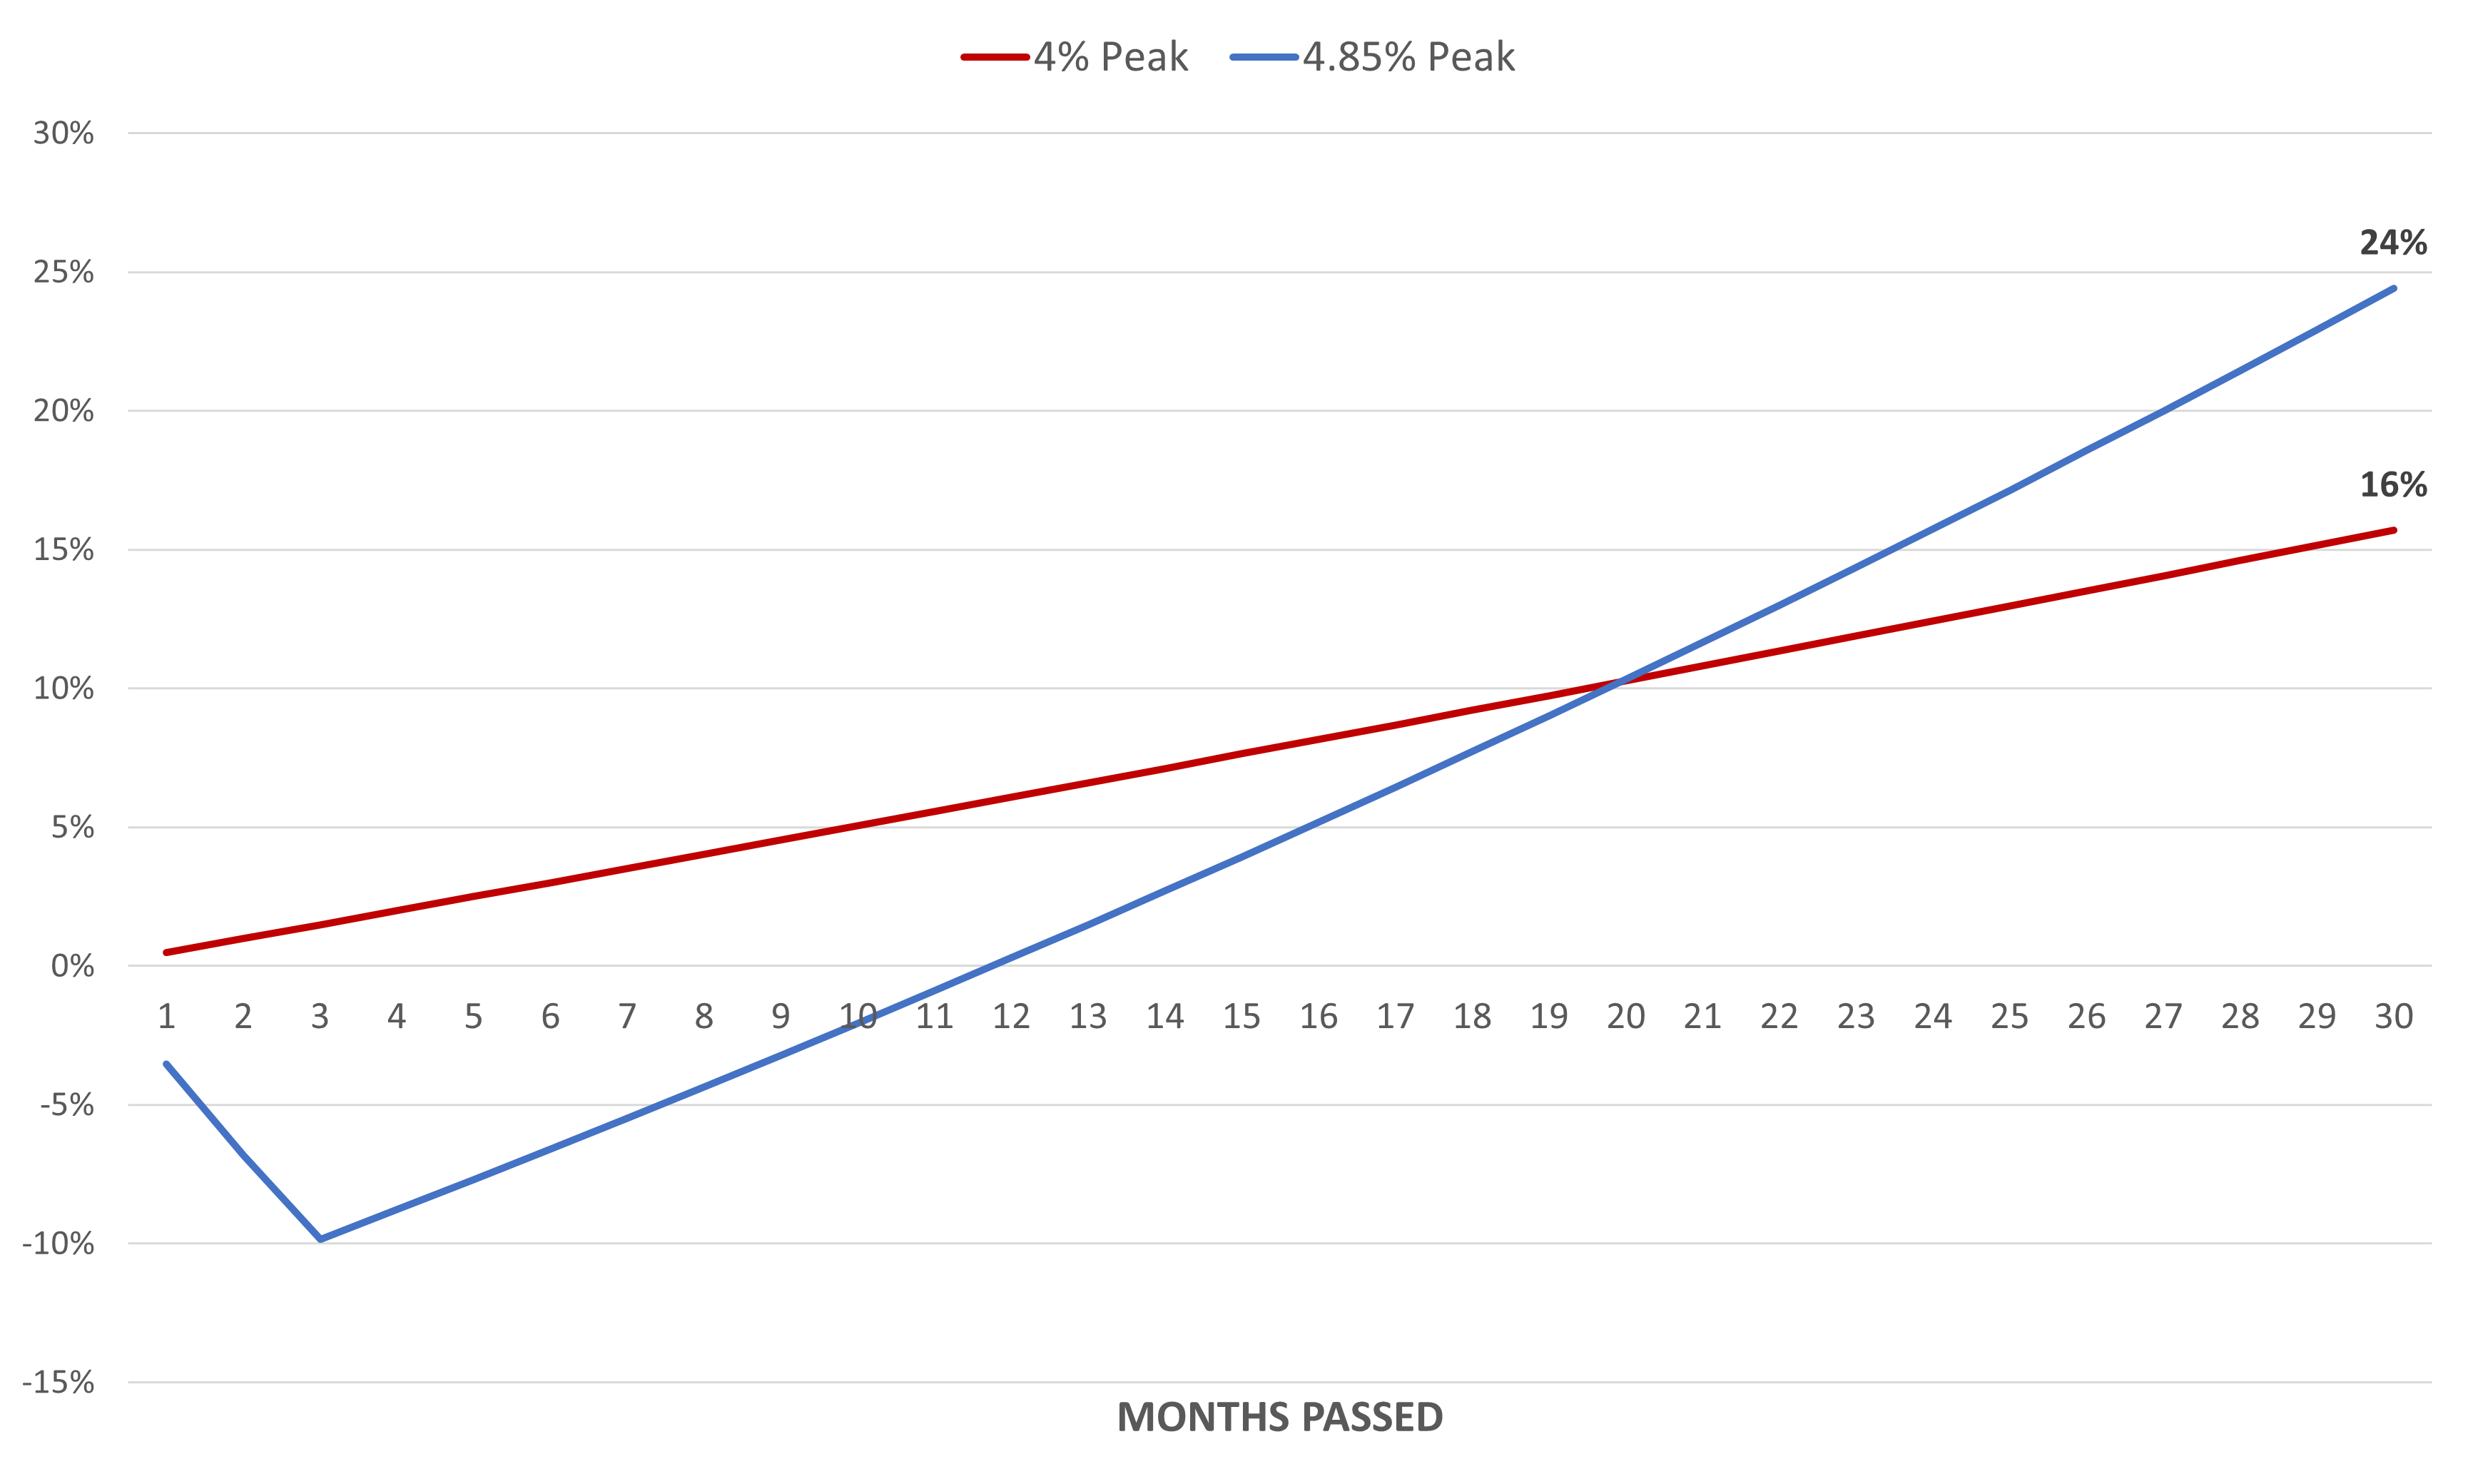
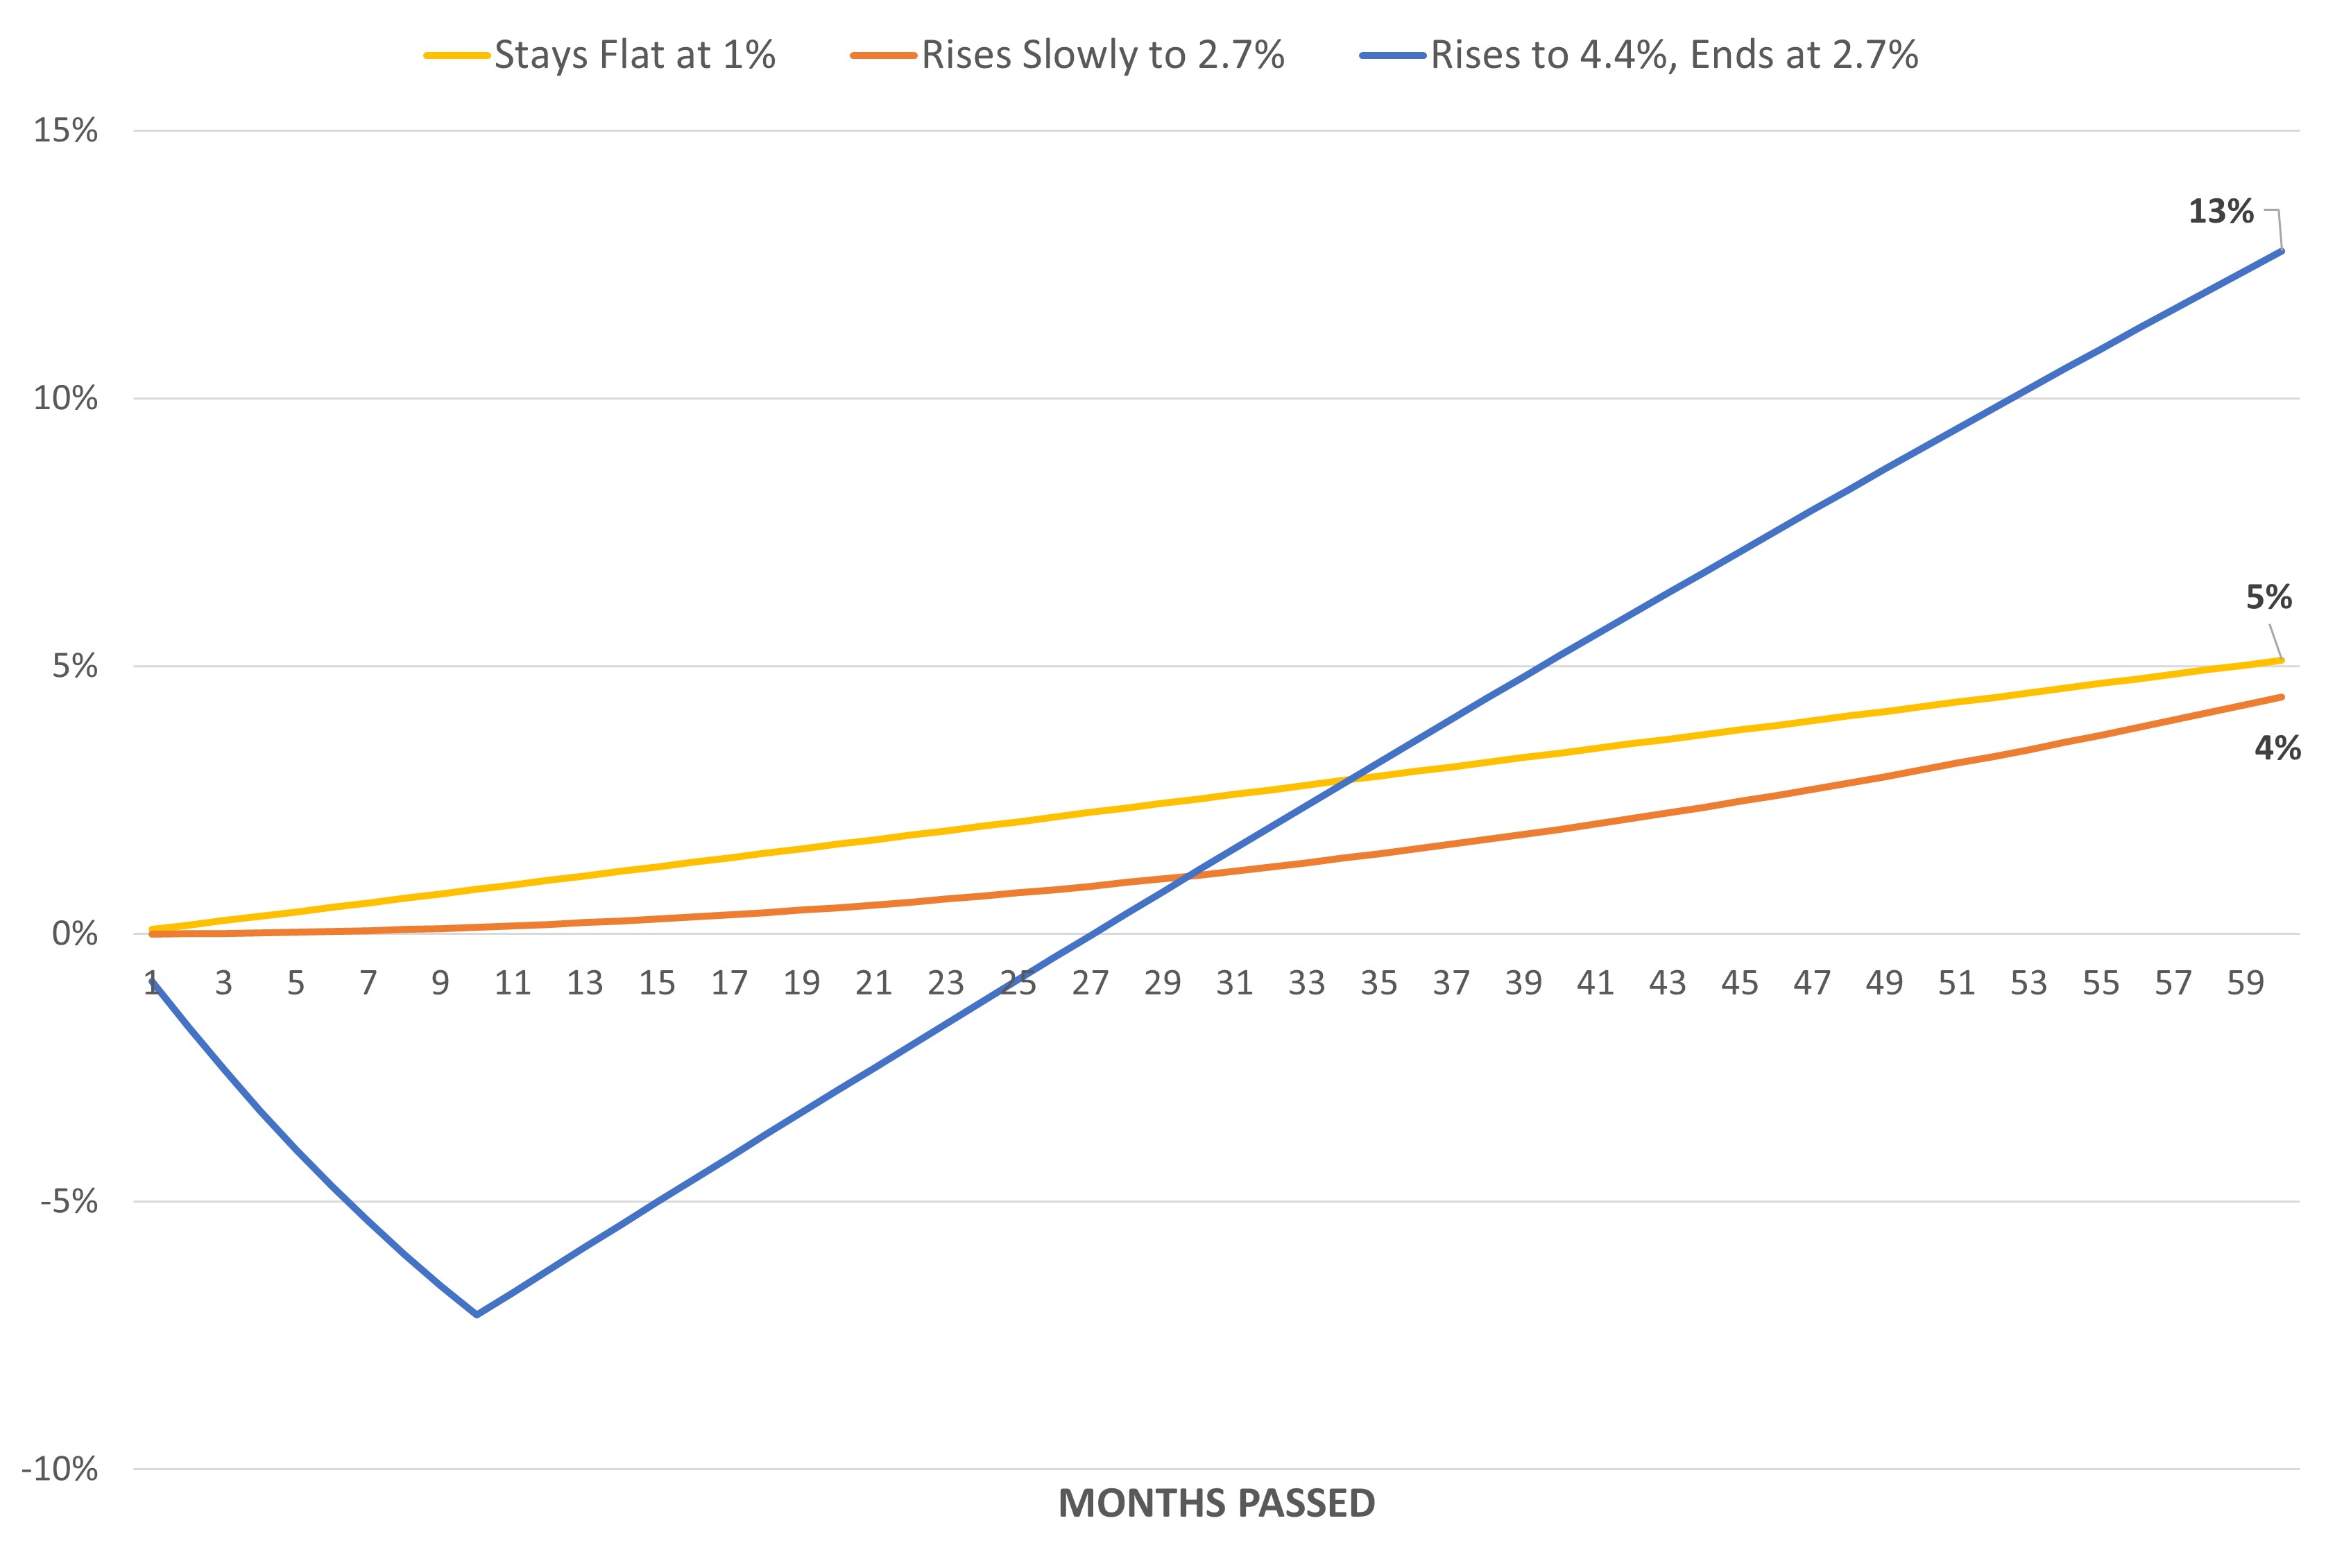
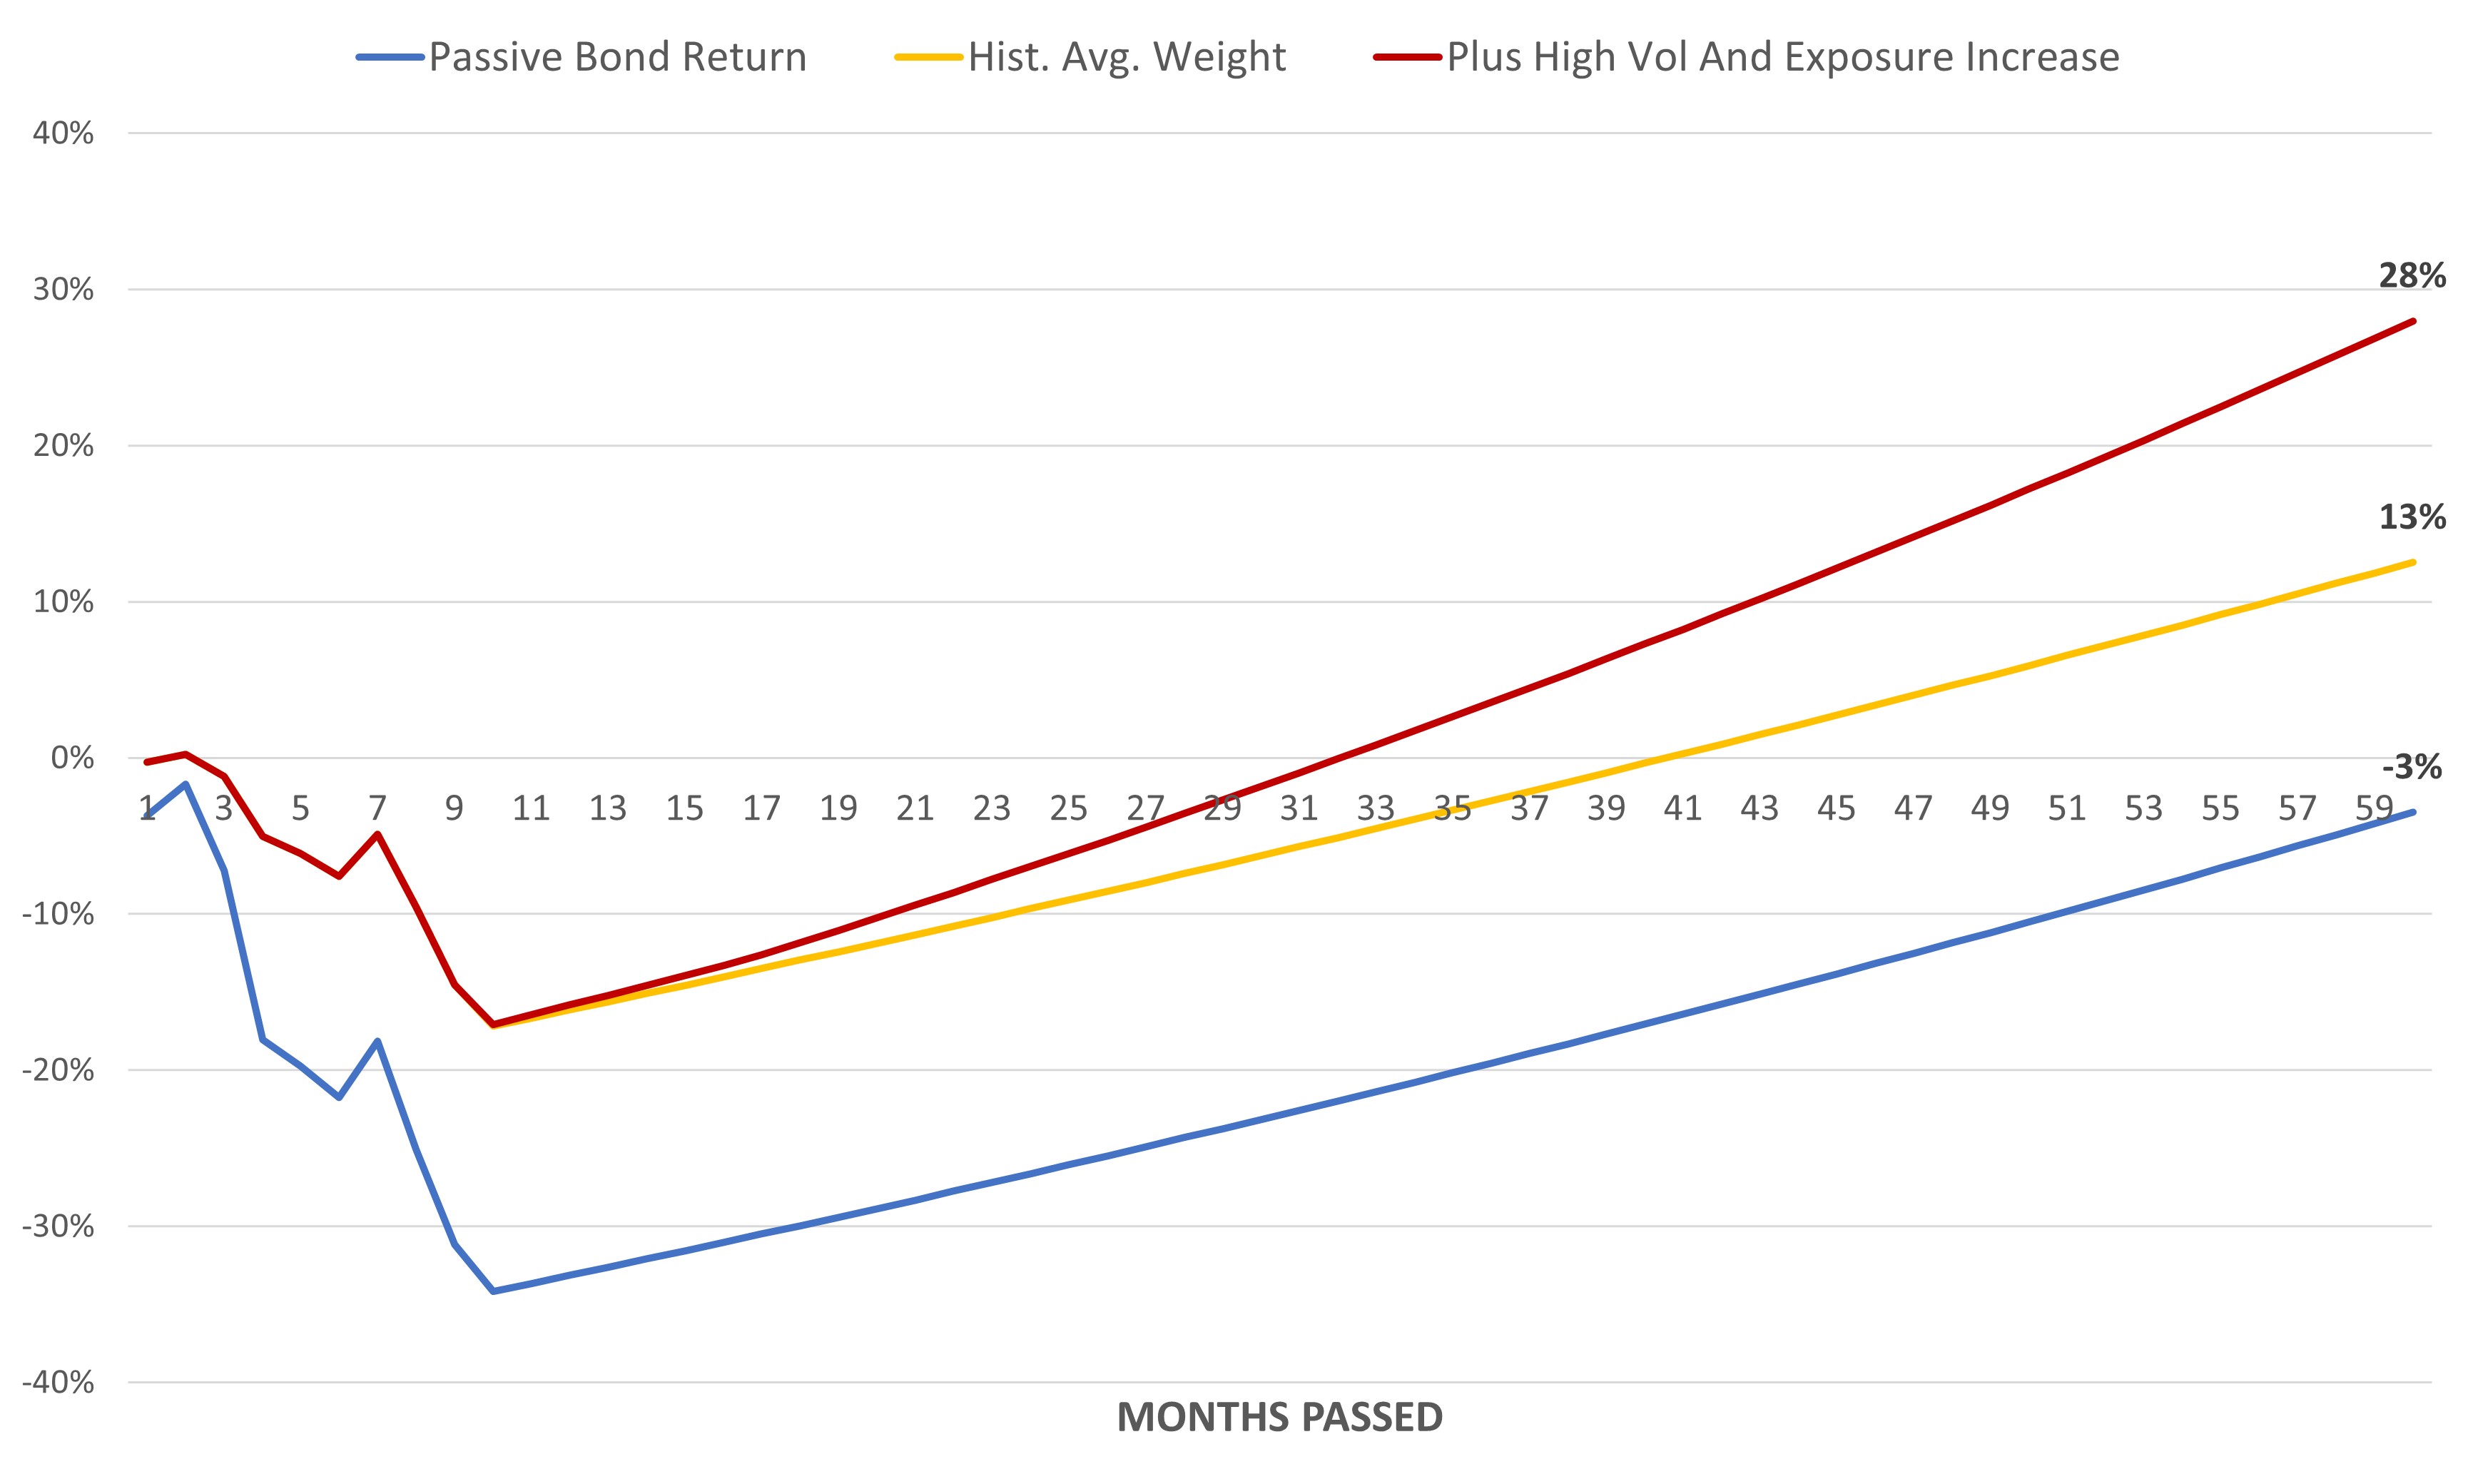
A useful way to visualize this is to rewind back to July, when 20yr rates were near 4%, and compare different expected three-year outcomes. In the following graph, the first scenario assumes that rates never exceeded 4% after July and fell slowly to 3.5% by 2026. The second scenario allows rates to rise just as they have over the past few months before falling to the same 3.5% by 2026.

July 2023 Three-Year Bond Scenarios: 4% Peak vs. 4.85% Peak

Source: Hedgewise Analysis. The Bond Impact on RP Max calculated using live recommended portfolio weights in client portfolios multiplied by an estimation of the benchmark return on 30yr nominal bonds. Includes an estimate for all coupons paid. Assumes 30yr bond yields fall to 3.5% over the remaining time in the three-year period. In the 4% scenario, bond exposure is constant at 80%. In the 4.85% scenario, bond exposure averages 100% after the interest rate peak.

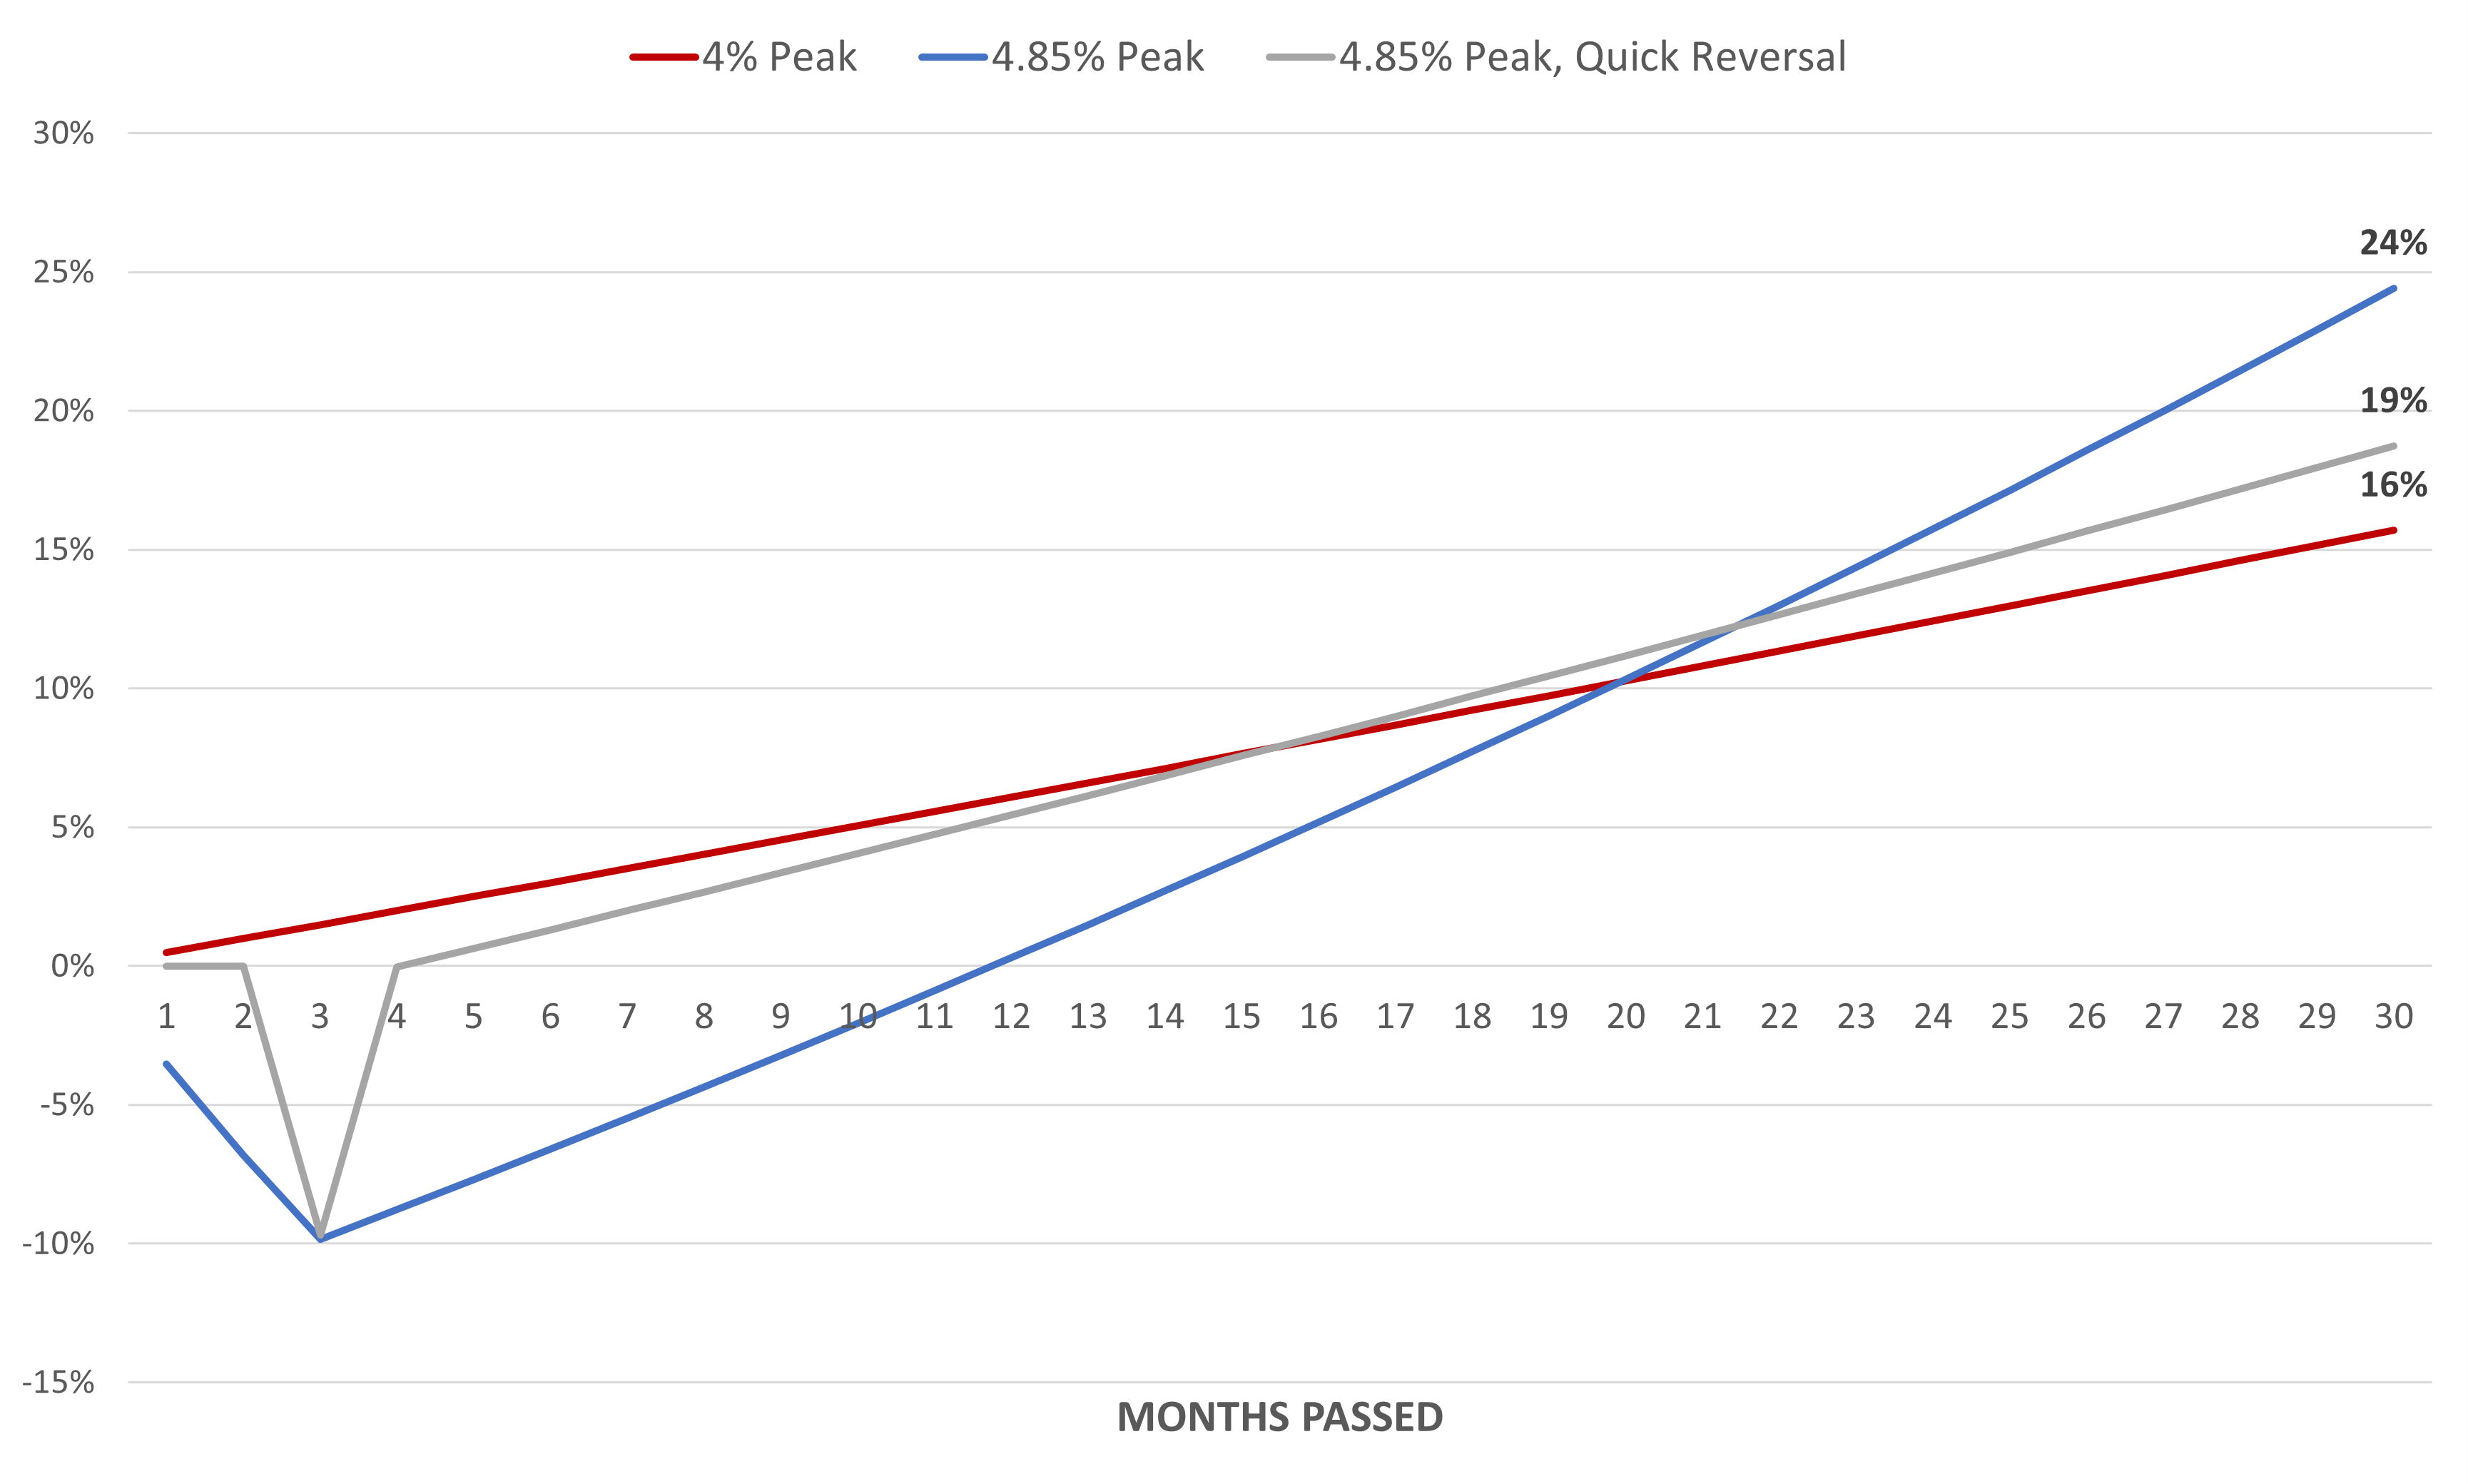
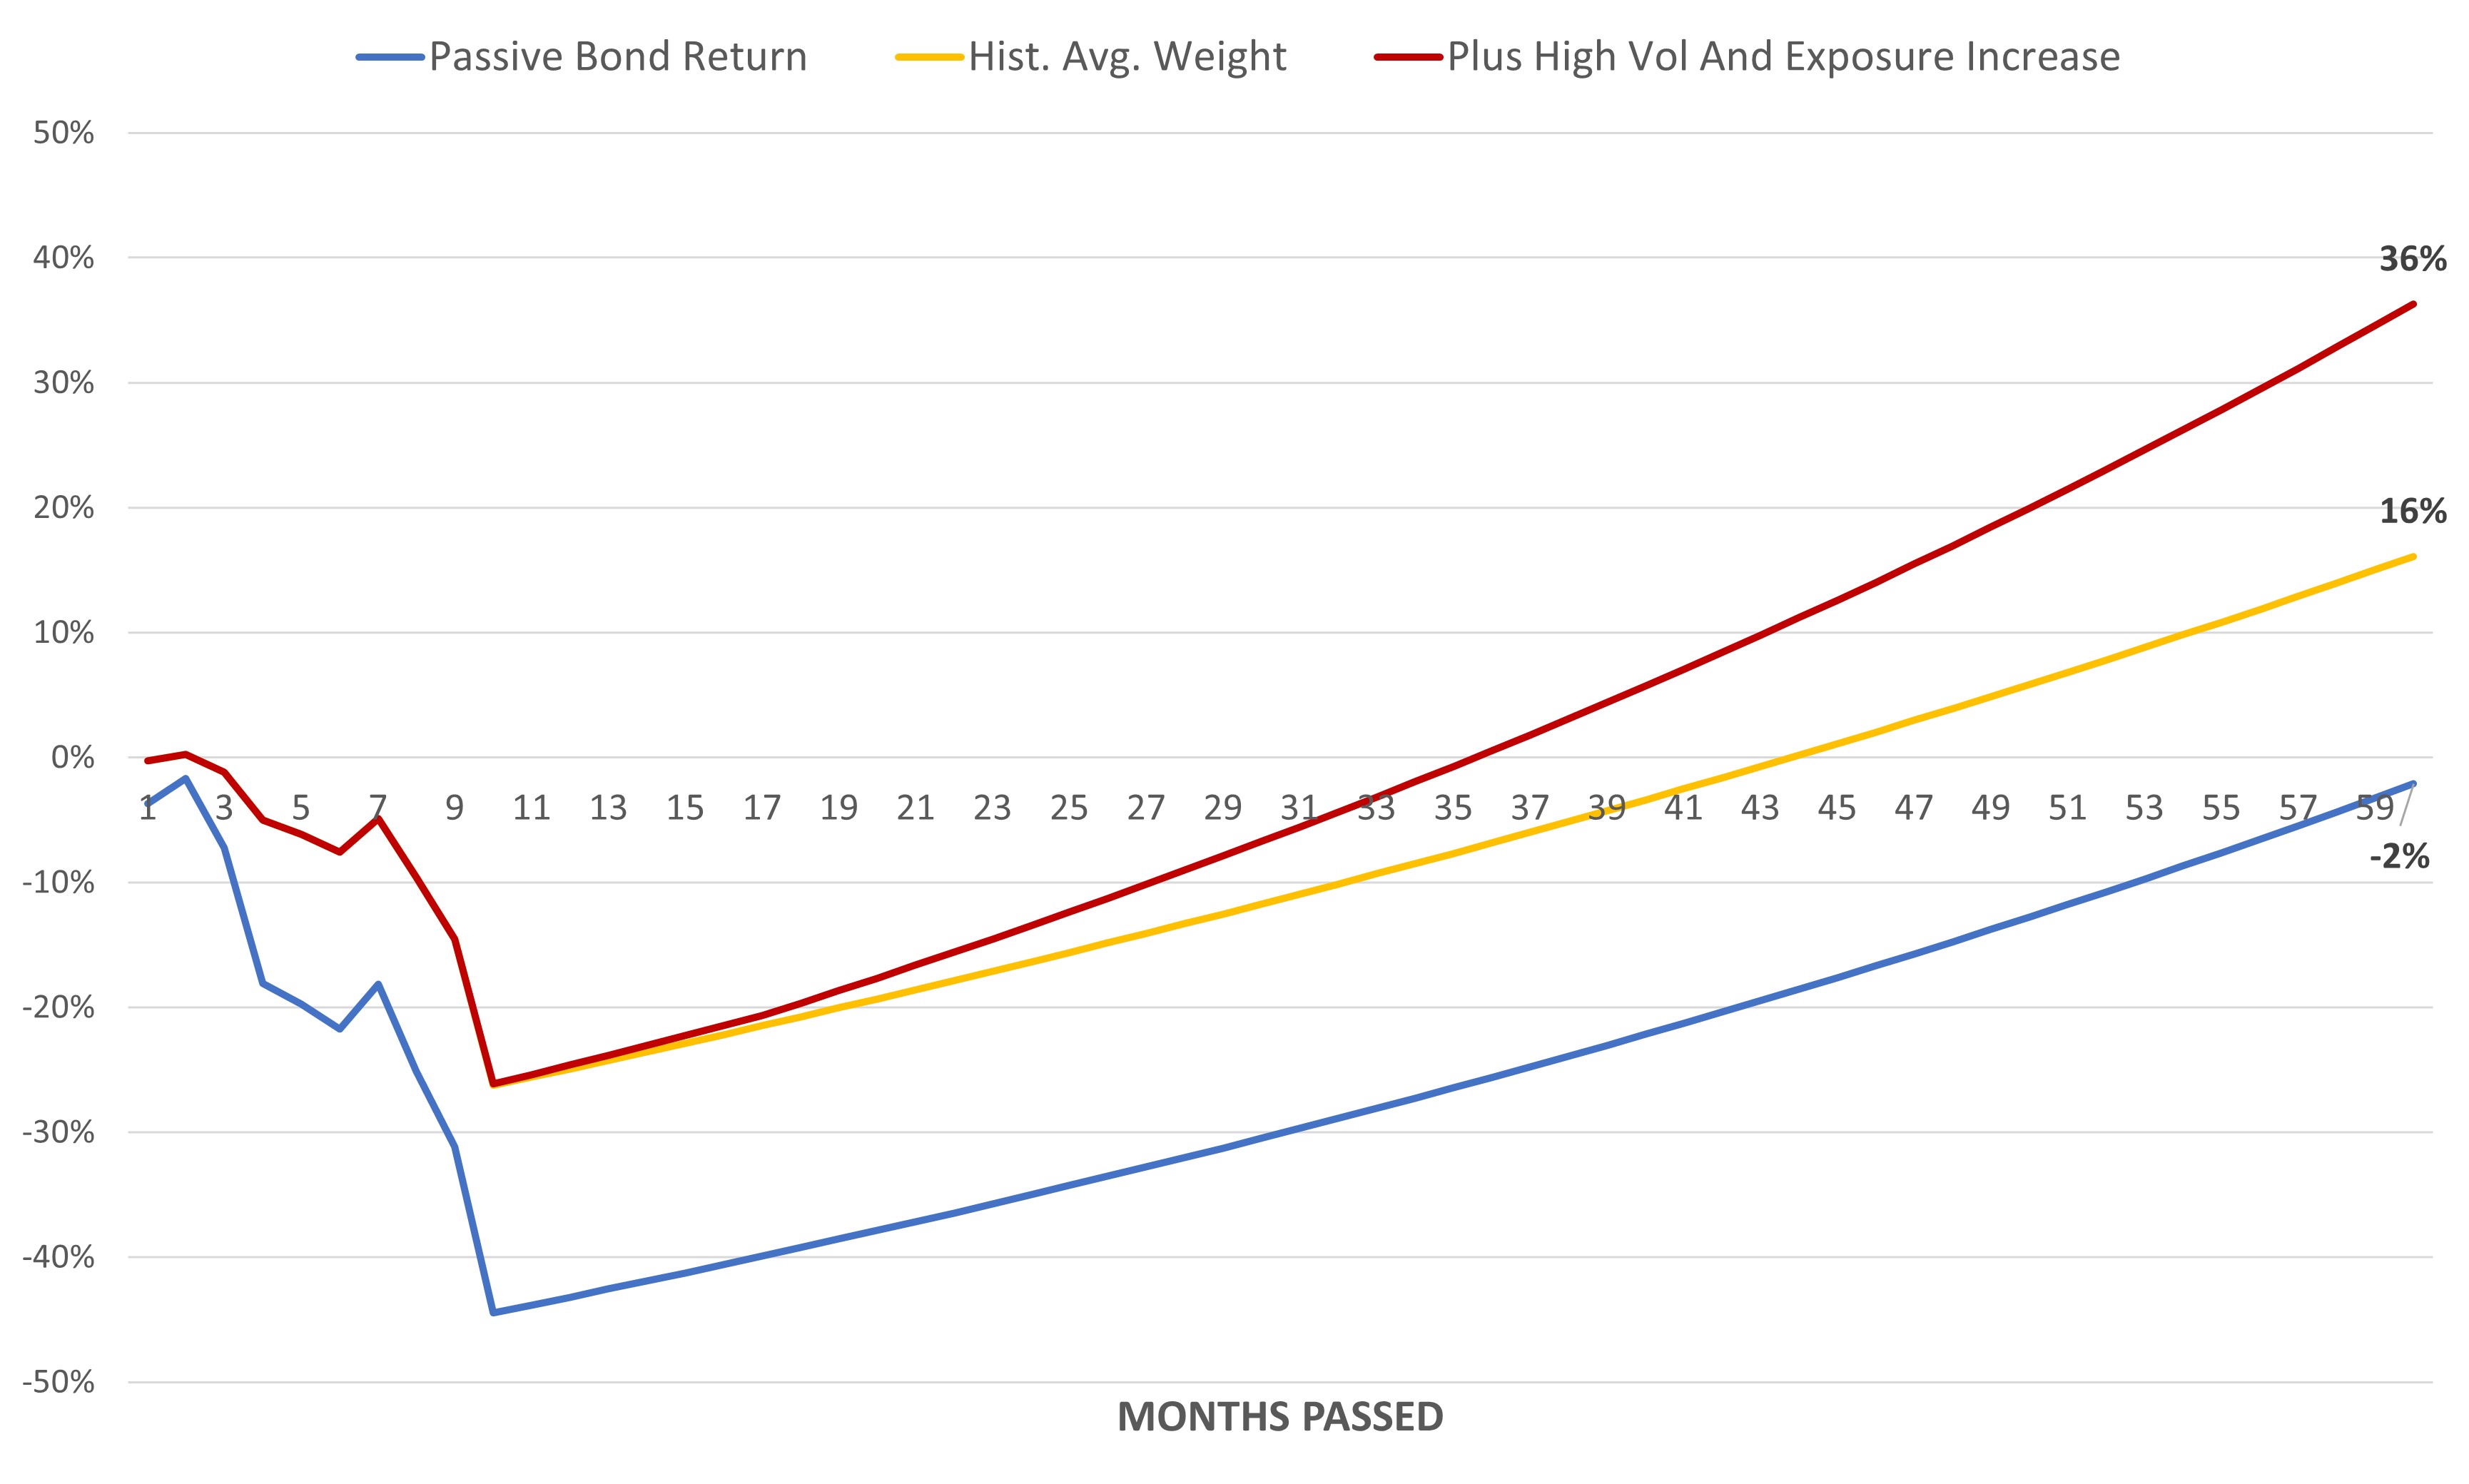
The difference between the two scenarios is driven primarily by the assumption that bond exposure is increased by 15-25% once rates peak at 4.85%. Provided that occurs, there is no doubt that the higher interest rate scenario is preferred despite the initial drawdown. However, the exact amount of additional exposure depends partially on bond volatility. The longer that bonds are stable near the peak, the higher the chance that the second scenario is fully realized. On the other hand, if rates quickly reverse course, there is less potential opportunity, as shown by the third line below.

July 2023 Three-Year Bond Scenarios: 4% Peak vs. 4.85% Peak vs. Quick Reversal

Source: Hedgewise Analysis. The Bond Impact on RP Max calculated using live recommended portfolio weights in client portfolios multiplied by an estimation of the benchmark return on 30yr nominal bonds. Includes an estimate for all coupons paid. Assumes 30yr bond yields fall to 3.5% over the remaining time in the three-year period. In the 4% scenario, bond exposure is constant at 80%. In the 4.85% scenario, bond exposure averages 100% after the interest rate peak. In the Quick Reversal scenario, bond exposure is constant at 80%, but the additional volatility adds 1% annualized to expected returns.

So, all else equal, we prefer interest rates to overshoot, and we prefer for them to stay there a while. This may be uncomfortable due to the initial drawdown, and dramatic intraday volatility may fray nerves further. Yet it is still the optimal outcome, and there truly is little long-term danger. Even if rates stay at 4.85% until 2026, you will have been paid that coupon throughout while maintaining the potential upside. The logic remains true at a peak rate of 5%, 5.5%, and even 6%.

The single key underlying assumption is that interest rates above 3% truly are restrictive. That isn't really the debate happening in the market right now; most pundits are focused on the fiscal deficit and the inability to find enough buyers for an increasingly large amount of government debt. If that is the main story, it is only making already painful rates hurt even more (because a large debt auction has no offsetting positive macroeconomic impact). There is no ending besides one where the economy slows or reverses.

The only scenario where such high rates are not restrictive is one where real economic growth is extraordinarily strong, which has nothing to do with these supply/demand issues. To provide some context, the Fed estimates the neutral real rate of interest to be about ~1% under real annual GDP growth. To justify a real rate of 2.5% (where it is around now), real GDP growth would need to average 3.5%. Historically, this rate averaged 2.0% in the 2010s, 1.9% in the 2000s, 3.2% in the 1990s, and 3.1% in the 1980s. It is exceedingly difficult to imagine we are entering the fastest period of growth in the past 40 years, but this is what would need to make sense to worry about whether these rates are here to stay.

This may suggest the potential impact of AI, but that theory has several holes in it. If that technology is going to supercharge global growth, it wouldn't only impact the US while Europe and China struggle as they have been recently. It also doesn't follow that the catalyst for higher rates would be increased Treasury debt issuance, as opposed to news about AI's impact on earnings and employment. Even if AI has some real role, the current level of rates would already account for faster growth than the dot-com era.

However, the main takeaway is not about predicting the future or figuring out exactly what is going on with interest rates. The point is that the potential outcomes are lopsided to the upside. Over the next year, even another 0.5% increase in the 20yr rate will be almost fully offset by ongoing coupon payments. If the economy is being restricted at these levels, it is essentially assured that rates will come down. The more restrictive rates become and the longer they persist, the lower the eventual terminal rate is expected to be. Even if AI really is the next coming of the internet, and fiscal spending continues unabated, the current real interest rate already accounts for these factors. It is very hard to envision a world where 20yr bonds are a poor investment over the next few years.

I have no idea what will happen day-to-day, and volatility will likely continue until this all has time to work through the real economy. But from a 12-month perspective, there is little reason to worry and more reason to cheer on the crazy swings so we can take advantage of it - with no timing required.

Disclosure

This information does not constitute investment advice or an offer to invest or to provide management services and is subject to correction, completion and amendment without notice. Hedgewise makes no warranties and is not responsible for your use of this information or for any errors or inaccuracies resulting from your use. Hedgewise may recommend some of the investments mentioned in this article for use in its clients' portfolios. Past performance is no indicator or guarantee of future results. Investing involves risk, including the risk of loss. All performance data shown prior to the inception of each Hedgewise framework (Risk Parity in October 2014, Momentum in November 2016) is based on a hypothetical model and there is no guarantee that such performance could have been achieved in a live portfolio, which would have been affected by material factors including market liquidity, bid-ask spreads, intraday price fluctuations, instrument availability, and interest rates. Model performance data is based on publicly available index or asset price information and all dividend or coupon payments are included and assumed to be reinvested monthly. Hedgewise products have substantially different levels of volatility and exposure to separate risk factors, such as commodity prices and the use of leverage via derivatives, compared to traditional benchmarks like the S&P 500. Any comparisons to benchmarks are provided as a generic baseline for a long-term investment portfolio and do not suggest that Hedgewise products will exhibit similar characteristics. When live client data is shown, it includes all fees, commissions, and other expenses incurred during management. Only performance figures from the earliest live client accounts available or from a composite average of all client accounts are used. Other accounts managed by Hedgewise will have performed slightly differently than the numbers shown for a variety of reasons, though all accounts are managed according to the same underlying strategy model. Hedgewise relies on sophisticated algorithms which present technological risk, including data availability, system uptime and speed, coding errors, and reliance on third party vendors.

September 2023: When Volatility Is Welcome
Posted in Market Commentary on 2023-09-02

Summary

  • The volatility in August was caused primarily by Treasury bonds, where such swings are automatically taken advantage of by the risk model and carry little meaning longer-term.
  • Hedgewise has continued to outperform its benchmark this year after beating it by nearly 10% in 2022, which is a testament to the ongoing success of its techniques.
  • The primary danger for clients is to overreact to short-term drawdowns which effectively improve the medium and long-term outlook.

Introduction: Looking Through the Noise of August

After a relatively boring summer, August arrived with a bang, especially in the Treasury market. Thirty-year yields have soared from around 3.8% to 4.3% since mid-July, despite relatively little news, and at one point surpassed their highs of last October. It has been a stressful few weeks, not least because there lacks a cohesive and rational explanation. The fact that this happened in August, when liquidity is typically thin, has only added to uncertainty and exacerbated daily swings.

While it is natural to seek an explanation, the fortunate reality is that it does not matter very much, especially from a Hedgewise perspective. For some broader context, maddening volatility has been a feature of the past twelve months. Last October, 30yr yields jumped from 3.25% to 4.25% in three weeks, only to fall back down to 3.5% a month later. A compelling rationale remains elusive and will likely remain that way. The most relevant lesson is not in explaining exactly what happened, but rather in understanding that such events are better off ignored. While this is true broadly, it is even more applicable when seen through the lens of risk management.

From a Hedgewise perspective, the main theme since last year has been how to maximize the potential upside of a recovery after successfully mitigating losses in 2022. Prior articles discussed why a choppier environment would be preferred because it would present additional opportunity for gain. While this is true across all asset classes, it is especially relevant to Treasury bonds.

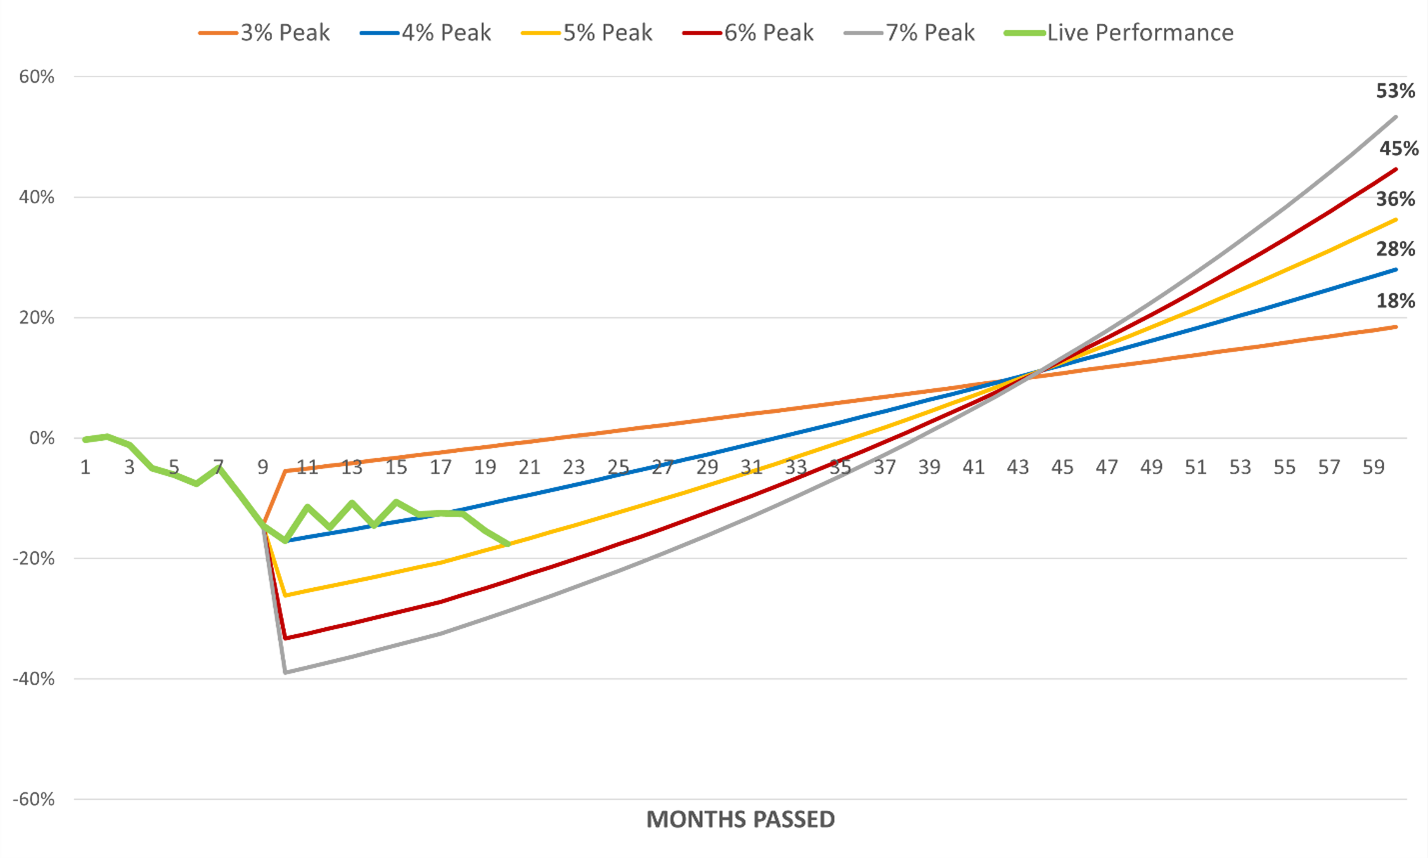
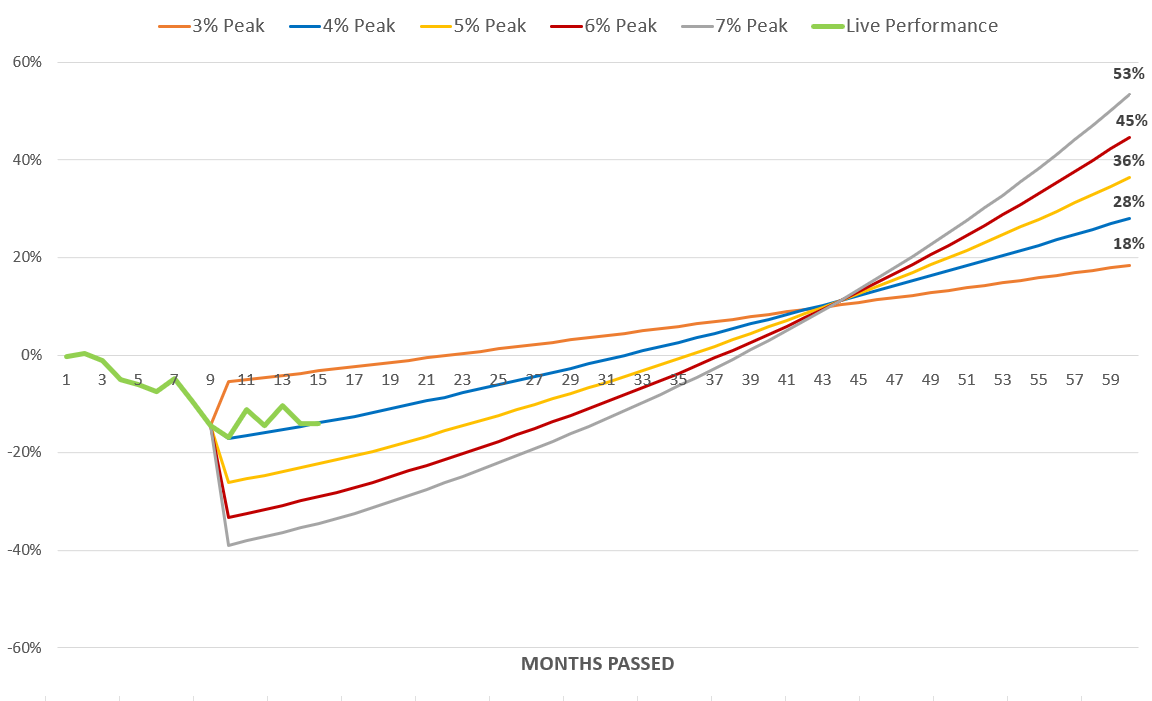
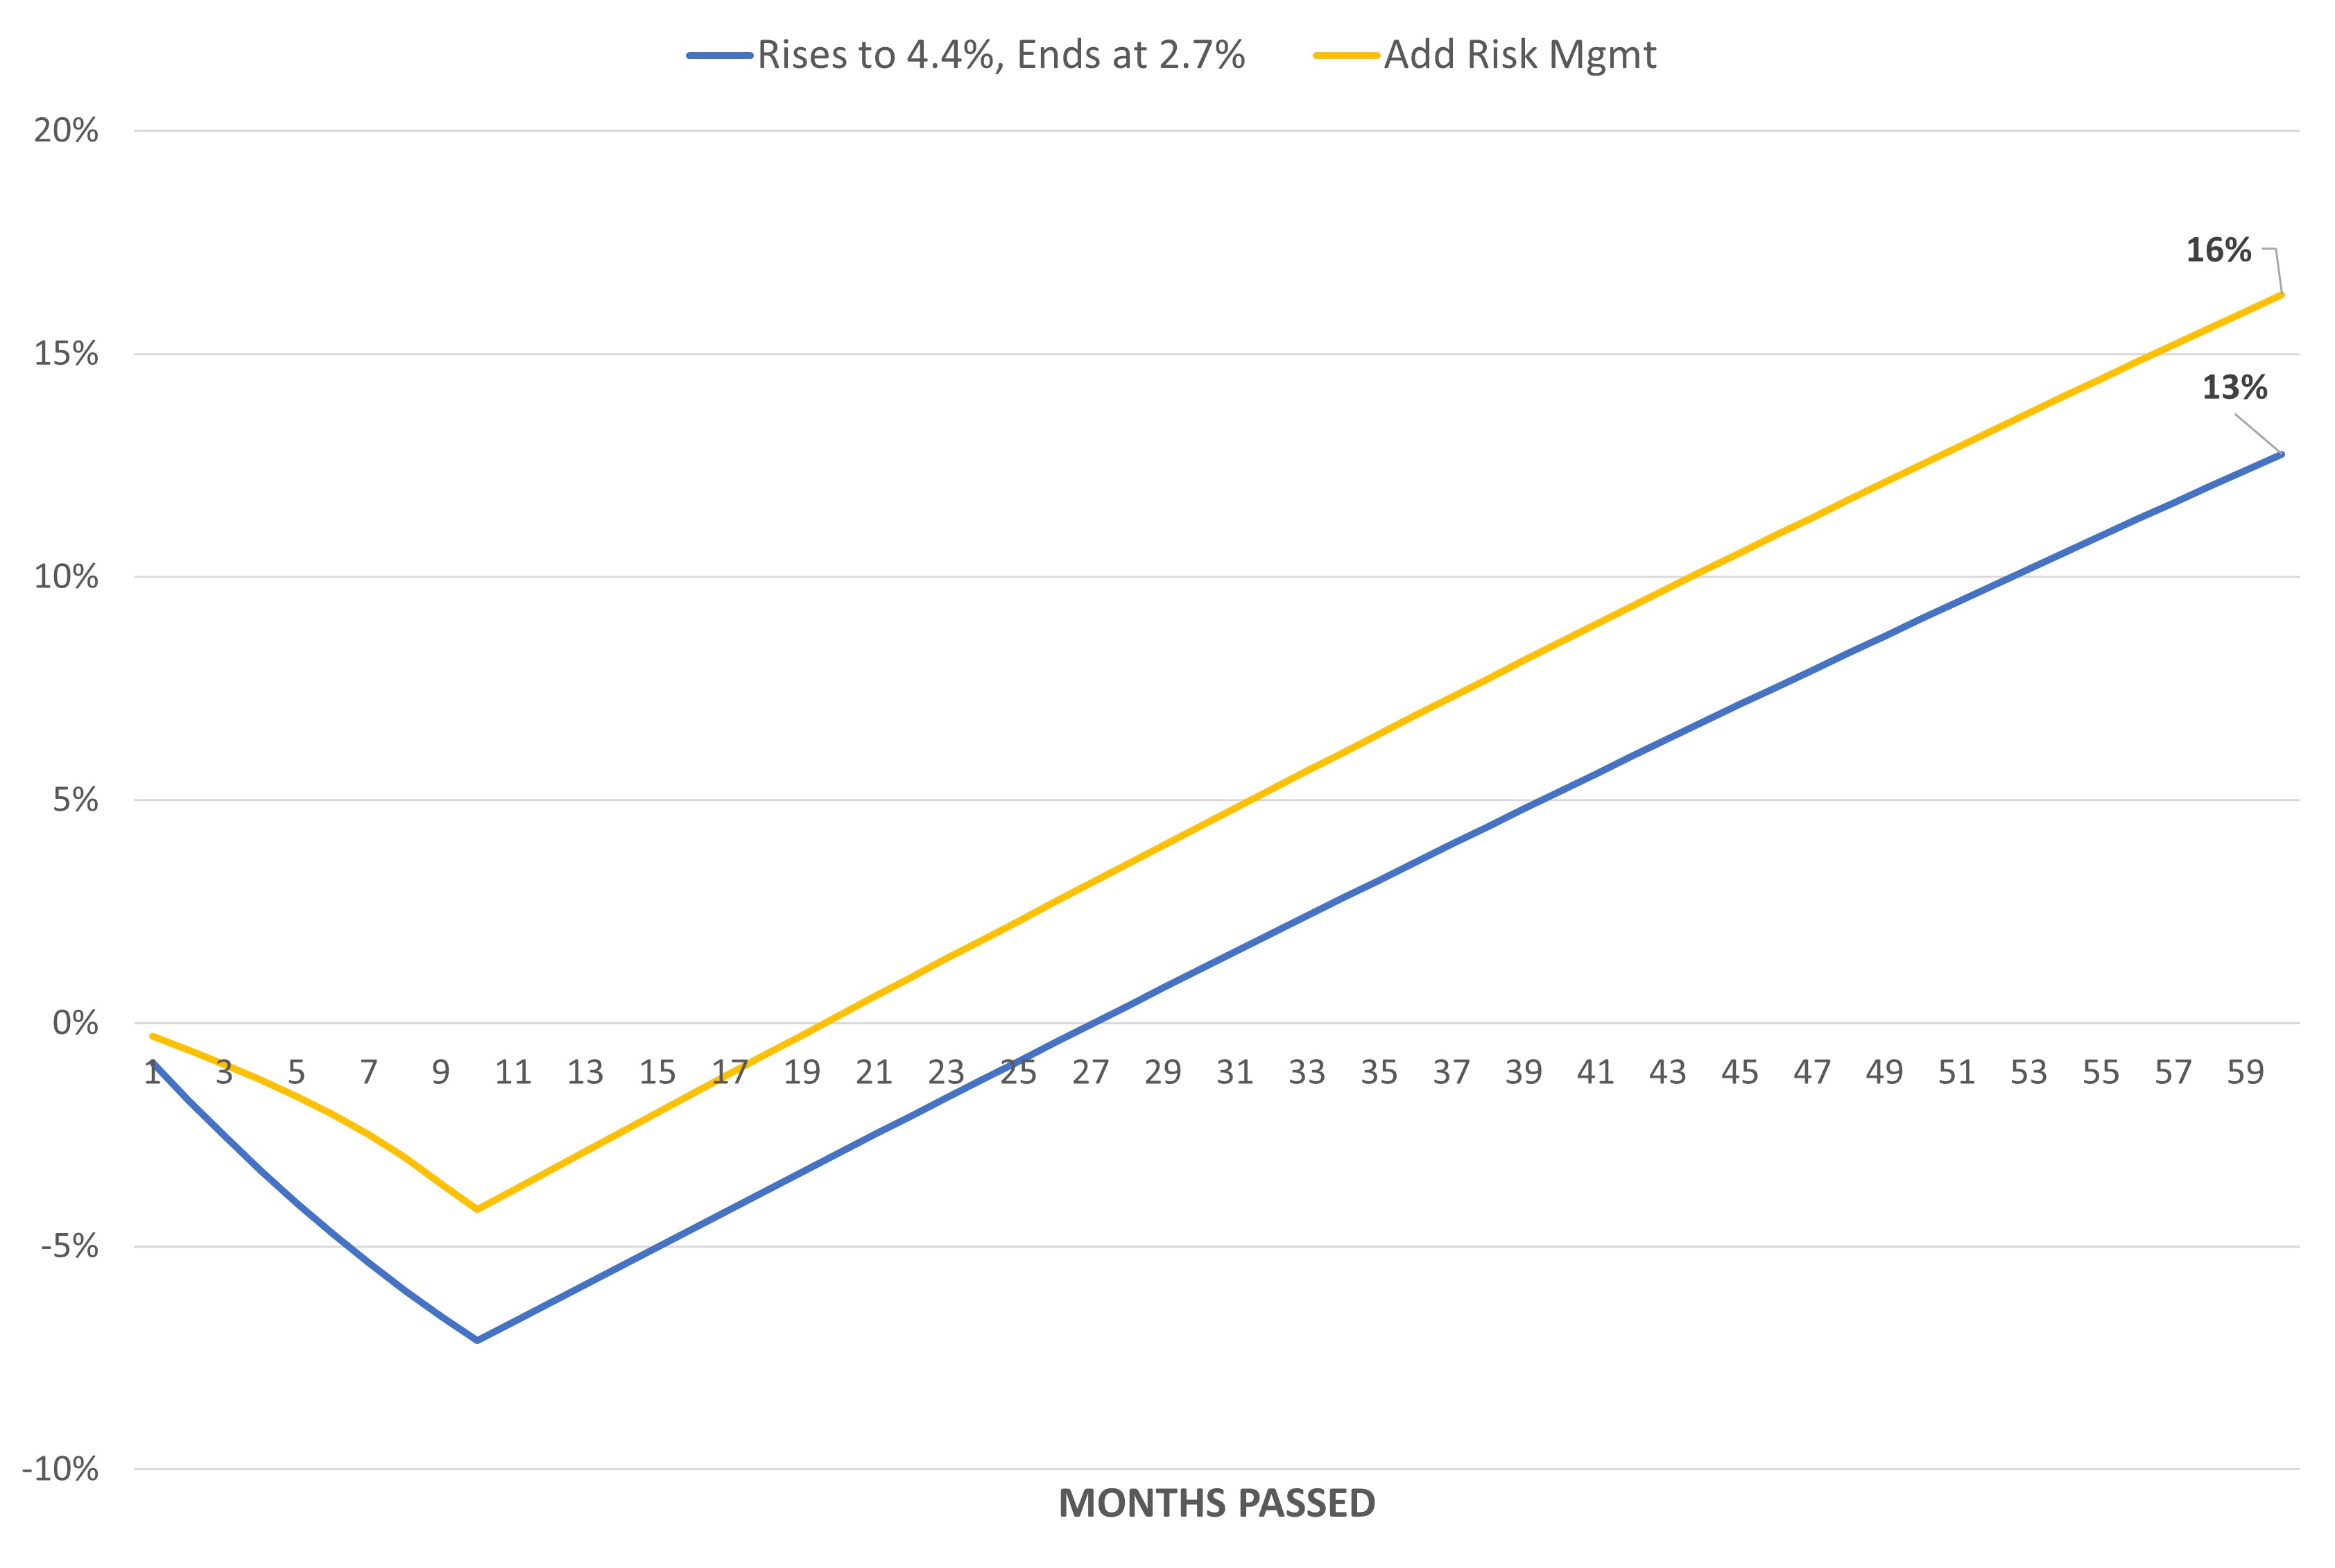
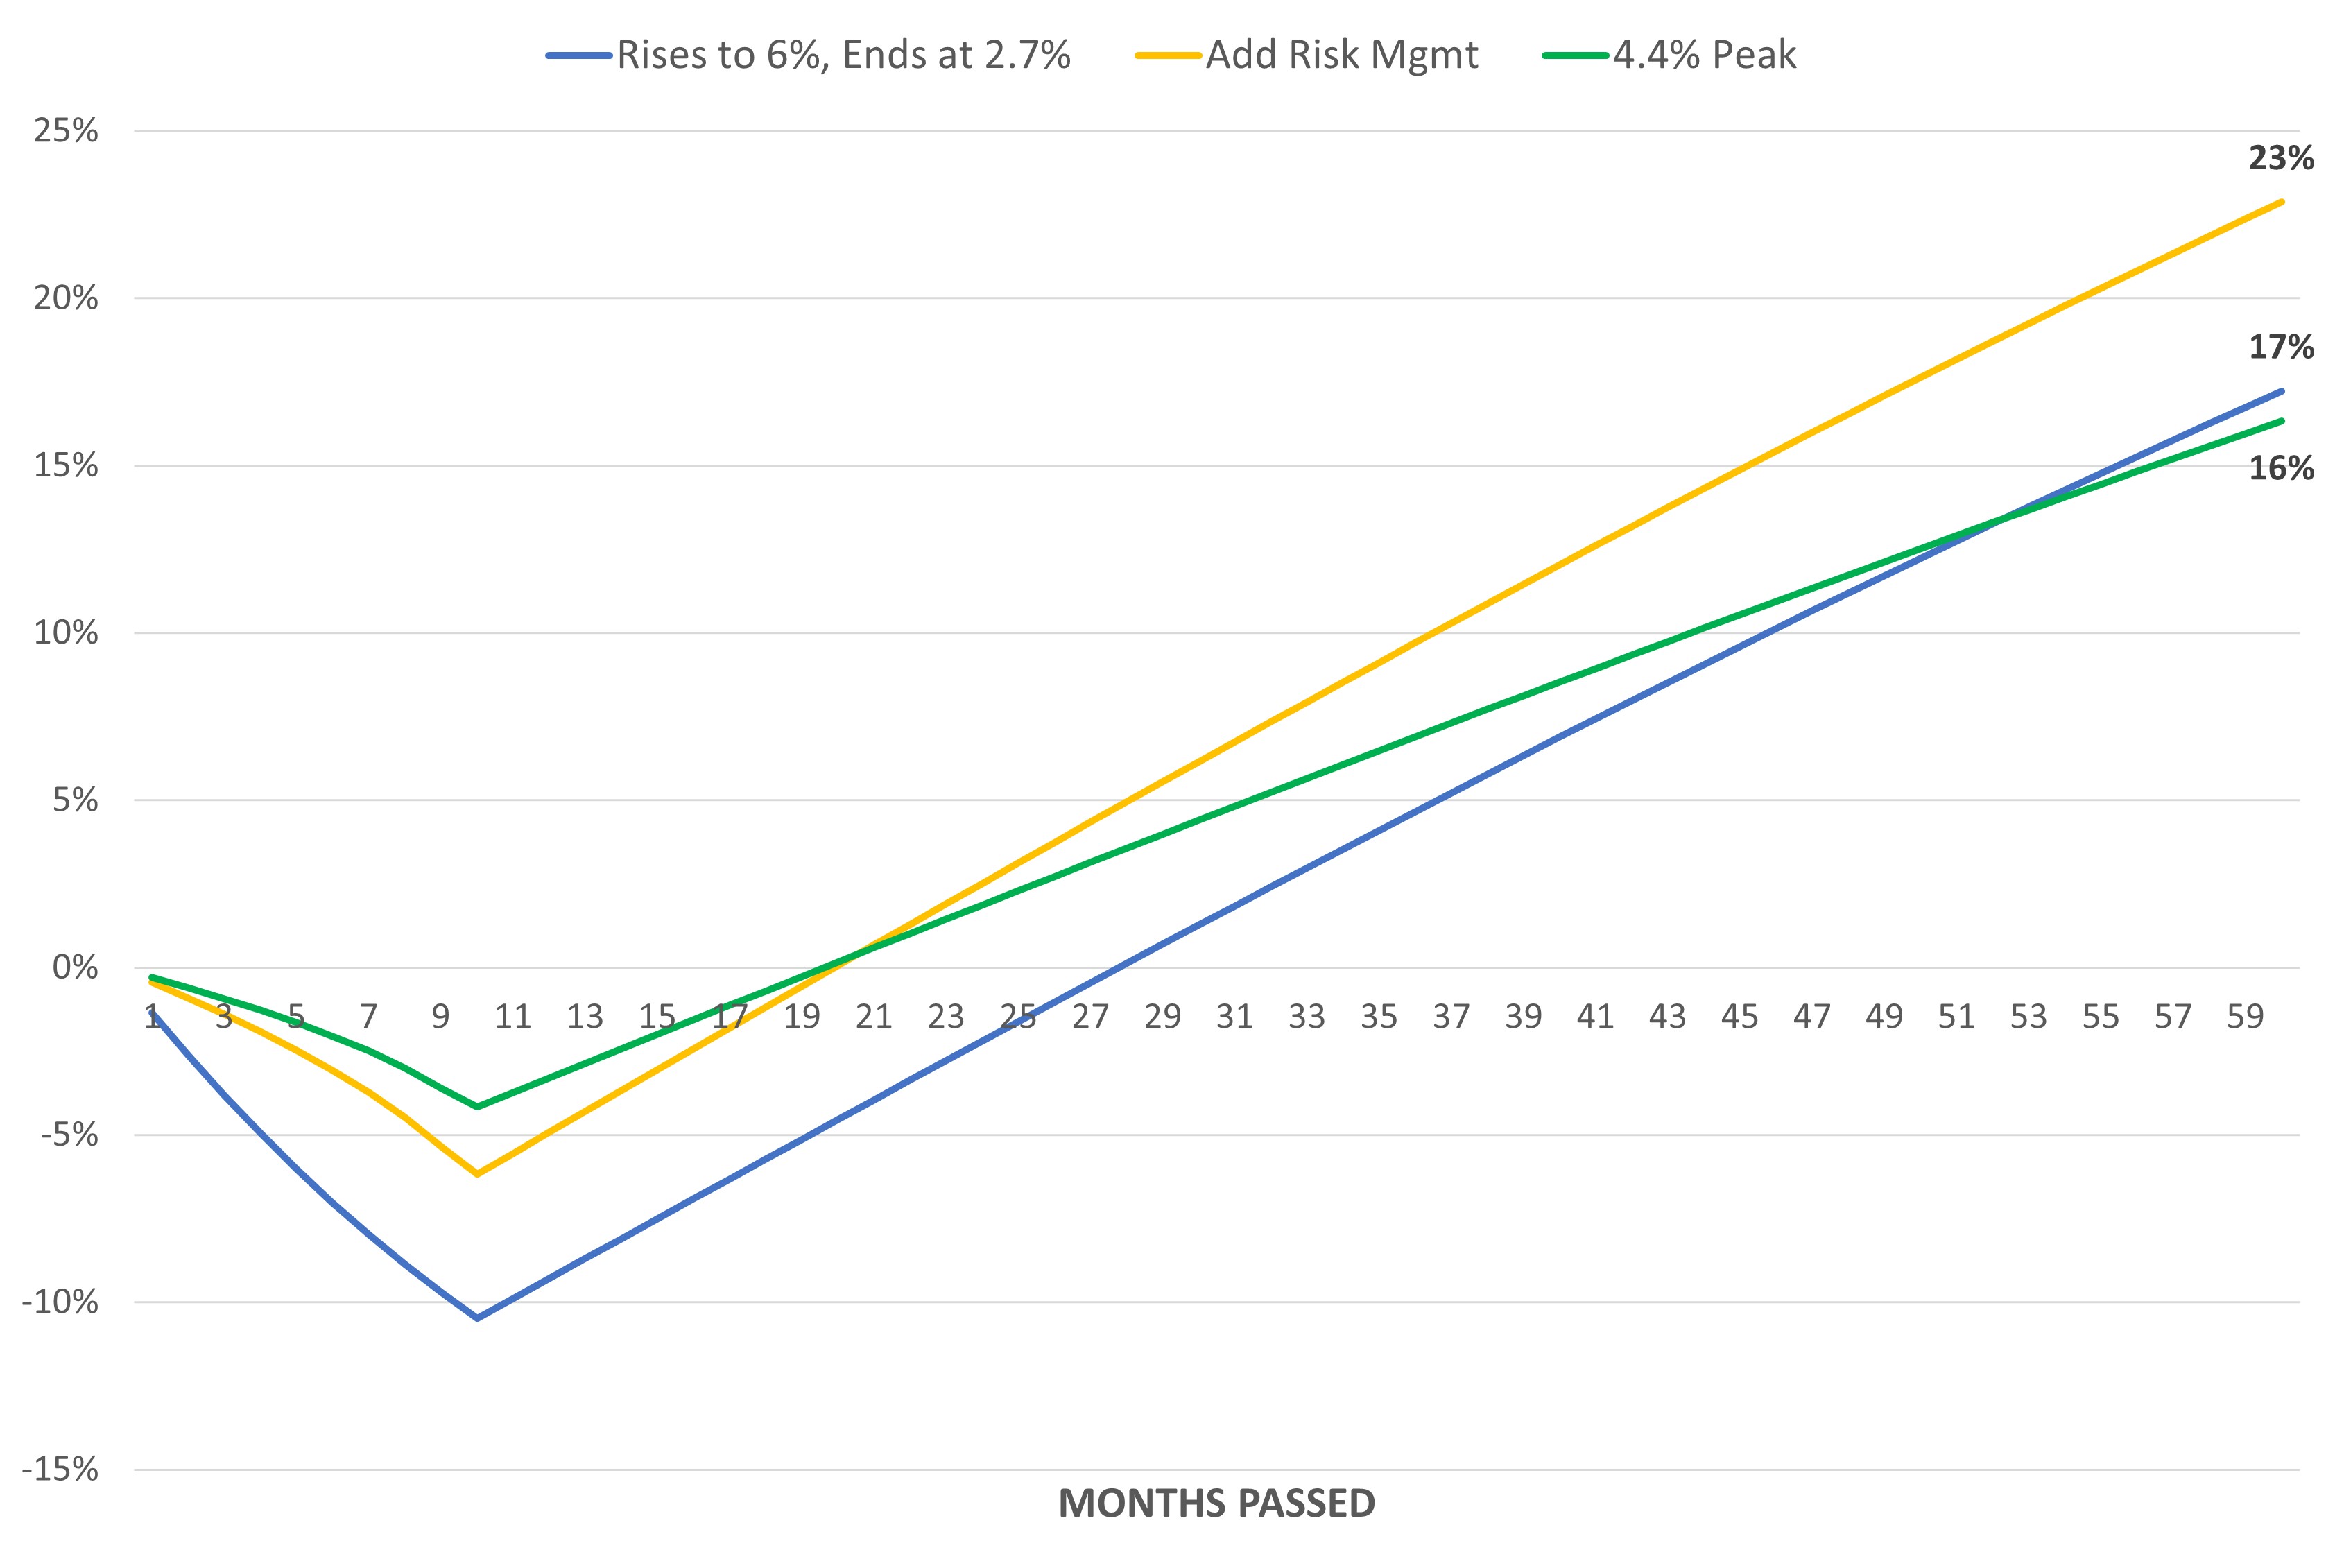
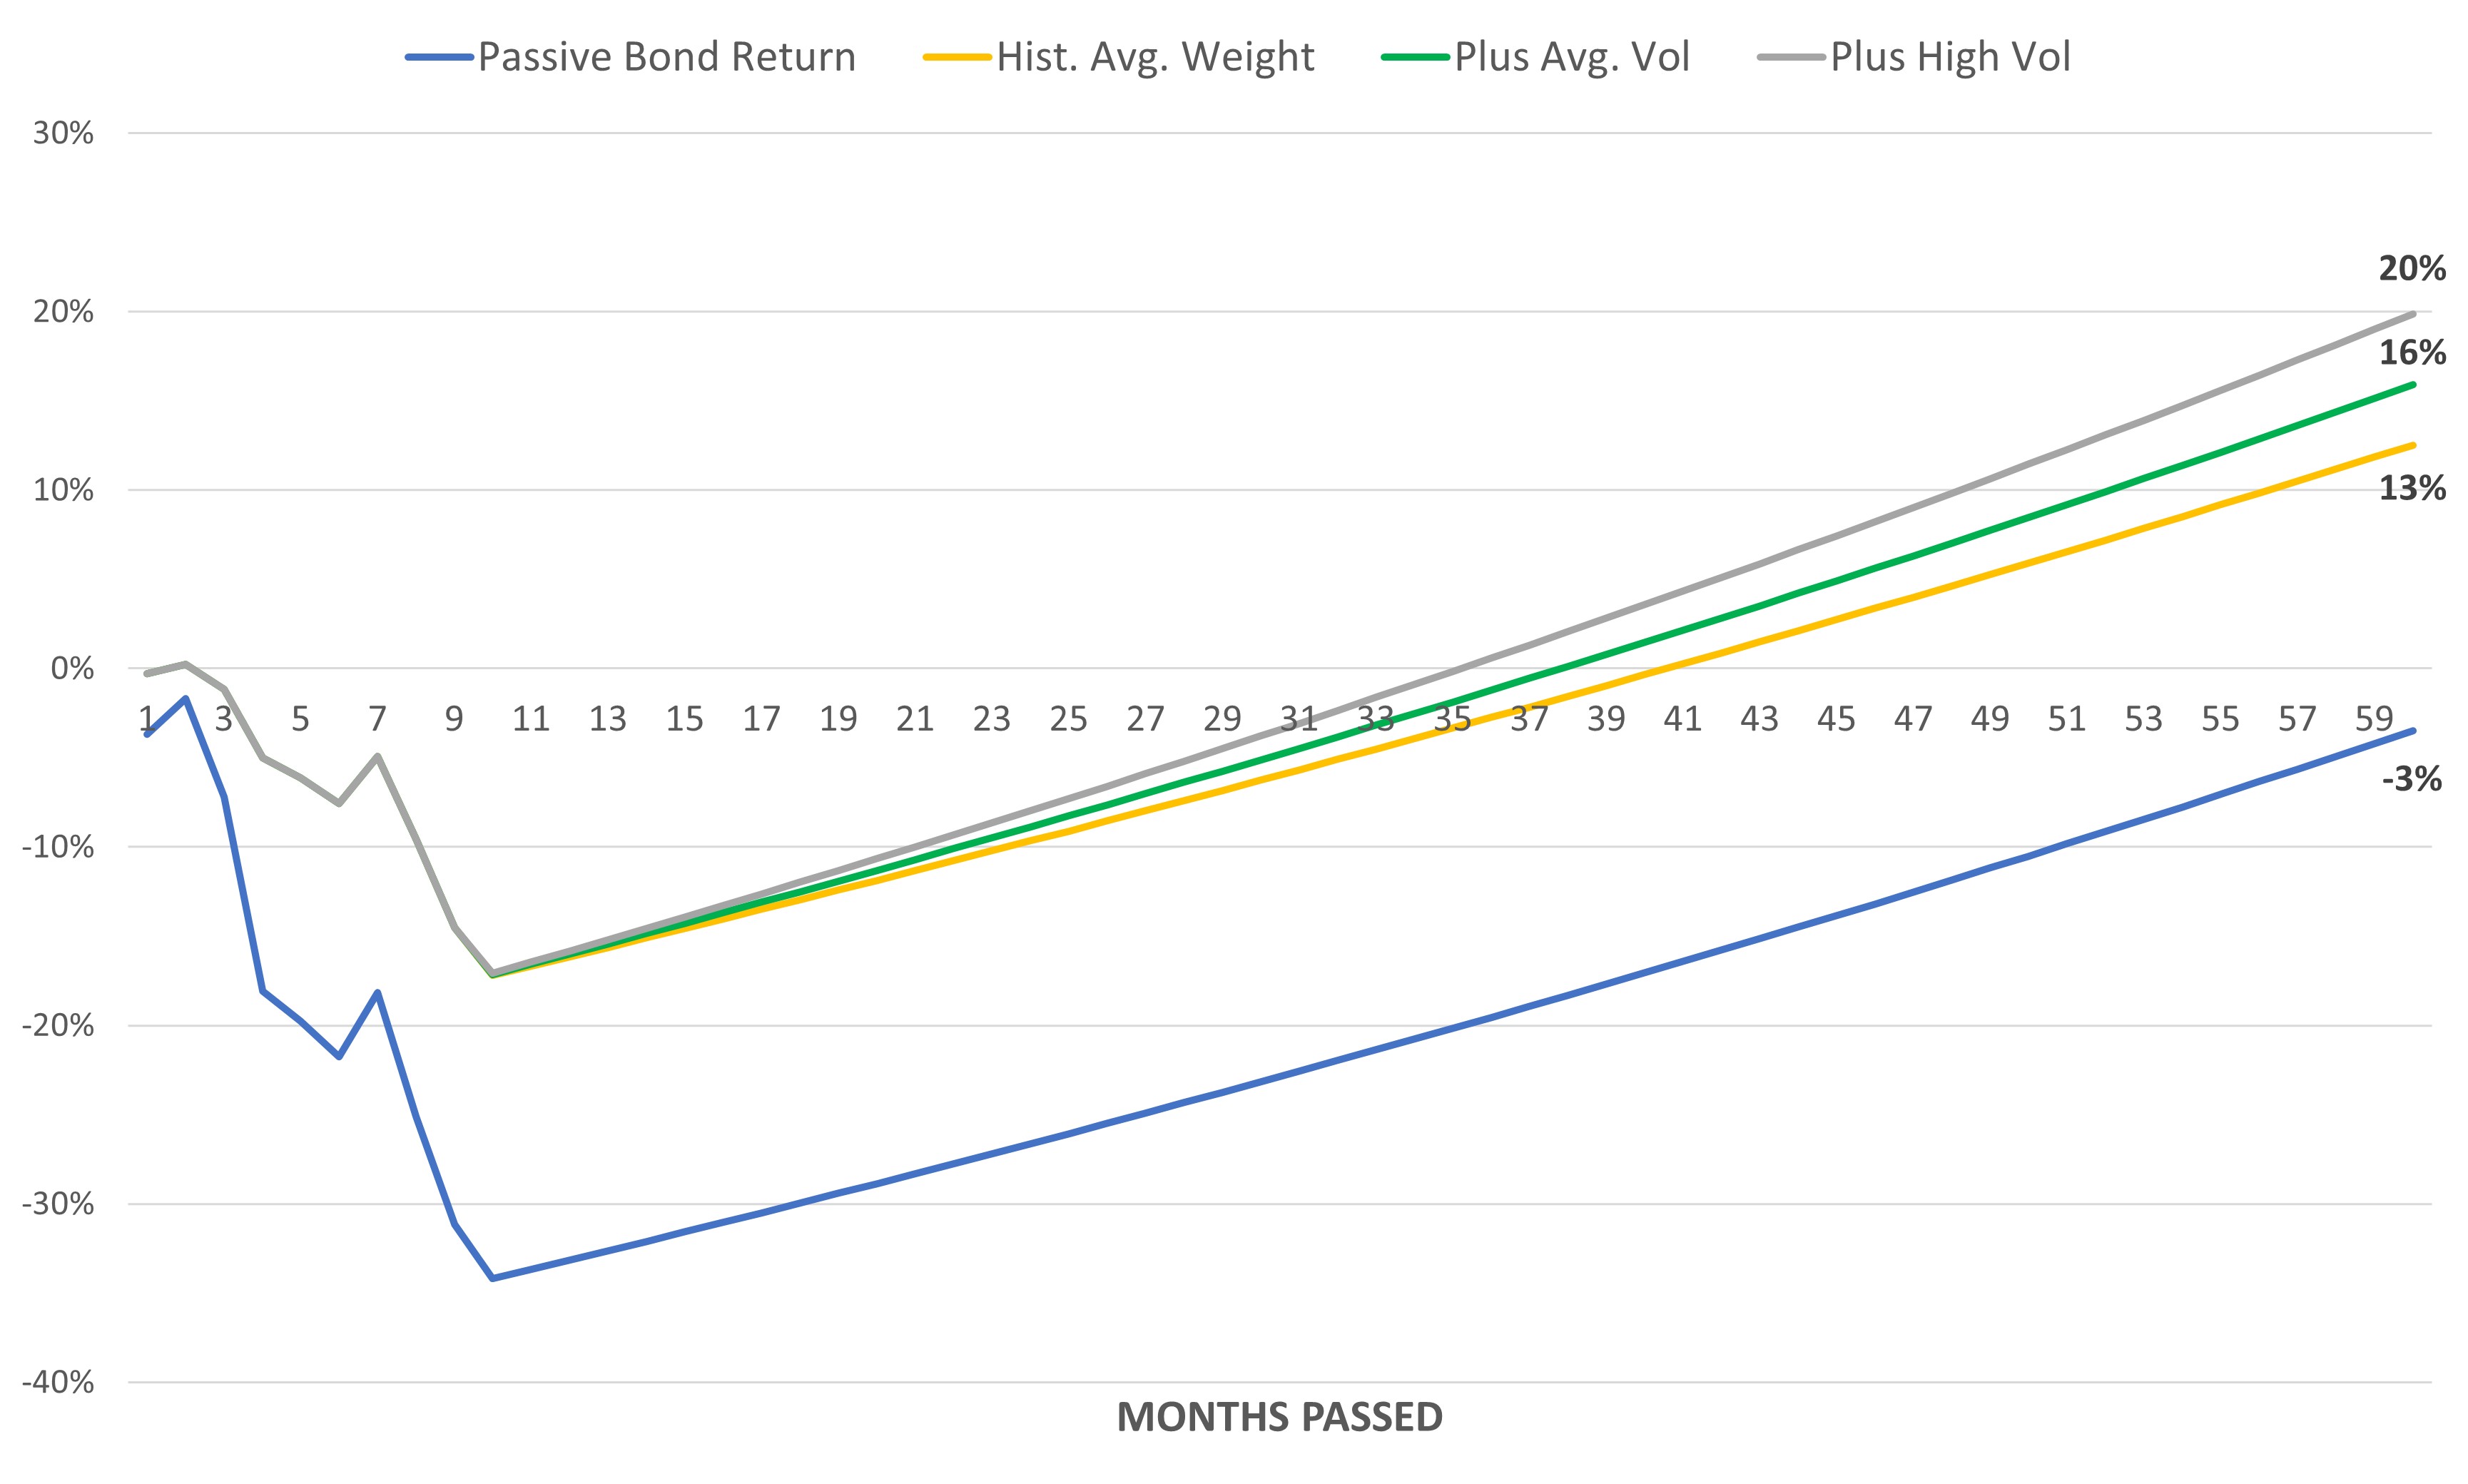
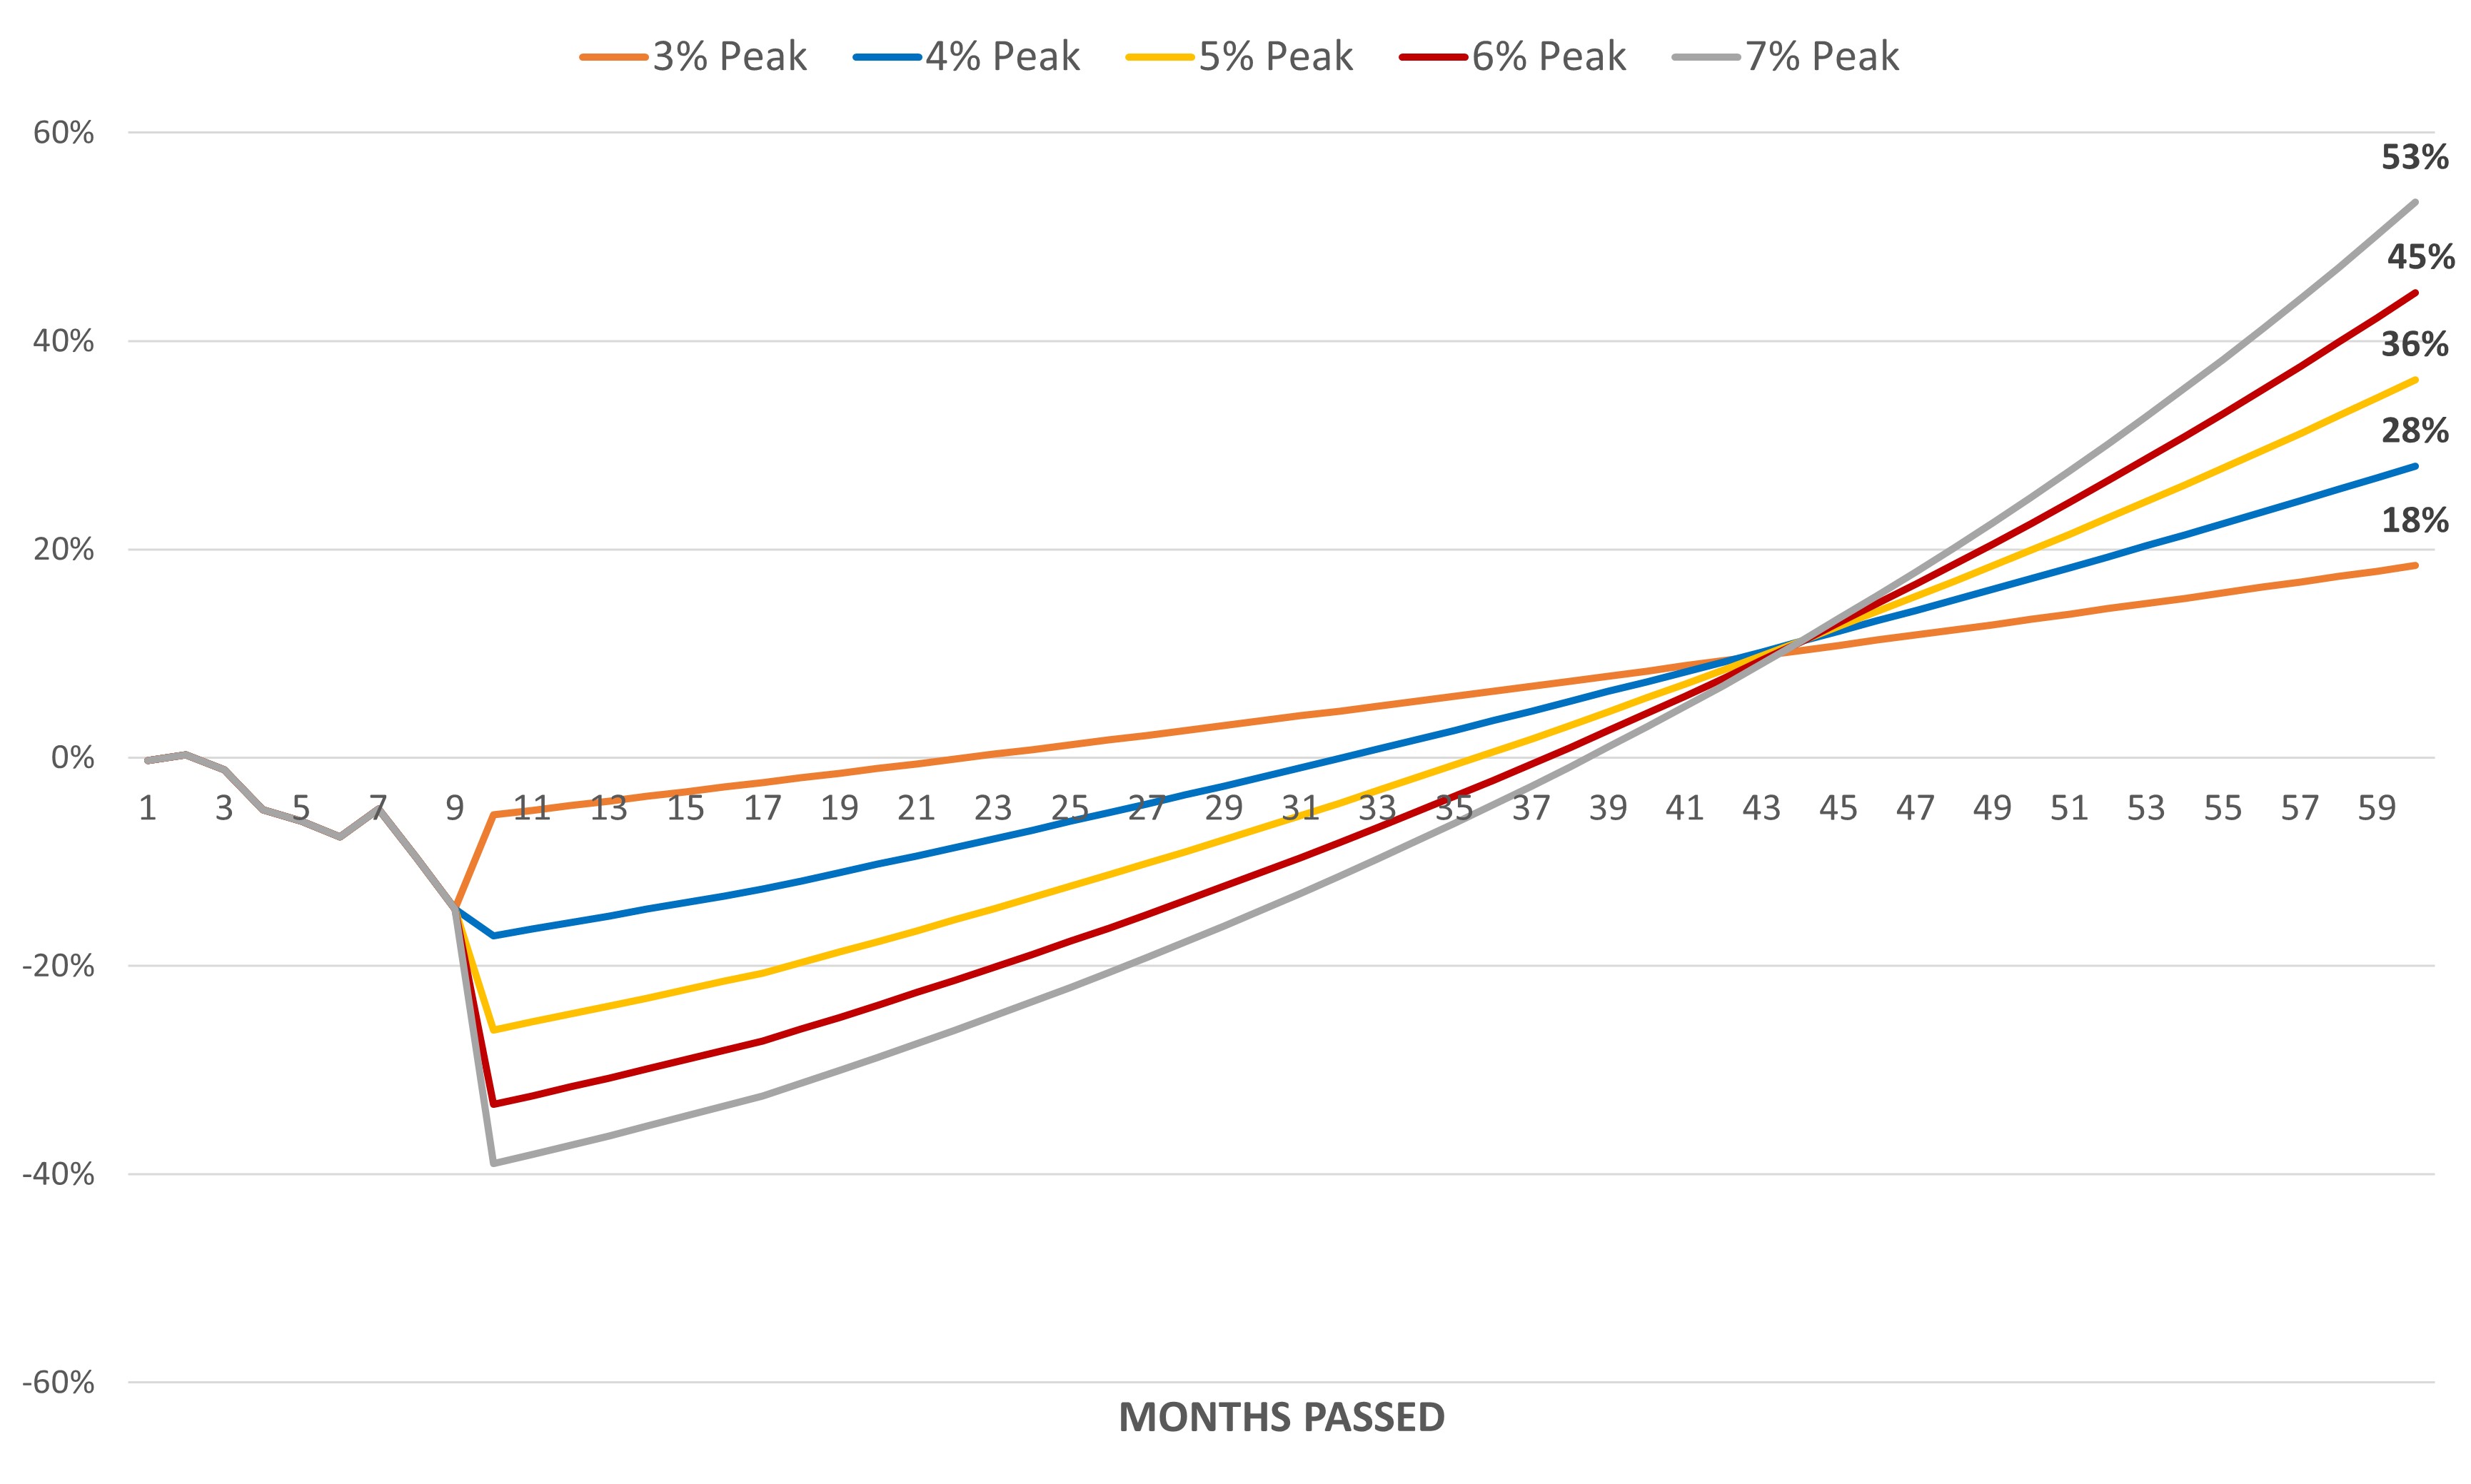
Earlier this year, the specific scenario that just unfolded in the Treasury market was modeled. The following is an updated graph that compares how bonds were expected to contribute to the Hedgewise portfolio across various interest rate peaks (assuming yields eventually settled at the long-term Fed projected neutral rate of 2.7%). Higher terminal yields resulted in higher expected terminal gains due to bigger interest payments (e.g., 5% vs 4%) and higher expected exposure levels (i.e., as yields go up, implied bond risk goes down, resulting in larger portfolio allocations). The bright green line shows how bonds have impacted the live RP Max portfolio along the way.

Interest Rate Model vs. Live Bond Performance in RP Max Portfolio, From October 2022

The Bond Impact on RP Max calculated using live recommended portfolio weights in client portfolios multiplied by an estimation of the benchmark return on 30yr nominal bonds. Includes an estimate for all coupons paid. Assumes 30yr bond yields fall to 2.7% over the remaining time in the five-year period, that bond volatility adds 1.5% annually to returns, and that bond exposure averages 100% after the interest rate peak.

Up until July, Hedgewise had been hugging tightly to the 4% peak line. This was notable for how well live performance was matching the simulation, helping to validate the underlying assumptions and build confidence that the final expected gains would eventually be achieved. Over the past two months, we have hopped down to the "5% Peak" yellow line. This effectively increases the expected terminal gain from 28% to 36%, but the reality is nuanced. We can only secure that extra return if rates stay this high and continue to bounce around; that potential will disappear if rates quickly revert to the blue 4% Peak line. This explains why Hedgewise prefers bigger drawdowns that are sustained for longer in the bond market.

Of course, the key assumption is an eventual reversion of 30yr rates to 2.7%. If you know for certain rates will eventually fall to that level, it is easy to look through short-term volatility. When yields are skyrocketing like they have in the past three weeks, this may seem harder to believe. Though the case for 2.7% remains very strong, due to fundamental factors like the plateauing of the US population, the Fed's mission to keep inflation at 2%, and the self-limiting impact of restrictive rates, it is still worthwhile to play devil's advocate and imagine if rates do stay higher.

At the most extreme, let's imagine that 30yr rates rise all the way to 4.5% and never fall back down. Given that rates ended the month at 4.3%, that would imply a total additional loss of about 4%, all of which would be recovered via coupon payments in under a year. Given that, it is hard to argue that bonds are a bad investment even in this worst-case scenario. There is only additional downside if rates rise quickly and permanently above current levels (since coupon payments will continue to offset any losses over time).

The Big Picture on Bonds

With this logic in mind, the basic theme for 2023 is that bonds with 4% yields look like a great investment, and Hedgewise is much more interested in capturing future potential upside than avoiding additional downside. As yields go higher, Hedgewise simply increases its exposure further. The wrinkle is that it can feel like bad timing in the short-term despite adding to your net expected gains in the long-term.

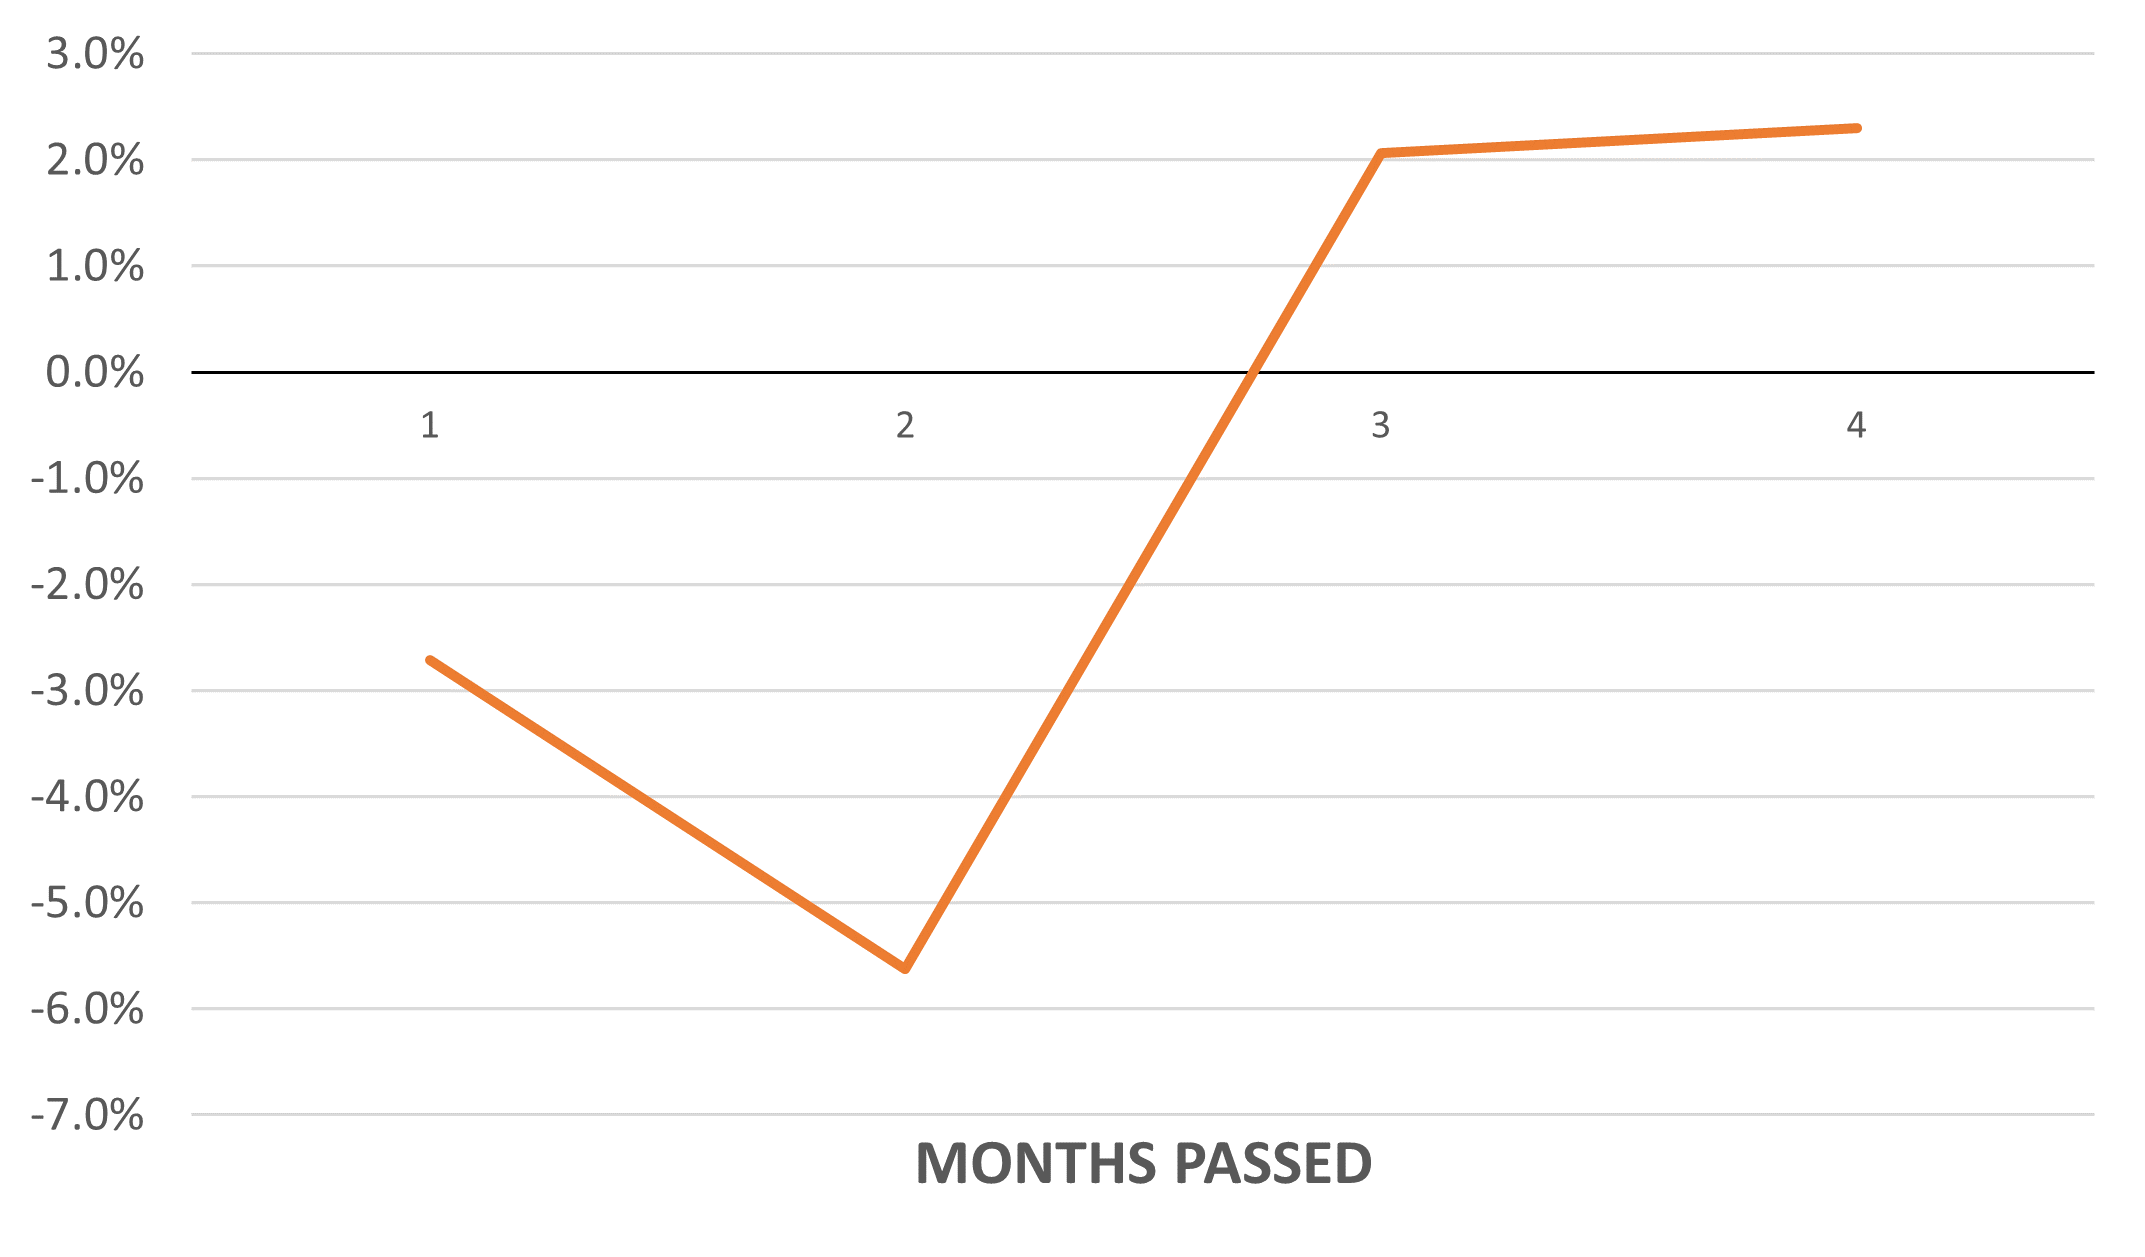
This is a mathematical illusion in a sense. Consider the following hypothetical investment scenario that tracks bond yields and portfolio allocations over four months.

Bond YieldPortfolio Allocation
Month 14.00%70%
Month 24.25%80%
Month 34.50%90%
Month 44.00%70%

At the end of four months, you get a total net gain of 2% even though yields start and end in the same place. But at the end of month 2, you have more than a 5% loss because you increased exposure as rates were rising.

Net Performance Impact of Bonds in This Scenario

Source: Hedgewise Analysis

This exhibits how spiking yields are positive for the portfolio but will feel negative if you freeze frame in the middle. It is crucial to keep this perspective and avoid overreacting to short-term drawdowns, especially if that is happening in the bond market when yields are elevated. This is not a case of bad timing or poor risk management, but rather the opposite.

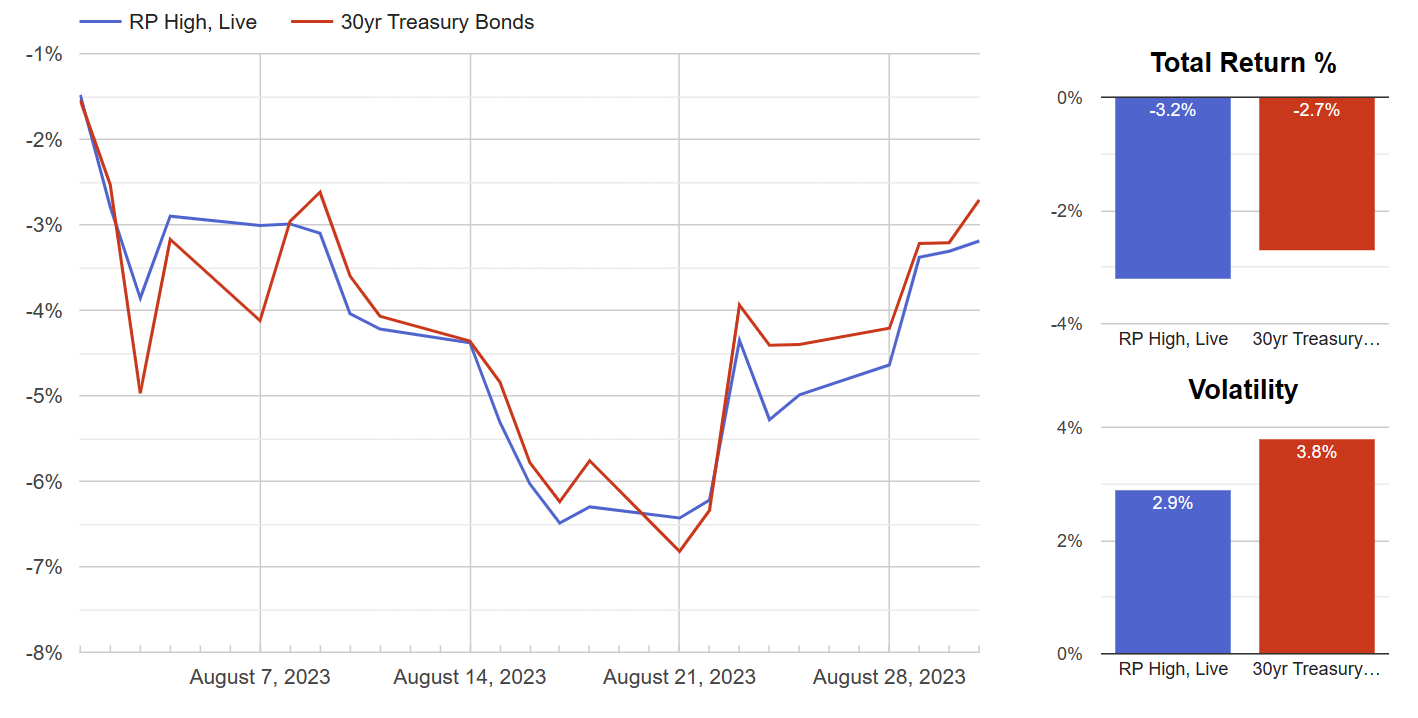
Not coincidentally, the live Hedgewise portfolio was positioned similarly to this scenario at the beginning of August, and bond yields were close to 4%. A quick look at this month's performance confirms that bonds have been the primary driver and supports the applicability of this example.

RP Max vs. 30yr Bonds, August 2023

Source: FRED, Hedgewise Analysis. "RP High, Live" portfolio based on composite performance across all live clients at the RP High risk level, including all costs and fees. Includes an estimate for all fees, dividends, and coupons paid.

In this new light, it should be easier to understand why such a bond-driven drawdown is not a concern for Hedgewise; in fact, it is viewed opportunistically. It would have been preferred if rates stayed as high as they were around August 20, since that would provide the opportunity to add additional exposure. Regardless, it is very human to experience significant stress and doubt at that moment, and to root for an immediate recovery, even though that would reduce expected longer-term gain.

This can be a very dangerous situation for investors, as it is precisely the wrong time to consider selling even if rates plateau or move higher. The only exception would be if rates were going to permanently settle at a higher level and never again fall below where they are today. If either of those conditions fail, Hedgewise will inevitably capitalize on this volatility, and it is just a matter of when.

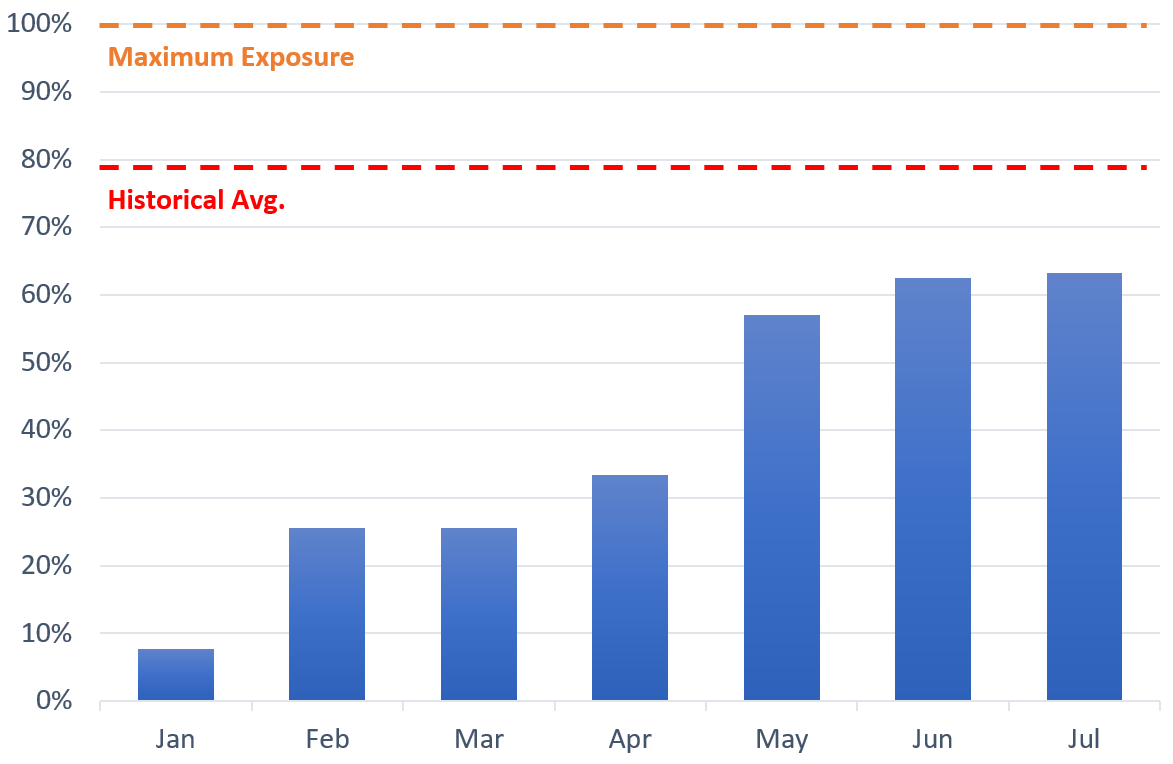
In addition, from a common sense perspective, it is helpful to understand relative positioning in the live portfolio. In August, bond exposures were very close to the historical average. From a risk perspective, this means the model was assigning around a 50% chance that rates had peaked, which is no more than a coin flip. This leaves plenty of room to add exposure if yields continue to rise, and it also helps to highlight that this is not an aggressive stance.

It can be challenging to shift the mindset for bonds in this way because the implications are counterintuitive. Larger short-term losses beget larger long-term gains which would not be possible without the interim drawdown. The expected opportunity will grow as the drawdown increases. Yields need to stay elevated for months to allow this process to successfully play out. Short-term performance is not meaningful because all that matters is the terminal interest rate. Any time spent above that level is opportunity in waiting, and Hedgewise will be systematically taking advantage of it.

In short, you would need a projection of 5%+ interest rates that last indefinitely and without interruption to justify worrying about this bond volatility. This would imply some combination of a permanently restrictive rate, failure of the Fed to achieve 2% inflation, and successful avoidance of any future recession in the US that would cause the Fed to make substantial cuts.

Evaluating Performance and Wrapping Up

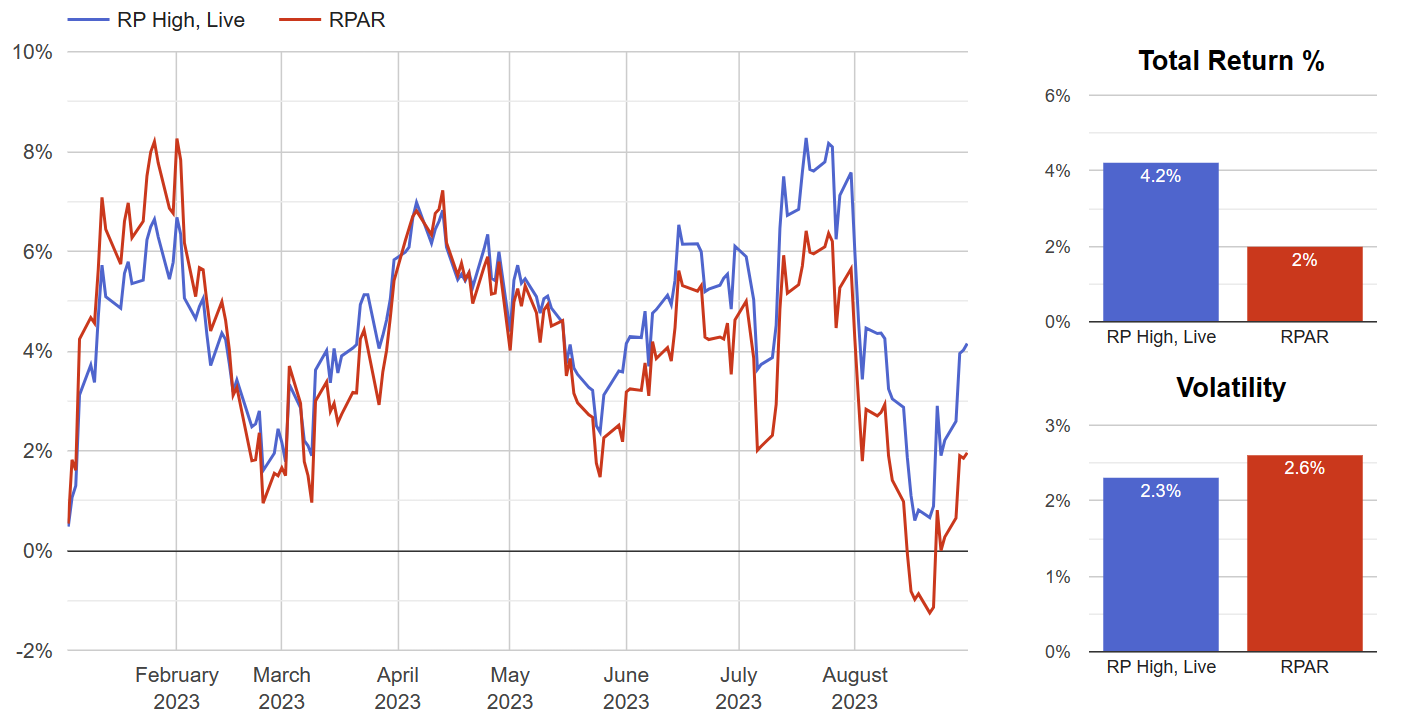
Another tricky element of this framework is that its success does not show up in short-term performance. Rather, it builds over time as Hedgewise takes advantage of volatility. This year has presented a great testing ground for that, as rates have bounced around significantly since January. One way to measure the framework's success is by comparing how Hedgewise has done vs. a passive Risk Parity framework like the RPAR ETF, which holds a more static bond allocation and thus does not benefit from higher short-term rates.

Hedgewise vs. RPAR, January 2023 to Present

Source: Nasdaq Data Services, Hedgewise Analysis. "RP High, Live" portfolio based on composite performance across all live clients at the RP High risk level, including all costs and fees. RPAR data includes an estimate for all fees, dividends, and coupons paid. The "High" risk level has the closest target volatility to RPAR among the various Hedgewise risk levels.

Hedgewise has achieved outperformance of over 2% in a relatively short timeframe, and a large piece of that can be attributed to the bond framework just discussed. This differential is much more important than any of the short-term swings, which have been driven largely by interest rates and belie the persistent longer-term recovery potential. Speaking of that, nothing that has happened this year threatens the expected ~40% recovery discussed in the last article. That was based on an eventual return to asset price levels as of January 2022, which included yields returning to the estimated neutral level of 2.7%. Bonds now have an opportunity to increase this total potential because of the rise in rates this month - provided they can stay high for long enough!

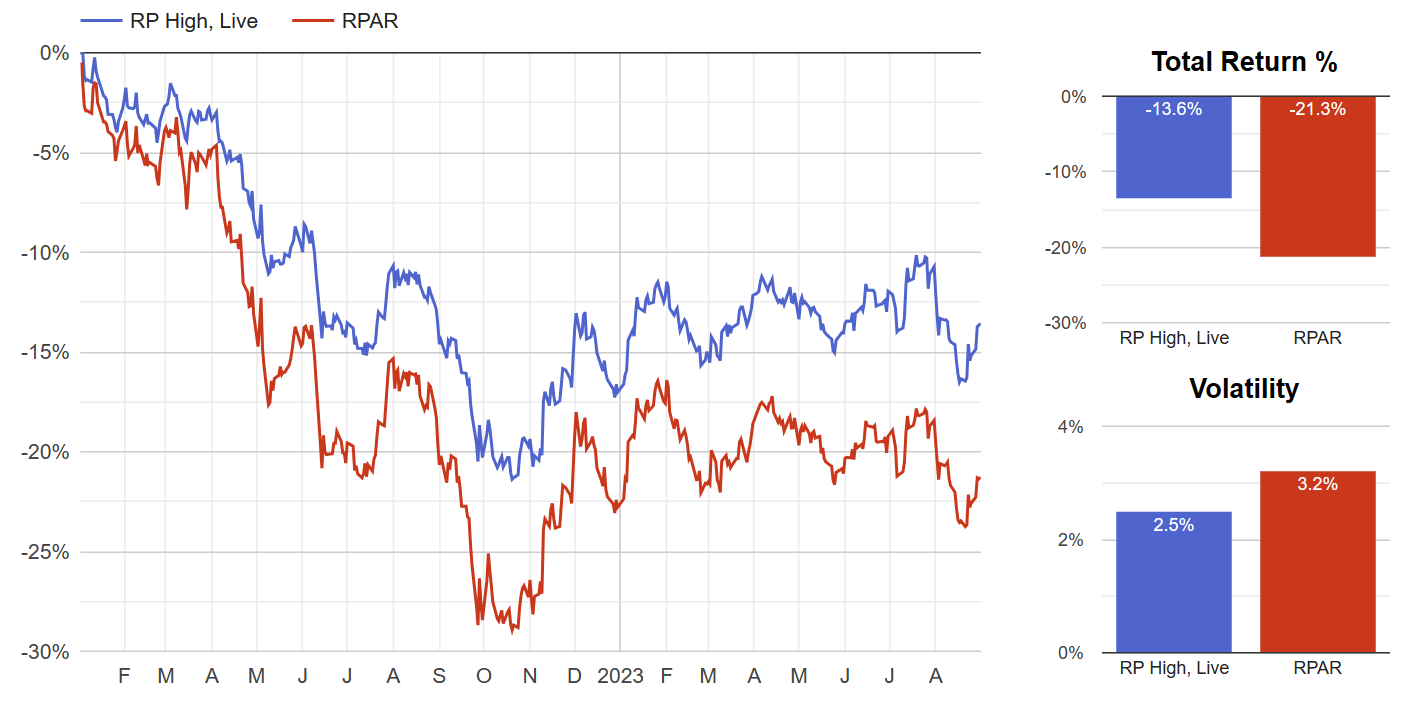
This article has focused deeply on bonds because that asset class has been the driver of most of this year's volatility. However, an equally important theme happening behind the scenes is the normalization of exposure across all assets, including equities and commodities. In 2022, Hedgewise was successful in minimizing its drawdown because it was broadly underweight exposure. This could only translate to net new gain if it returned to neutral or overweight prior to each asset's recovery, which has already largely happened. As a result, last year's relative outperformance has persisted into 2023.

Hedgewise vs. RPAR, January 2022 to Present

Same as prior illustration.

So long as you can step back from the short-term swings, everything has gone almost exactly as it should in terms of risk management. After a year like 2022, when so many assets have gotten cheaper at once, the preponderance of risk shifts to the ability to participate in any recovery. Considering that alongside the design of the bond framework discussed earlier, this volatility in August is neither a surprise nor a problem. The biggest challenge is remembering that even when yields are jumping and the collective investment community is panicking about the future of fixed income.

Looking forward, the themes have not really changed since the start of the year. Hedgewise continues to prefer a choppier, slower recovery. While asset exposures have all returned near average, there is still opportunity to increase weights further as risk settles or additional drawdowns occur. The possibility of a "higher-for-longer" Fed fits right into this narrative. It should help to more fully stabilize inflation, wring out remaining excesses of fiscal spending and post-pandemic bubbles, and encourage additional market volatility. All in all, Hedgewise had a pretty good August and maintains an excellent medium-term outlook. It just isn't something measured in month-to-month performance.

Disclosure

This information does not constitute investment advice or an offer to invest or to provide management services and is subject to correction, completion and amendment without notice. Hedgewise makes no warranties and is not responsible for your use of this information or for any errors or inaccuracies resulting from your use. Hedgewise may recommend some of the investments mentioned in this article for use in its clients' portfolios. Past performance is no indicator or guarantee of future results. Investing involves risk, including the risk of loss. All performance data shown prior to the inception of each Hedgewise framework (Risk Parity in October 2014, Momentum in November 2016) is based on a hypothetical model and there is no guarantee that such performance could have been achieved in a live portfolio, which would have been affected by material factors including market liquidity, bid-ask spreads, intraday price fluctuations, instrument availability, and interest rates. Model performance data is based on publicly available index or asset price information and all dividend or coupon payments are included and assumed to be reinvested monthly. Hedgewise products have substantially different levels of volatility and exposure to separate risk factors, such as commodity prices and the use of leverage via derivatives, compared to traditional benchmarks like the S&P 500. Any comparisons to benchmarks are provided as a generic baseline for a long-term investment portfolio and do not suggest that Hedgewise products will exhibit similar characteristics. When live client data is shown, it includes all fees, commissions, and other expenses incurred during management. Only performance figures from the earliest live client accounts available or from a composite average of all client accounts are used. Other accounts managed by Hedgewise will have performed slightly differently than the numbers shown for a variety of reasons, though all accounts are managed according to the same underlying strategy model. Hedgewise relies on sophisticated algorithms which present technological risk, including data availability, system uptime and speed, coding errors, and reliance on third party vendors.

March 2023: Mapping a 40% Recovery
Posted in Market Commentary on 2023-03-09

Summary

  • In terms of loss avoidance, 2022 was one of the best years ever for Hedgewise. Moving into 2023, the focus is how to optimally translate that success into gains.
  • From the October bottom, a 40% recovery is a relatively moderate expectation over the medium term (at the "Max" risk level). Clients have already recovered 7% as of March 1, and had gained as much as 13% at an earlier point in February.
  • Ironically, such fast gains are not the preferred path, and the drawdown last month was welcome. From a risk management perspective, a slower and choppier recovery is more likely to amplify the available upside.
  • We'll dive into the logic behind this and look in detail at how the various risk management mechanisms have been functioning thus far in 2023.

Overview: A Good Spot or a Better One

From a big picture view, Hedgewise is in an excellent position for 2023, and there is less of a question of 'if' there will be a recovery, and more of a question of how big it will be. This is true despite tumultuous macroeconomic conditions and multiple errors by the Fed that have increased the risk of stagflation and dislocated the 'real world' economy (e.g., a frozen housing market, excessively tight labor markets, continued supply chain snarls) True to form from a hedging perspective, Hedgewise stands to benefit from increased turmoil (and short-term losses!), though it will also do just fine if it all resolves calmly.

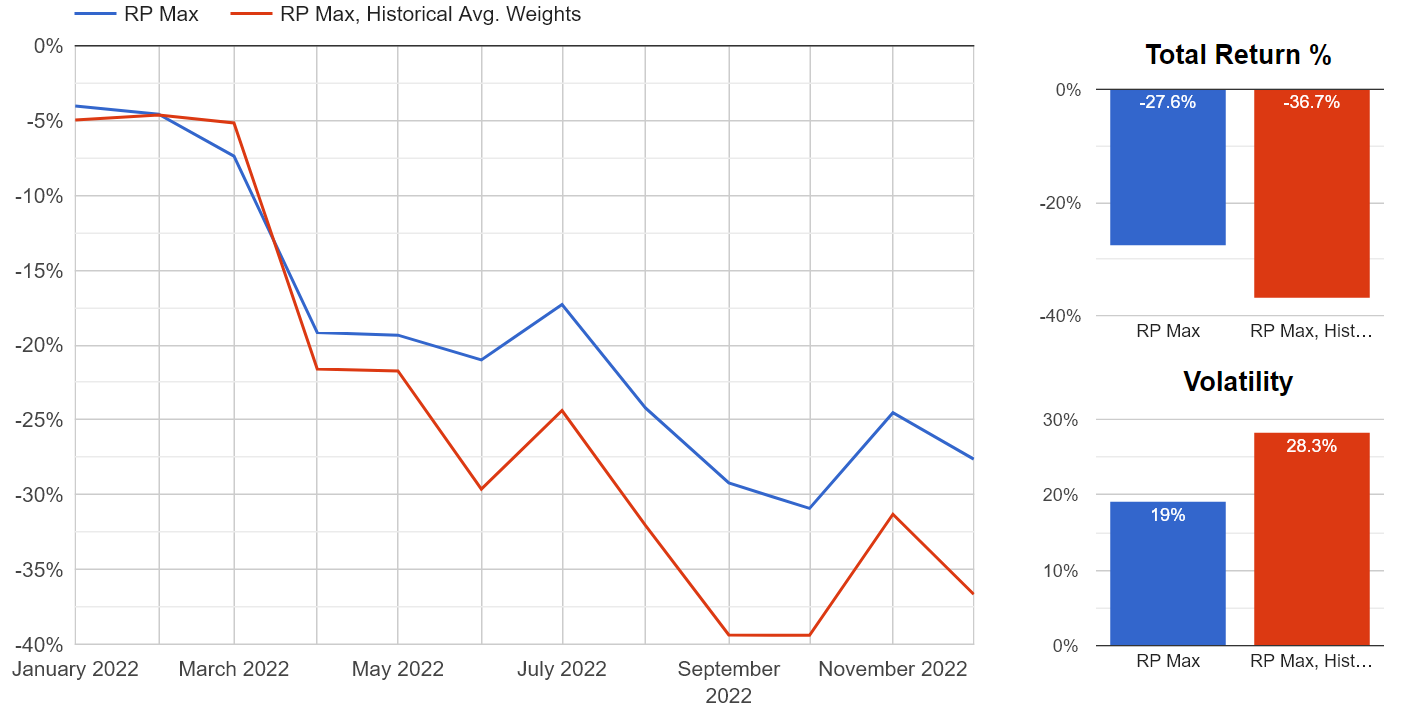
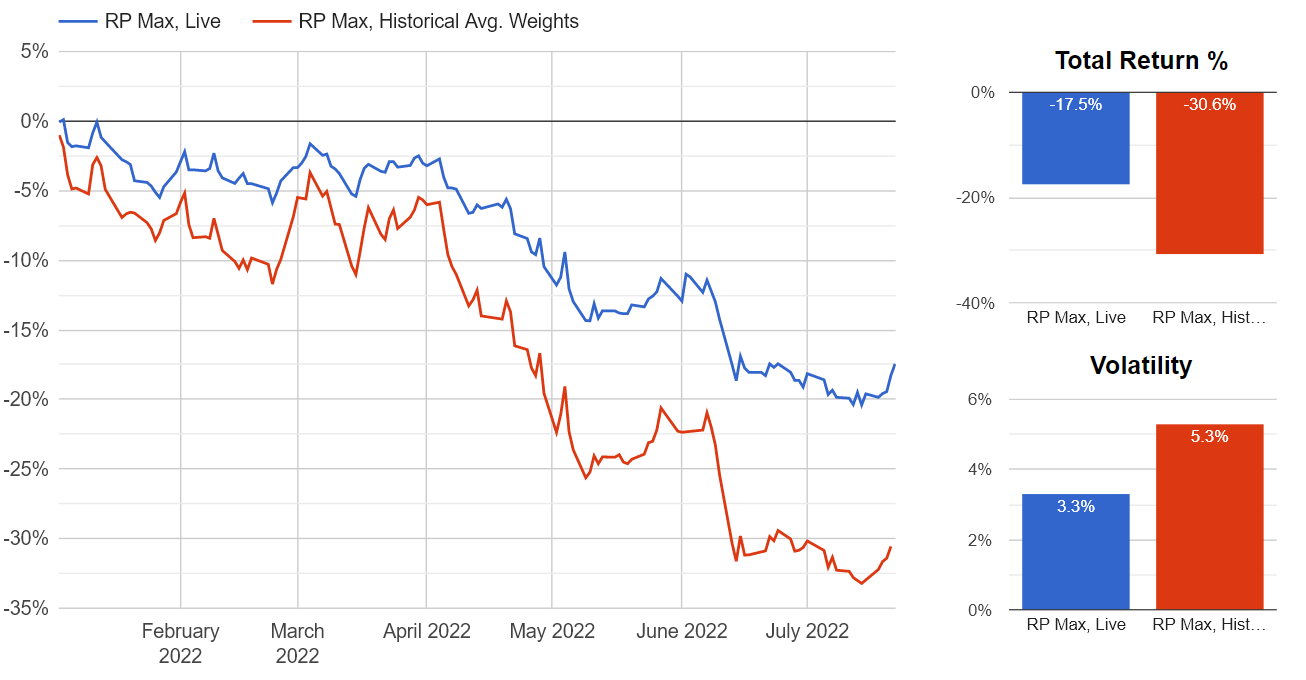
The reason for this is because of the relative success of last year. As highlighted in the last newsletter, Hedgewise was at or near minimum exposures in most asset classes throughout the drawdown of 2022. This significantly limited losses, which can be seen by comparing live client performance to a portfolio in which each asset class is fixed at its historical average weight (labeled "RP Max, Historical Avg. Weights below).

Hedgewise vs. Historical Average Risk Parity Portfolio in 2022

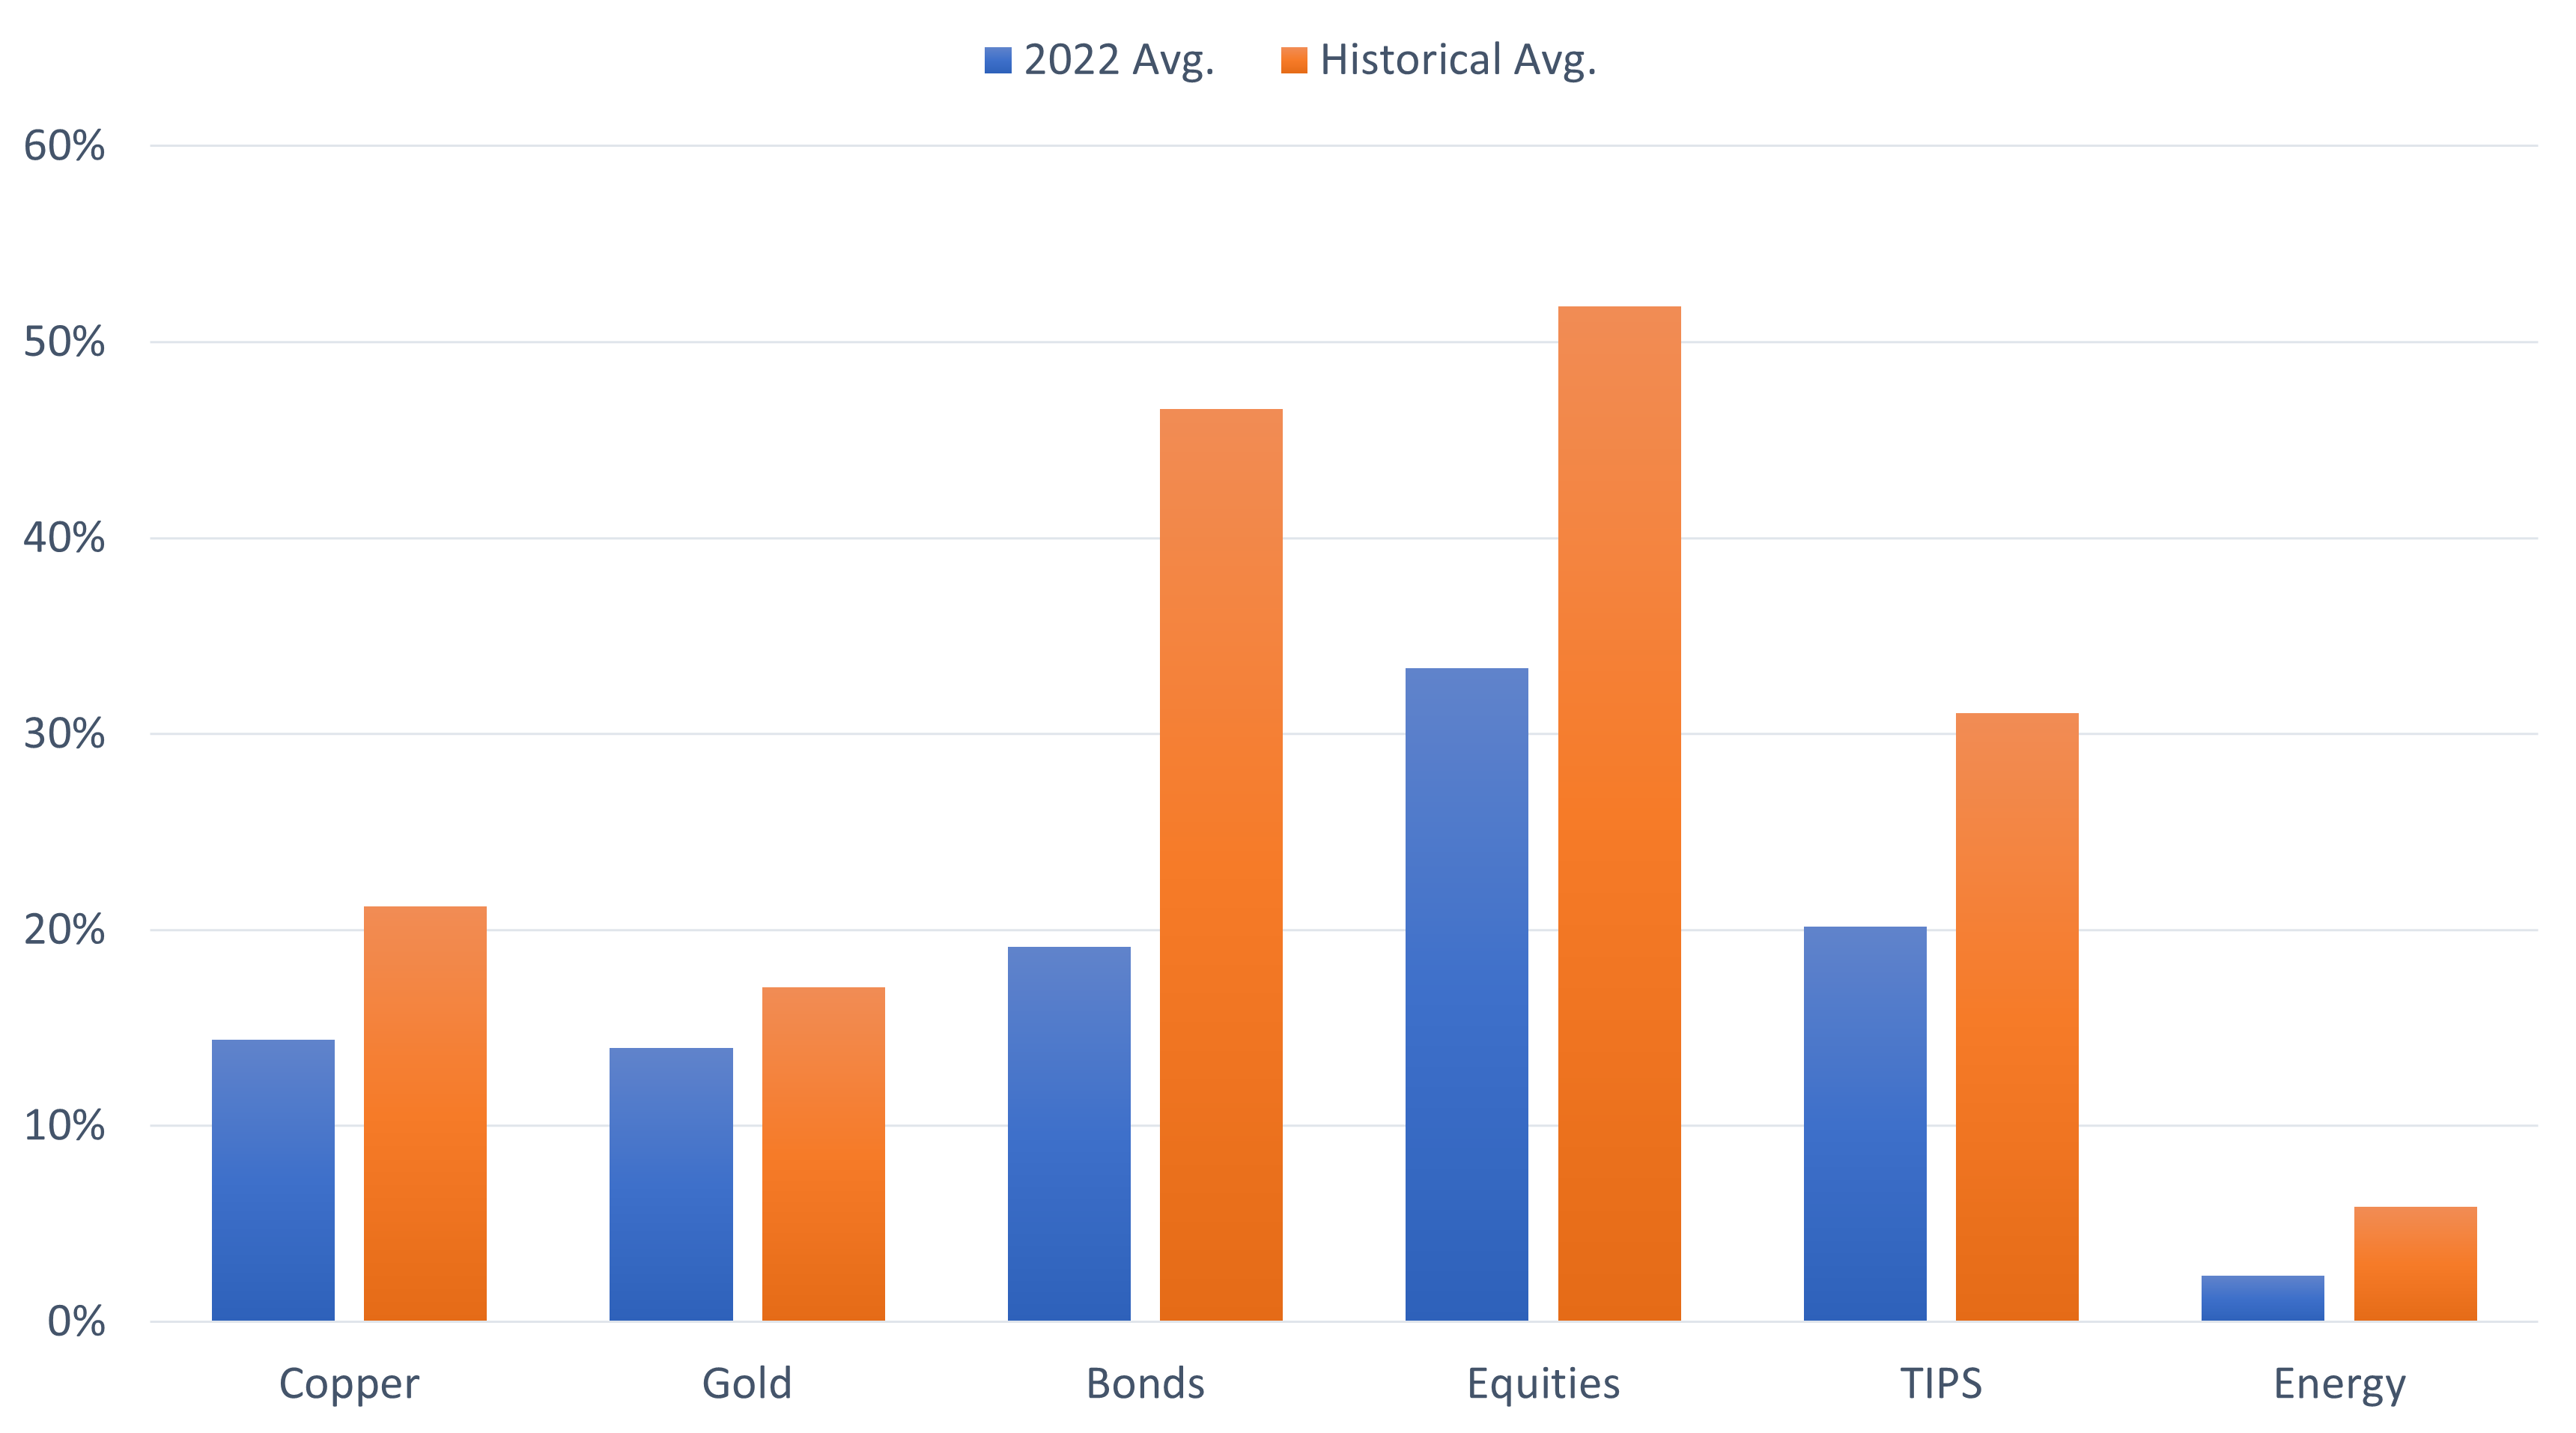
Source: Sharadar, Bloomberg, Hedgewise Analysis. "RP Max, Live" portfolio based on composite performance across all live clients at the RP Max risk level, including all costs and fees. Data includes an estimate for all fees, dividends, and coupons paid. Historical average weights based on a risk model identical to the one being used in live portfolios and an assessment of monthly asset risk from 1977 through 2021, where available. The weights of this portfolio are fixed at the following levels: Copper 21%, Gold 17%, 30yr Treasuries 47%, Equities 52%, 30yr TIPS 31%, Energy 6%.

The larger the gap between the blue and red line, the greater the opportunity for net new gains over the long run. At any point during the drawdown, the portfolio could be set back to its historical average weights and be guaranteed to pocket the difference as the recovery unfolds. The tricky part is exactly when to do that, and with which asset classes (since additional losses could also accrue).

That said, let's oversimplify. Imagine you could have magically identified October as the bottom in real-time, and you shifted all exposures back to their historical averages at that precise moment. Let's also fast forward to some point in the future when stocks and commodities have recovered to the prices of January 2022 and bond yields have returned to neutral (which the Fed estimates at 2.7%). At that point, this hypothetical portfolio would gain about 40% from the bottom.

Now switch to a worst-case scenario where you remain stuck at the weights immediately prior to October with no opportunity to re-weight. That portfolio would still gain 30% upon the same point of recovery because bond exposure had already normalized before October, locking in much of the potential benefit.

This is why a 30-40% gain represents a conservative expectation over the medium term. Risk assets will almost certainly return to their January 2022 levels within the next few years, though it could also happen within six months. Either way, there will be a significant gain, it is just a matter of how much.

With such a strong outlook, it is ironic yet understandable that many clients remain hesitant to deploy their cash. Worry remains that the worst is yet to come, and Treasury bills yield a hefty 5%. Yet it is vital to differentiate the Hedgewise portfolio from equities in isolation and other passive benchmarks. Hedgewise utilizes risk management techniques that benefit from a choppier recovery and additional drawdowns, the impact of which can already be measured in live performance. "Bad" outcomes like stagflation or a severe recession would only add to net expected returns.

Fortunately, there is now enough data over the past year to examine and better understand this in real-time.

Evaluating the Recovery Since October

Let's return to the baseline assumption that all asset prices bottomed last October. At that point, Hedgewise had succeeded in limiting its drawdown because exposures were lower than average throughout 2022. To most effectively translate this into net new gains, Hedgewise has two available paths. The most obvious is to increase asset weights prior to a recovery. The second is to take advantage of market volatility through monthly exposure adjustments (i.e., selling a little as prices go up, and buying a little as prices go back down).

For both options, a slower and choppier recovery is preferred. This is simple probability: the longer that prices remain low, the higher the chance that asset weights will normalize (and that risk levels will return to average). Similarly, there is no chance of benefitting from market volatility if prices only go in one direction.

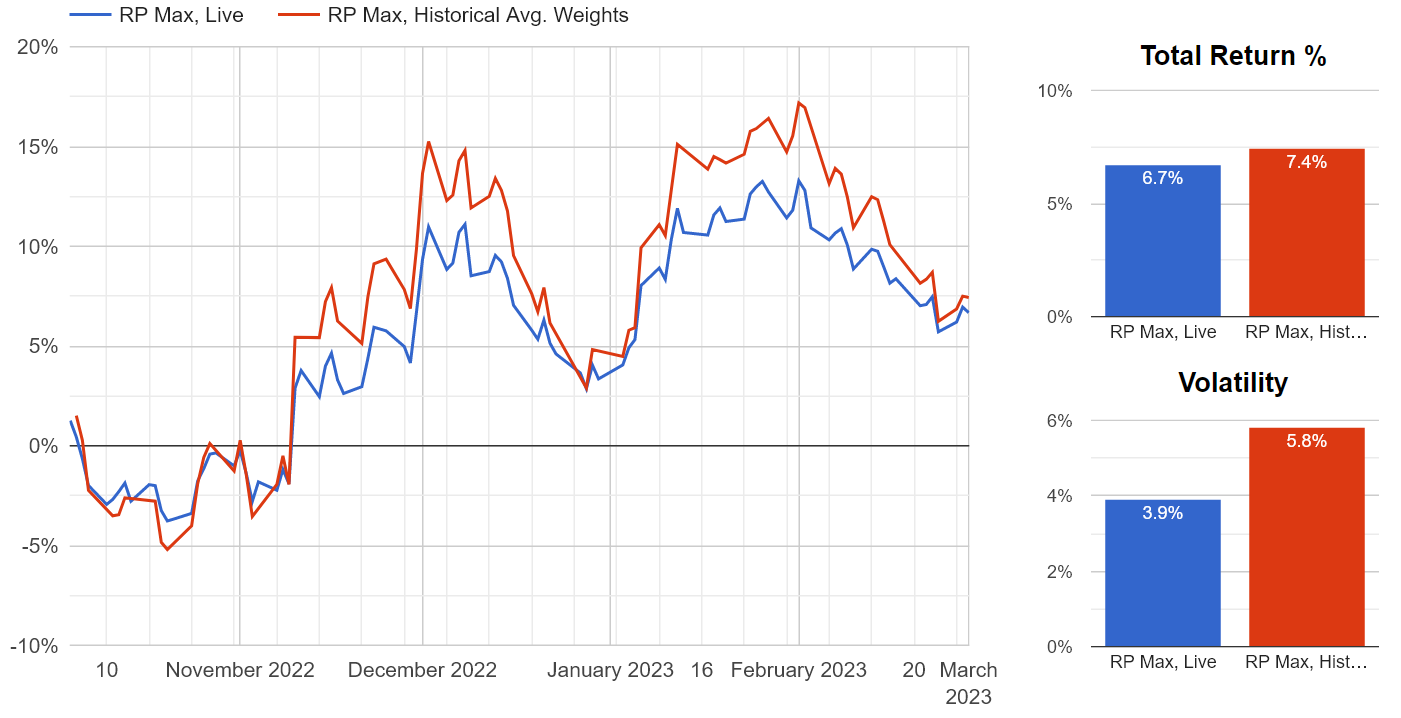
The 'historical average' Risk Parity portfolio from earlier is useful to track as a benchmark. While it is not realistic to achieve its performance from the onset of a recovery, since that assumes foreknowledge of the precise bottom, it helps to evaluate how much 'potential' gain Hedgewise has successfully captured. The closer the blue line is to the red line, the more ideal the recovery, and vice versa.

Hedgewise vs. Historical Average Risk Parity Portfolio, October 2022 to March 2023

See disclosures on prior graph.

As of March 1, the Hedgewise recovery has been close to perfect. However, it was much 'worse' at the peaks in December and February, during which Hedgewise had foregone approximately 4% of potential gain. Likewise, the 6.7% gain at the beginning of March is much 'better' than the same gain near the beginning of December. The precise reason varies over time and isn't particularly important; the main takeaway is that gains may be bad and losses may be good in the context of total opportunity.

This is not a matter of market timing, but rather systematic probability. As prices fall, Hedgewise is more likely to add exposure. Risk management techniques take further advantage of the volatility. This dynamic would remain true even if prices fell back to the October bottom or below.

The intuition behind this can be challenging, but it can be more easily understood in the bond market, in which risk is the most obvious to measure and manage.

Live Proof in the Bond Market

Risk in US Treasuries is more definitional than other asset classes because interest rates can only go so high or so low, and you eventually get your money back either way so long as the government pays its bills. As a result, it is easy to categorize a Treasury bond paying 6% as less risky than one paying 2% (since you pay less for it upfront and get higher coupon payments to boot).

Hedgewise adjusts its risk estimates to account for interest rate changes month-to-month, and often shifts its bond weights 3-5% as a result. The more that rates bounce around, the more opportunity there is to benefit.

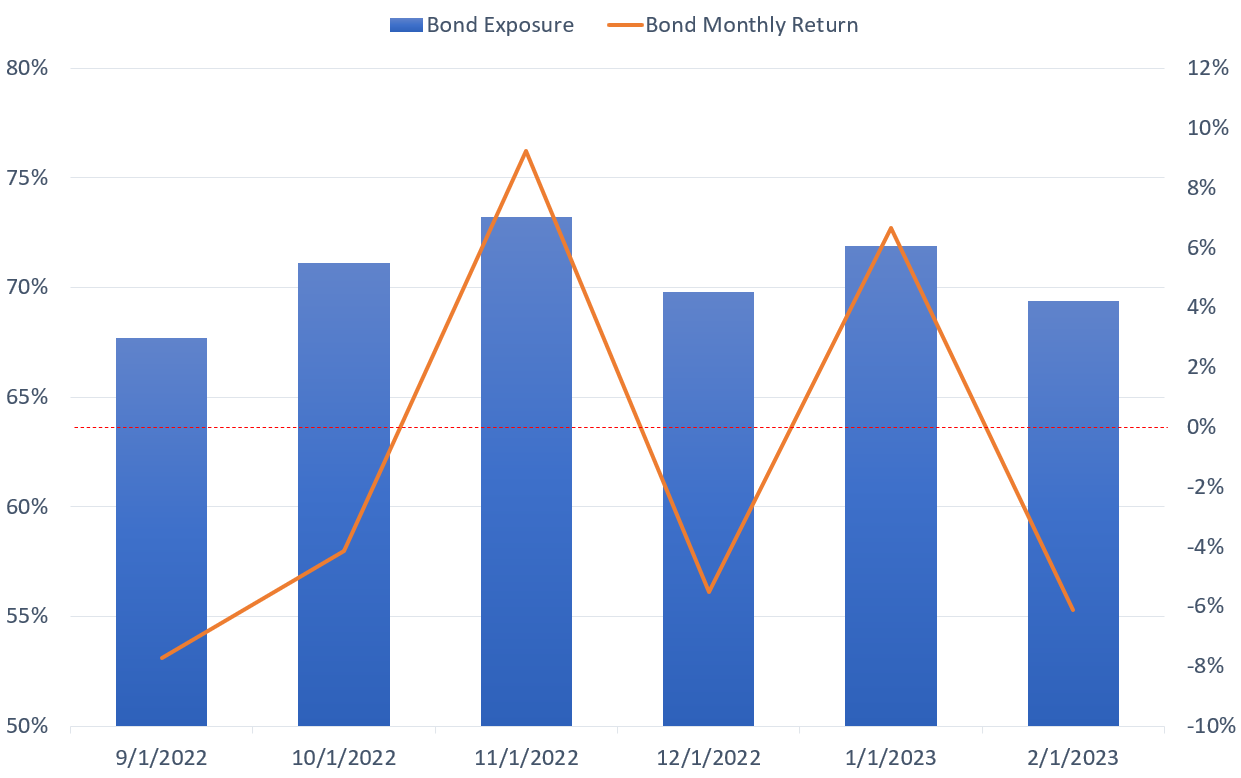
The following chart shows how recommended bond exposure for the RP Max portfolio has shifted each month since last September alongside realized monthly bond returns. The dotted red line is added for emphasis on the divide between a positive or negative monthly return.

Hedgewise Recommended Bond Exposure vs. Monthly Return, RP Max, September 2022 to Present

Source: Federal Reserve, Hedgewise Analysis. Bond returns calculated as an average monthly return of 30yr US TIPS and 30yr US Treasuries. Bond Exposure is the total recommended sum exposure for US TIPS and US Treasuries for the RP Max portfolio. Data includes an estimate for all dividends and coupons paid.

Between September and February, 30yr bond yields were little changed overall: they moved from approximately 3.4% to 3.5%. However, significant volatility in the interim provided an opportunity to slightly reduce exposure as prices went up and vice versa. The net result from exposure changes over this six-month period was a net gain of 0.7%. This amount is independent and permanent, in that it depends only on volatility and has already been fully realized.

While this is straightforward, it can be easy to lose track of day-to-day. For example, between last September and November, bonds suffered a loss of 9% before subsequently recovering, which contributed to a drawdown in the Hedgewise portfolio at the time. Yet this was necessary to unlock an extra 0.7% gain that would not have been available if rates had remained steady.

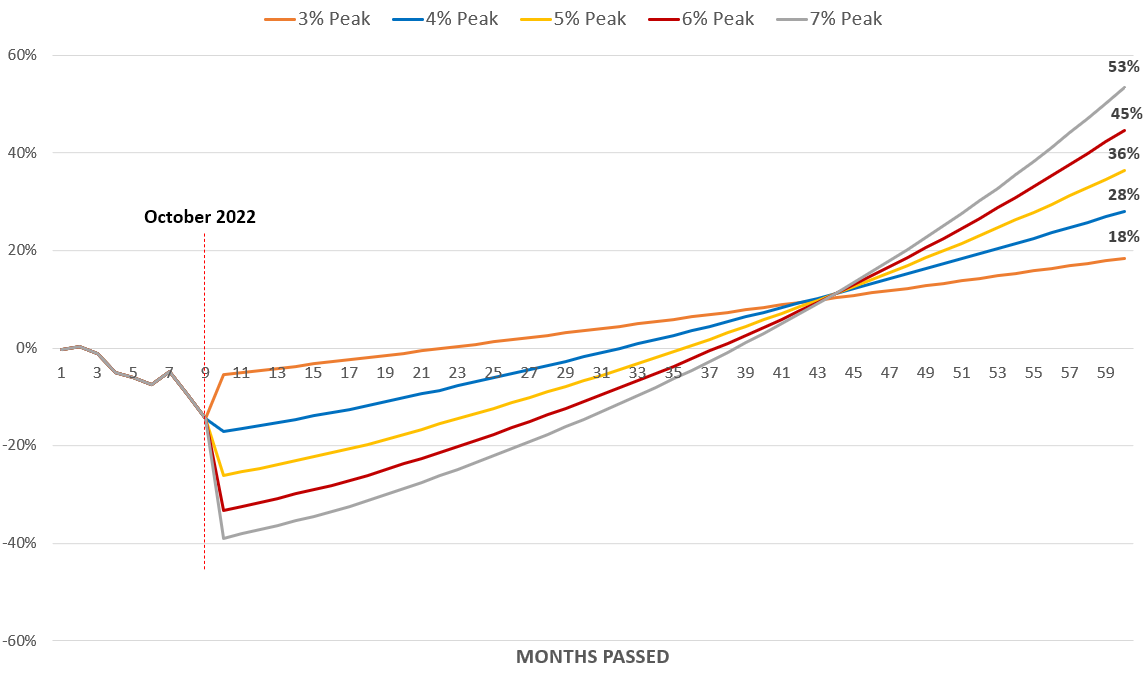
To expand on this idea, it is worth revisiting a model shared in the last newsletter. The following was a simulation for how bonds would be expected to impact the RP Max portfolio over a five-year timeframe. The first part of the chart uses live performance data from last January to October, and then splits into different assumptions for where interest rates will finally peak (the 3% peak assumed that rates fell quickly from their level in October to 3%). At the end of five years, it is assumed that rates had returned to neutral at 2.7%.

Comparing Expected Bond Performance Across Various Interest Rate Peaks From October 2022

The Bond Impact on RP Max calculated using live recommended portfolio weights in client portfolios multiplied by the average monthly return on 30yr nominal and inflation-protected bonds from periods 1-9. Includes an estimate for all coupons paid. Assumes 30yr bond yields fall to 2.7% over the remaining time in the five-year period, that bond volatility adds 1.5% annually to returns, and that bond exposure averages 100% after the interest rate peak.

This graph represented an 'ideal recovery' as it assumed a high level of bond volatility, and that bond exposure eventually surpassed its historical average after rates peaked. Let's check in on how this has gone with live performance data since October (represented by the green line below).

Interest Rate Model vs. Live Bond Performance in RP Max Portfolio

See prior disclosures. Live Performance line constructed using recommended weights in the RP Max portfolio multiplied by the average monthly return of Long-term TIPS and Treasury bonds.

Rates peaked at about 4.14% in November, and live performance has hewn extremely close to the ideal recovery at a 4% peak. This was enabled by a combination of the volatility benefits discussed earlier and increased bond exposure as rates rose. Nothing surprising, but seeing the live data align so closely with the theoretical concepts helps to build confidence in the model and to unpack some of its counterintuitive elements.

For example, the top orange line represents the fastest potential recovery and worst long-term outcome. Though Hedgewise realized quick gains in November and January, it was better to give them back and return closer to the blue line. What if rates keep going up to 5%? Great, we shift down the graph to the yellow line. What if rates stay higher for longer? Also great, higher coupon payments boost your total returns by the end.

The concepts are simple, but the outcomes are very different than traditional passive approaches. The worst case is a moderate return amidst a fast recovery. It only gets better with higher rates and bigger near-term losses. True to a proper hedge, it doesn’t really matter what happens - all the results are positive to different degrees.

The single core assumption is that rates eventually fall to neutral. The prior figures use a five-year timeframe, but the logic holds for any other length. The exception would be if rates never fall and remain at 4% or above. This would require the Fed to remain permanently restrictive, to fail in meeting its 2% inflation target, or some combination of the two. The economic scenarios get a little weird in trying to imagine this, but the most plausible would be a kind of forever stagflation where inflation sticks at 4%+, and no amount of rate hikes can ever bring it down. The Fed kind of keeps trying by keeping rates higher than 4%, but kind of gives up by not doing anything more radical, and that is the new status quo.

While this is an edge case, we can still model how Hedgewise would be affected just for fun. Over five years, the bond impact on the RP Max portfolio would be expected to remain breakeven all the way up to a terminal 5.5% interest rate. In other words, the effect of the rate increases would likely be offset by a mixture of coupon payments and volatility management until they exceeded 5.5%. This represents a useful strawman for what you'd need to believe to be worried about how Hedgewise will fare with its bond exposure over the next few years. The rate on 30yr Treasuries would need to settle north of 5.5%, then never fall below that point again.

These bond concepts are so useful because they are mathematic, specific to real-world scenarios, and already in motion. It builds confidence to know precisely how these risk management techniques are operating and why they will be effective across such a broad range of outcomes. It is not a matter of believing in Hedgewise or Risk Parity more broadly, but of understanding what makes this specific framework successful, how the benefits have manifested over the past year, and why that is expected to continue.

Wrapping Up: Scenario Planning

Let's return to the earlier base case recovery scenario where stocks and commodities return to their January 2022 levels, and interest rates fall back to 2.7%. This is how the 30-40% gain was estimated from the October bottom, but it assumed a one-year timeline and a smooth recovery across all assets. The prior analysis uncovers why that is among the least preferred outcomes. For example, that kind of bond recovery would be consistent with the top orange line from the interest rate model which had the lowest total expected return. We'll call this the 'soft landing', and then consider other rockier scenarios to see how they compare.

The first might be a 'hard landing': a severe recession akin to the Volcker shock of the early 1980s. The Fed would push rates higher and announce its intention to cause a recession. Assume a 5% bond peak, a retracement in the S&P 500, and that inflation eventually gets under control. Even if stocks fell back to their October bottom and never rose from there, a 30% gain would still be expected in the RP Max portfolio (the increase in bond performance at the 5% peak offsets the lack of recovery in equities). If the S&P 500 eventually returned to its January 2022 level, expected gains would rise to 50-65%.

Next let's consider 'prolonged stagflation': more like the mid-70s, when inflation stayed high, rates stayed elevated, equities did horribly, but commodities at least retained their real value. Assume rates rise to 5% and stay there, equities retrace to the October bottom, but commodities keep track with inflation. Initially, this would be painful. The RP Max recovery would be expected in the 10-15% range so long as inflation remained stuck (coupon payments, vol management, and commodity gains would offset the higher rates, but not by much). Then a binary assumption is required about what happens next. Either the Fed finally does its job, or the world accepts high inflation forever.

If the Fed eventually succeeds, it’s the same Volcker shock with a higher terminal rate, say 6-7% instead of 5%. Inflation is slain, but it takes 5+ years to happen. This would be an amazing outcome for Hedgewise, with expected total gains of 80-90% (these are the best scenarios from the prior interest rate graph), but it would take longer to happen and be scarier in the middle.

If the world accepts 4-5% inflation in perpetuity, inflation hedges would eventually do well (e.g., gold, TIPS, copper), but nominal bonds and equities would do poorly. The net outcome would still be expected in the 35-45% range for RP Max as the hedges kick in, but it would be very volatile as the world would be reckoning with a complete failure and re-orientation of the Fed. Assuming equities eventually recovered to their January 22 level, the expected range increases to 50-60%.

Finally, let's do one rosier economic outcome and call it 'radical expansion'. Some hidden source of real growth is unlocked (artificial intelligence or the like), and rates stay high alongside a humming real economy. Assume equities jump to 20% above their January 2022 level, and rates stick at 4% in perpetuity. Growth commodities like copper and energy do well, but gold does terribly. This generates a 25-40% expected return range for RP Max.

You may have noticed by now that the outcomes are clustered. The soft landing and radical expansion scenarios land in the 25-40% range. The hard landing and stagflation scenarios land in the 50-65% range despite a volatile expected interim period that includes additional short-term losses. The highest potential gain of 80-90% is reserved for a 1970s redux where the Fed fails to reign in inflation for another five years before initiating a shock recession. Across all the scenarios, the upper end of the range is more likely with a slower and choppier recovery, and vice versa.

The main takeaway is that every outcome is relatively good. After last year, the portfolio is already set-up for success. We don't know exactly how much of a gain it will be, or how long it will take, but it will not rely on any single asset class or economic reality. On net, if you are evaluating a specific short-term stretch, it is safer to assume that losses and volatility are beneficial. But it is not about trying to isolate the highest absolute gain, but rather maintaining confidence that the upside is there across many scenarios and only improves when markets seem scarier.

If I were to urge one single piece of advice, it would be to put your cash to work. The current pocket of opportunity is incredibly rare and hasn't really happened since the early 1980s. Back then, you could have gotten a 15% yield on a one-year Treasury bill, and that would have been the mistake of a lifetime compared to buying 30yr bonds (which tripled in value from 1982 to 1987). This is as similar as an environment as we are likely to see in at least a generation. It may be a slow and steady recovery that takes years, but it could just as easily happen in two months. With such a positive outlook whichever way it goes, it is very hard to justify any risk of missing out.

Disclosure

This information does not constitute investment advice or an offer to invest or to provide management services and is subject to correction, completion and amendment without notice. Hedgewise makes no warranties and is not responsible for your use of this information or for any errors or inaccuracies resulting from your use. Hedgewise may recommend some of the investments mentioned in this article for use in its clients' portfolios. Past performance is no indicator or guarantee of future results. Investing involves risk, including the risk of loss. All performance data shown prior to the inception of each Hedgewise framework (Risk Parity in October 2014, Momentum in November 2016) is based on a hypothetical model and there is no guarantee that such performance could have been achieved in a live portfolio, which would have been affected by material factors including market liquidity, bid-ask spreads, intraday price fluctuations, instrument availability, and interest rates. Model performance data is based on publicly available index or asset price information and all dividend or coupon payments are included and assumed to be reinvested monthly. Hedgewise products have substantially different levels of volatility and exposure to separate risk factors, such as commodity prices and the use of leverage via derivatives, compared to traditional benchmarks like the S&P 500. Any comparisons to benchmarks are provided as a generic baseline for a long-term investment portfolio and do not suggest that Hedgewise products will exhibit similar characteristics. When live client data is shown, it includes all fees, commissions, and other expenses incurred during management. Only performance figures from the earliest live client accounts available or from a composite average of all client accounts are used. Other accounts managed by Hedgewise will have performed slightly differently than the numbers shown for a variety of reasons, though all accounts are managed according to the same underlying strategy model. Hedgewise relies on sophisticated algorithms which present technological risk, including data availability, system uptime and speed, coding errors, and reliance on third party vendors.

October 2022: Good News in Surprising Places
Posted in Market Commentary on 2022-10-19

Summary

  • 2022 has been one of the worst years in the last century for financial markets, but it has provided a huge opportunity for Hedgewise to benefit from its risk management techniques.
  • Compared to passive Risk Parity benchmarks, Hedgewise has outperformed by 15% to 20% YTD (at the RP Max risk level), which is among its best years ever from a relative perspective.
  • It is difficult to appreciate this outcome so long as the current drawdown persists, but the medium-term outlook is already substantially better than it was in January, present losses included.

Introduction: Yes, This Has Been Crazy

What has happened to financial markets so far this year has been extreme. Not just once-in-a-decade event extreme, not just another financial crisis or pandemic extreme, but worst-in-measurable-history extreme. As Bloomberg noted a couple weeks ago, "Worldwide government bond markets are on course for the worst year since 1949, when Europe was rebuilding from the ruins of World War Two." If you've been feeling confused, shocked, or incredulous about markets for the past few months, that would make perfect sense.

This context is important because as portfolio losses accrue, it is challenging to keep perspective and avoid second-guessing. A 20% loss might be hard to differentiate from 30% despite being a much better outcome. As asset prices drop, it can feel terrible even if you have room to add exposure at much more attractive entry points. You may lose interest in relative performance and future opportunity and prefer to just stop losing money. This year is more likely to be conjuring up such feelings than any time in modern history.

And yet, if you can briefly suspend disbelief, 2022 has been a great year for Hedgewise. With near minimum levels of exposure across most asset classes, Hedgewise has substantially reduced its drawdown while simultaneously improving expected future returns. On a relative basis, September was one of the best single months ever. The three-to-five-year outlook is better now than it was at the market peak in January - really! - and all of this can be shown precisely.

To understand how this could be true, it is useful to provide context for how exceptional markets in 2022 have been.

No Historical Comparison

Many have compared this year to the late 1970s, when Paul Volcker aggressively raised interest rates to slay a decade of inflation. But in terms of tightening financial conditions and asset performance, this has already been much worse.

For example, long-term bonds have now lost over 30% this year alone, with a total drawdown over 40% since July 2020. Going back to 1972 (the earliest that good data was available), here are all the instances when bonds have lost 20% or more.

History of Bond Drawdowns Over 20%

Date RangeMax Drawdown
June 79 to Sept 81-23.4%
Dec 08 to May 09-26.0%
July 20 to Present-43.6%
Source: St. Louis Fed, Hedgewise Analysis. Includes an estimate for all coupons paid.

The datapoint from 2008 is mostly a red herring: rates went from 4.3% in November 2008 to 2.8% in December, as the financial system nearly collapsed, and then completed a round-trip back to 4.3% when the crisis was avoided. This was not a tightening of financial conditions and had little to do with the Fed. The experience in 1979 is more instructive, as 30yr rates went from 8% all the way to 15%, but on a relative basis, this was still much less painful than what is happening today.

The sheer scale and speed of this event has made it much harder than usual to sort through. For example, if bonds lost 10% in a single year, and you lost nothing, that would be a great outcome. But this year, the same relative performance would mean you lost 33% instead of 43%. It is challenging to treat these as two equally good outcomes.

The tricky part is differentiating between simple drawdown reduction and the ability to generate new gains. Losing 33% instead of 43% may be insubstantial if both portfolios return to the same level after a recovery, but it is more powerful if it can be translated into a permanent 10% advantage.

This dynamic is exactly what Hedgewise is optimizing for in a year like this one, and any loss reduction is likely to mirror future potential gain. This has gone exceptionally well so far in 2022, and it has only been possible due to such extraordinary circumstances.

The Good News

In September, RP Max lost about 11%, and this represents a historically excellent outcome for Hedgewise. How can this be?

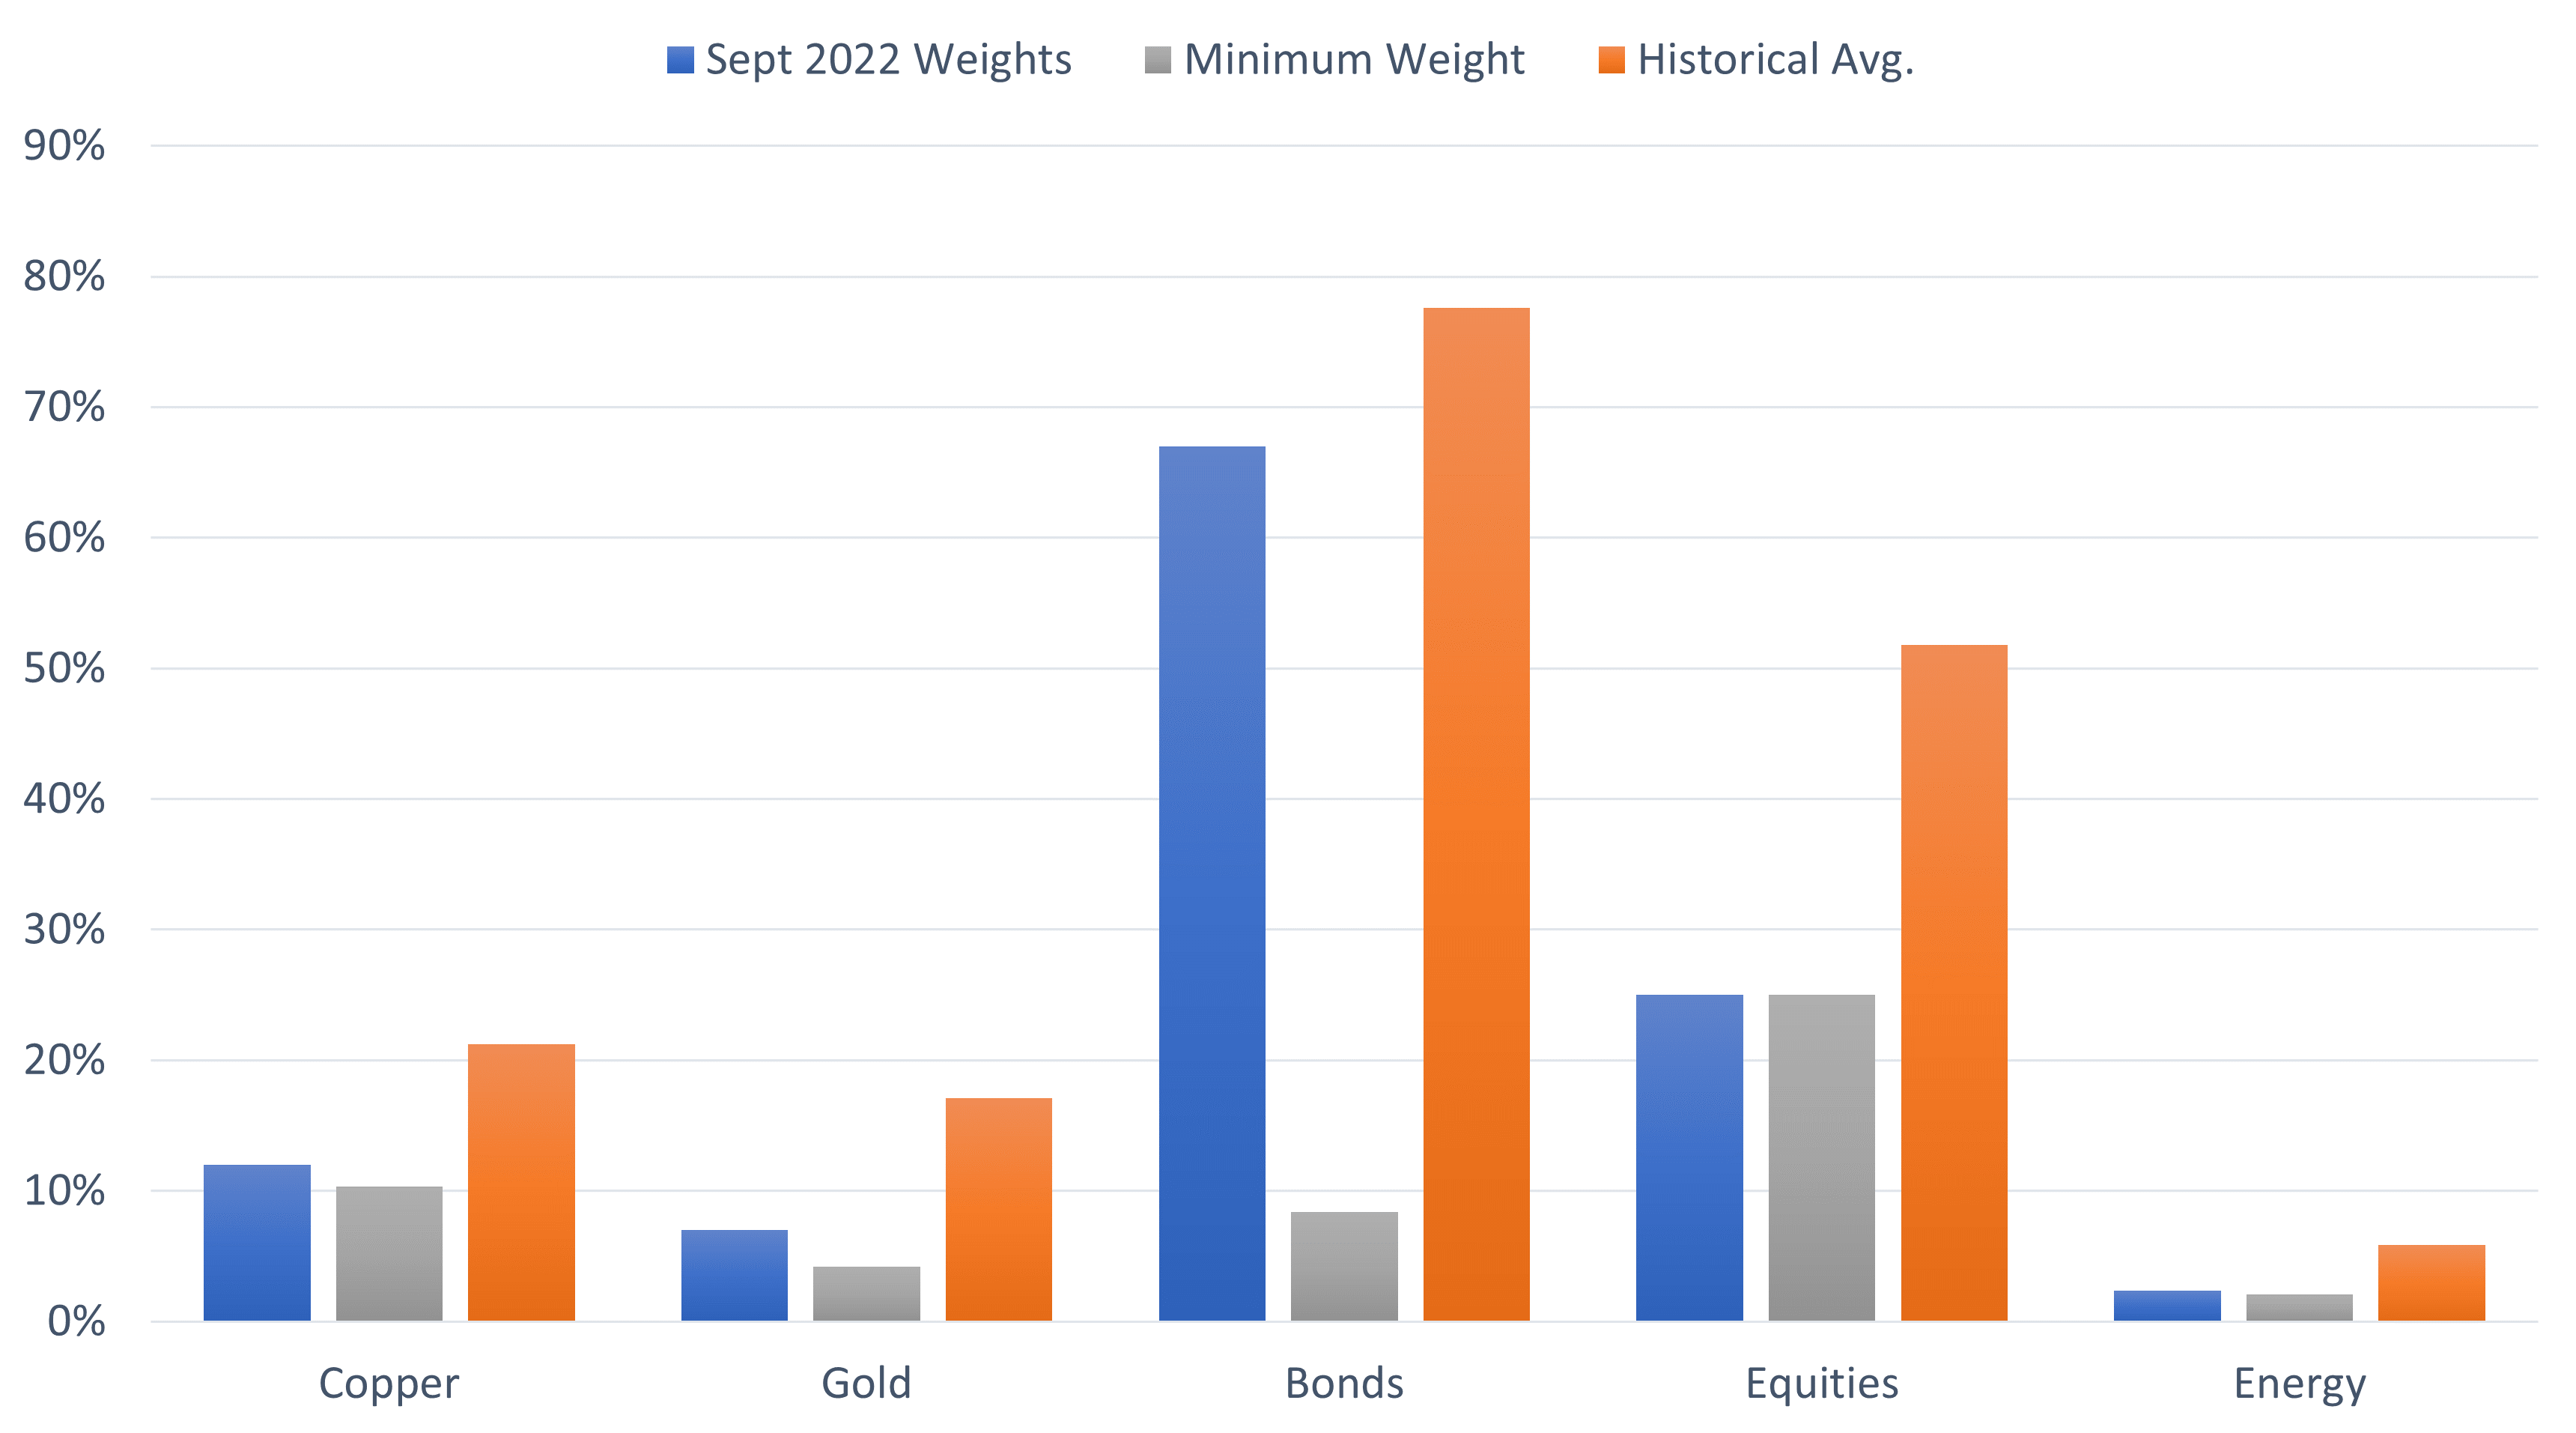
The following graph shows the Hedgewise weights across asset classes for last month (at the RP Max risk level). Notably, every exposure outside of bonds was at or near its minimum possible level, as represented by the grey bars below.

Hedgewise Weights by Asset Class, September 2022

Sept 2022 based on recommended portfolio weights in live client portfolios at the RP Max risk level for last month. Historical averages and minimum weights based on a risk model identical to the one being used in live portfolios and an assessment of monthly asset risk from 1977 through 2021, where available.

Outside of bonds - which we'll cover in much greater depth shortly - Hedgewise managed risk last month almost perfectly. Another way to understand this is by measuring the specific amount of potential loss avoided within each asset class. For example, if equities were weighted 25% less than average, and incurred a 10% loss, then that portfolio would have "avoided" a 2.5% potential loss through risk management.

Hedgewise Losses Avoided Through Risk Management, September 2022

Asset Sept 22 Weight Vs. Hist. Avg. Sept. Return Loss Avoided
Copper -9.2% -3.5% 0.3%
Gold -10.1% -3% 0.3%
Bonds -10.6% -12% 1.3%
Equities -26.8% -9.6% 2.6%
Energy -3.5% -9.6% 0.3%
Source: Bloomberg, Yahoo Finance, Hedgewise Analysis. September returns based on publicly available index data and include an estimate for all dividends and coupons paid. "Loss Avoided" defined as the additional loss that would have been incurred had asset weights remained at their historical average last month.

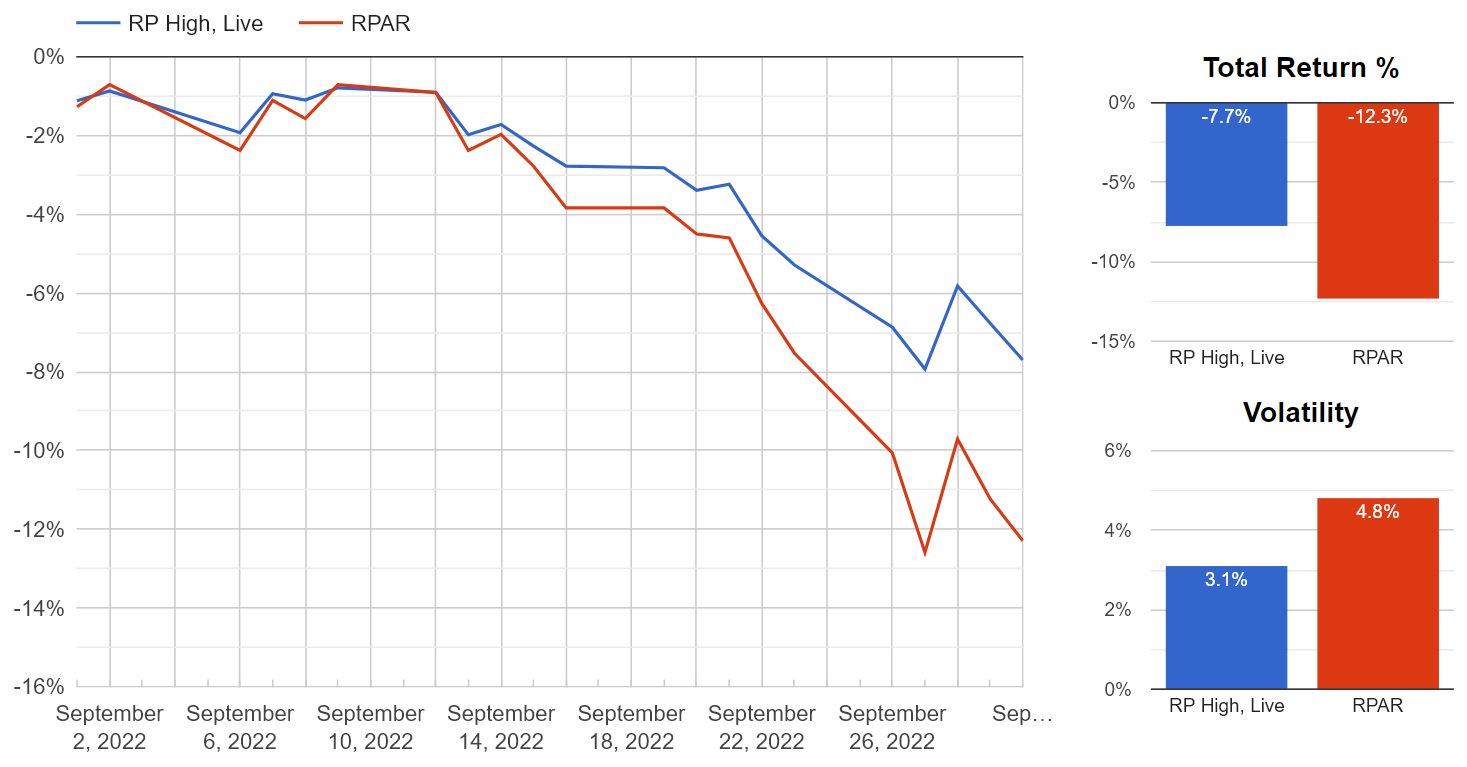
In other words, Hedgewise "should" have lost 16% last month, but instead it lost only 11%. To further validate this, we can compare Hedgewise performance to the RPAR ETF, which is a more passive risk parity product and has a similar target volatility to the RP High risk level.

RP High Live Performance vs. RPAR ETF, September 2022

Source: Sharadar, Bloomberg, Hedgewise Analysis. "RP High, Live" portfolio based on composite performance across all live clients at the RP Max risk level, including all costs and fees. Data includes an estimate for all fees, dividends, and coupons paid. Data as of September 30, 2022.

After adjusting for volatility, this is almost exactly the delta expected. There is rarely this degree of differentiation in most years, never mind in a single month. In more normal circumstances - say at the end of a year, Hedgewise had gained 15% while most similar funds had gained 10% - it would represent one of the best annual outcomes ever. Though Hedgewise performance in September was no less real or impactful, it can feel more difficult to appreciate alongside a significant drawdown.

This is ironic because successful loss avoidance is such a powerful driver of long-term outperformance. Part of this is simple probability: if an asset was at its minimum exposure during a period of loss, exposure will probably be higher during any subsequent recovery. In addition, you get a mathematical boost because any given loss requires a larger percentage gain to return to breakeven.

For example, in September, the "passive" risk parity portfolio lost 16%, compared to an 11% loss for Hedgewise. For the passive portfolio to return to breakeven, it must subsequently gain 19%. If Hedgewise participates in this, it would wind up with a 6% total gain. The higher the loss differential, the higher the potential future gain.

We can run this same calculation at various points in time this year to see how it has changed as bigger losses have accrued.

Potential Net New Gain Created by Loss Avoidance, RP Max

Hist. Avg. LossLive Portfolio LossPotential Net New Gain Post-Recovery
Feb 22-5%-2%4%
May 22-22%-12%14%
July 22-31%-18%19%
Current-41%-26%25%
"Historical Avg." performance based on same data used in prior chart. Live Portfolio loss is a composite of client performance in the RP Max risk level and includes all costs and fees. Potential "Created" Gain multiples the breakeven return required for the Historical Avg. portfolio by the starting base of the Live Portfolio. For example, for the "Current" calculation, the Historical Avg. portfolio would require a 69% gain to recover its 41% drawdown. If you multiply this by the starting point of the Live Portfolio (-26% drawdown), it yields a net gain of 25%.

From this perspective, the 26% drawdown of this year likely represents 25% of net new gain post-recovery. Said differently, whenever markets recover to the levels of January 2022, Hedgewise now has the potential to be 25% higher than where it started this year. This does not require fancy timing or good luck - asset weights need only return to historical average levels, and markets subsequently recover their YTD losses.

Returning to an earlier comparison, performance this year is comparable to a scenario where most assets are down 20%, and Hedgewise is breakeven. The scale of this year's losses just makes it much harder to see.

Hopefully the mechanics are becoming easier to follow. Losses are good if asset weights are low and have a high chance of increasing at much cheaper prices. Outside of bonds, Hedgewise has achieved near the best possible outcome this year. In fact, if you removed bonds from the portfolio, the current drawdown for RP Max would only be about 10%. But if you are going to concentrate a drawdown in a single asset class, bonds are where you want to do it from a systematic perspective.

I'd Rather Lose Money in Bonds

Treasury bonds have a few unique attributes that differentiate them from other asset classes. There is close to zero default risk, meaning if you hold a government bond to maturity, you are guaranteed to make your money back plus interest. As prices go down, interest goes up, so you are instantly paid more going forward whenever you accrue losses today. Because interest rates have such a huge impact on the economy, they will always tend to gravitate towards a "neutral" rate that is consistent with the Fed's mission of achieving 2% inflation alongside stable employment. The higher rates go above the neutral level, the more likely they will subsequently fall in the future, and vice versa.

These factors make bonds much more predictable and systematic than other assets and lead to counterintuitive outcomes where short-term losses can be preferable to gains.

A useful demonstration of this is using three-year government bonds, which began 2022 yielding a 1% interest rate. The Fed's best estimate of the "neutral" rate is 2.7%, so you'd expect that rates will rise. As a passive investor, what would be the best outcome over 5 years - for rates to stay where they are, rise slowly to 2.7%, or jump suddenly above the neutral rate and eventually settle back down to 2.7%?

We can model this easily, and the following shows how a passive portfolio would perform in all three scenarios. The actual three-year rate today is around 4.4%, so we'll use that number to model the final scenario where there is an initial "spike" before rates eventually return to neutral.

3yr Government Bond Model Performance, Various Interest Rate Scenarios

Source: Hedgewise Analysis. Includes an estimate for all coupons paid. Assumes rates rise or fall linearly over time between data points with zero volatility. All portfolios hold 100% 3yr bonds at all times.

It may be a surprise to see that the sudden rate jump yields a better outcome, despite initial losses of 7%. This is because all three scenarios wind up in the same place, but in the third you are paid a much higher level of interest in the interim. If you were a purely passive investor with a five-year time horizon, you'd prefer the current spike in rates to no rise at all.

Given what we know about how predictable bonds are, though, why would we stop there? As rates move above the neutral rate, there is an increasing chance that they will fall in the future. In a very simple form of risk management, say you decided to hold 33% exposure with rates starting at 1%, and implemented a system to increase that evenly to 100% exposure if rates hit 4%.

3yr Government Bond Model Performance, With Simple Risk Management

See prior disclosure. Risk managed model moves from 33% exposure initially to 100% exposure when rates reach 4% and remains there.

It probably feels counterintuitive, but this halves your drawdown and nets you another 3% in final return. Even if you could magically time this curve and move from no exposure to 100% at the exact bottom, you'd only net 5% extra at the end of five years (i.e., 21%). Simple risk management gets close to this ideal scenario with no work or timing required, so long as you can "look past" the initial drawdown and focus on your longer-run returns.

Now imagine that interest rates rise to 6% instead. Would the framework still hold?

3yr Government Bond Model Performance, 6% vs 4.4% Interest Rate Peak

See prior disclosure. Both risk managed models assume 100% exposure starting at 4% level of interest rates.

By the end of five years, a 6% interest rate peak yields a better outcome despite the larger initial drawdown. While this math is straightforward, the implications can feel backwards. Revisiting the earlier example, a 4.4% peak with perfect timing (i.e., no drawdown, invest at precise bottom) yields a total return of 21%. A 6% peak with simple risk management yields 23% despite initial losses. A rational investor should prefer the latter, but that means rooting for higher bond losses and foregoing any attempt to time them.

These same lessons apply to longer bonds in a similar manner, just amplified.

How This Works for Long Bonds and Hedgewise

Now let's bring these concepts to life in the live Hedgewise portfolio, which uses twenty and thirty-year bonds in addition to more sophisticated risk management.

Just as in the theoretical discussion, Hedgewise began this year with limited bond exposure and has increased it methodically as rates rose above neutral levels. The following shows the live relative performance of bond exposure in the RP Max portfolio versus passive 30yr bond returns.

Impact of Bonds on Hedgewise RP Max vs. Passive Portfolio, January to October 2022

The Bond Impact on RP Max calculated using live recommended portfolio weights in client portfolios multiplied by the average monthly return on 30yr nominal and inflation-protected bonds. Includes an estimate for all coupons paid.

So far, so good. The drawdown is less than half that of a passive portfolio, while bond exposure has been increasing throughout the year. We can model a few simple hypotheticals moving forward. Imagine that rates have peaked this month, and slowly move down to the neutral level of 2.7% over the next four years with very little volatility. Hedgewise bond exposure is assumed to remain at the historical average level throughout the recovery (which it is close to in live portfolios at present).

Model 1: Rates Peak at 4%, Hedgewise Returns to Historical Average Bond Weights

Assumes 30yr bond yields fall from 4% to 2.7% over the remaining time in the five-year period. Assumes Hedgewise bond weights stay near 80% in the RP Max portfolio after live data ends, which is consistent with historical average weights.

Note that the highlighted portion is equivalent to the prior graph. In this basic scenario, Hedgewise translates its current loss into a 13% net gain by the end of five years. This is already consistent with the theory discussed earlier despite representing a likely "floor" of potential outcomes.

Bond yields are unlikely to fall predictably in this perfect straight line. Expected volatility is a part of how Hedgewise applies risk management, and this year provides an excellent case study of how this can be used to further boost expected returns.

From July to September, 30yr yields went from 3.1%, down to 2.9%, and back up to 3.4%. It follows that you'd adjust exposure accordingly, and this is precisely what Hedgewise did.

Recommended Bond Exposure by Month in the RP Max Portfolio, July to September 2022

Month30yr RatesHedgewise Weight
July3.1%63%
August2.9%58%
September3.4%68%
Hedgewise weight based on total recommended bond exposure for live client portfolios at the RP Max risk level.

Hedgewise is capturing little pockets of gain and avoiding potential losses as rates bounce around. Just the reduction in exposure at the beginning of August alone is worth about 0.5% in "extra" return for 2022. The more bond volatility, the more potential there is amplify these gains. We can model how this opportunity would affect expected Hedgewise returns depending on how choppy markets are over the next few years.

Model 2: Add Bond Volatility Management

Bond Vol assumed to add 0.7% to annual returns with average volatility and 1.5% with high volatility.

The final assumption from the initial scenario that needs revisiting is the level of bond exposure. The historical average weight is conservative, especially with rates already so high above neutral. A more likely outcome is that exposure eventually rises to 20% above this level.

Model 3: Bond Exposure Rises to 20% Above Historical Average Weight

Assumes final exposure rises to 100% rather than the historical average weight of 80%. See prior disclosures.

Compared to January of this year, Hedgewise has improved its five-year bond outlook by 13% to 28%, or an annualized 2.5% to 5%. This is a great outcome for any asset class, never mind one during a once-in-a-century crash! Despite that, intuition may still suggest that it would be better if losses were lower or the recovery were faster, but neither is true.

For example, here is the same model with rates peaking at 5% instead of 4%.

Model 4: Rates Rise to 5% Instead of 4%

Model uses identical assumptions to previous, but assumes rates rise to 5% in the first year rather than 4%.

The near-term drawdown increases by 10% while simultaneously improving the five-year outcome. This is weird, but mathematically true! It is better to be paid 5% interest and it improves the chance of adding extra exposure and benefitting from volatility. Your outlook keeps improving as a mirror image to the initial drawdown.

To emphasize this further, the following graph summarizes the expected performance for interest rate peaks of 3% to 7% (the 3% peak assumes that rates fall from their current level to 3% by end of year). These curves assume increased exposure and high bond volatility, but the relative performance would be similar for other assumptions.

Comparing Expected Performance Across Various Interest Rate Peaks

See prior disclosures. All models use identical assumptions except for the peak interest rate reached in year 1.

A rational investor should choose a 7% peak, along with a 40% initial drawdown. This would net you 35% in extra gain by the end of five years compared to an immediate recovery in which rates suddenly fell back down to 3%. Also note how all the curves intersect at around the same time, which reinforces how little meaning this interim period carries. Whether we have an instant recovery in bonds or not, you expect to be in a similar place a few years down the road. At that moment, you'll have a whole lot more upside if rates peak higher.

The implications can feel topsy-turvy, but the intuition is basic. It's good if interest rates rise because you can keep adding exposure and getting paid higher coupons. It's the only asset class where losses can be so systematically converted into eventual gains. This year, the five-year outlook for bonds has only gotten better. It just happens to involve a drawdown upfront.

Wrapping Up: Bad News is Good News

The massive price declines across financial markets in 2022 belie the benefits accruing to Hedgewise along the way. Exposure to most asset classes has been near a minimum throughout, which has mitigated the drawdown and maximized the chance of capitalizing on cheaper entry points. Bonds are responsible for most of the current loss, but higher interest rates are being systematically translated into longer-term expected gains. Hedgewise has outperformed passive Risk Parity benchmarks by 15-20% this year, and it is mostly a question of when this will shift into realized profit.

From a big picture perspective, the recovery of this year's drawdown will likely occur in the same 6 to 12 month timeframe regardless of its size. It will happen when rates fall back to the neutral level, and that must eventually occur because they cannot stay restrictive forever. Whether rates have already peaked or go on to rise further, it will not significantly alter the recovery timeline. (i.e., whether rates peak at 4% or 7%, the portfolio breaks even as rates subsequently approach 3%)

Given that, the size of the current drawdown should be interpreted opposite as you'd expect. Bigger and longer losses yield a greater expected gain than smaller and shorter ones, while still breaking even within the same few months. From a long-term perspective, both outcomes are superior to a scenario where markets never dropped at all.

These mechanics are specific to the bond market and rising interest rates, which may be part of the reason the concepts feel foreign. Interest rates have only ever gone lower for the past 40 years. But from a risk management perspective, bond losses are uniquely positive. Unlike equities or commodities, where you can run into periods of pure wealth destruction (e.g., oil prices briefly went negative in 2020), bonds are simply moving around money in time. This dynamic can be exploited to transform drawdowns into gains with greater confidence than any other asset class, but Hedgewise has had little opportunity to do so until this year.

In hindsight, 2022 may very well mark the start of a great new era for risk management.

Disclosure

This information does not constitute investment advice or an offer to invest or to provide management services and is subject to correction, completion and amendment without notice. Hedgewise makes no warranties and is not responsible for your use of this information or for any errors or inaccuracies resulting from your use. Hedgewise may recommend some of the investments mentioned in this article for use in its clients' portfolios. Past performance is no indicator or guarantee of future results. Investing involves risk, including the risk of loss. All performance data shown prior to the inception of each Hedgewise framework (Risk Parity in October 2014, Momentum in November 2016) is based on a hypothetical model and there is no guarantee that such performance could have been achieved in a live portfolio, which would have been affected by material factors including market liquidity, bid-ask spreads, intraday price fluctuations, instrument availability, and interest rates. Model performance data is based on publicly available index or asset price information and all dividend or coupon payments are included and assumed to be reinvested monthly. Hedgewise products have substantially different levels of volatility and exposure to separate risk factors, such as commodity prices and the use of leverage via derivatives, compared to traditional benchmarks like the S&P 500. Any comparisons to benchmarks are provided as a generic baseline for a long-term investment portfolio and do not suggest that Hedgewise products will exhibit similar characteristics. When live client data is shown, it includes all fees, commissions, and other expenses incurred during management. Only performance figures from the earliest live client accounts available or from a composite average of all client accounts are used. Other accounts managed by Hedgewise will have performed slightly differently than the numbers shown for a variety of reasons, though all accounts are managed according to the same underlying strategy model. Hedgewise relies on sophisticated algorithms which present technological risk, including data availability, system uptime and speed, coding errors, and reliance on third party vendors.

July 2022 Commentary: The Ideal Drawdown
Posted in Market Commentary on 2022-07-27

Summary

  • The drawdown of 2022 has been close to ideal from a risk management perspective.
  • Hedgewise has had historically low asset exposure levels since January, which has both limited the size of the drawdown and created opportunity to invest at cheaper prices.
  • In the most likely scenario of a moderate-to-severe recession, Hedgewise expects the Risk Parity "Max" strategy to gain 30% to 40% over the next 12 to 24 months.

Introduction: Deconstructing "Good" Losses

The last Hedgewise newsletter discussed why this year’s losses were "good" because they were relatively moderate and created opportunity for additional future gain. Counterintuitively, greater subsequent loss would be welcome for the same reason. Fast forward to today, and we've experienced just that. This is positive, but it can be very challenging to grasp how in real-time. We'll analyze this in practical, granular detail to better understand the dynamic and to specifically visualize how the next 12 to 24 months are likely to play out.

At the simplest level, a loss is good if you can subsequently buy-in at a cheaper price. The key question is how your exposure level at the beginning of any drawdown compares to your total potential exposure. For example, an ideal scenario would be moving from 0% exposure at a peak to 100% at a bottom, but this would require perfect timing and foresight. The Hedgewise Risk Parity strategy is built to achieve a similar dynamic systematically, and its success can be measured by how its asset weights compare to historical averages during periods of loss.

Hedgewise 2022 Average Exposure by Asset Class vs. Historical Average, Risk Parity "Max"

2022 Averages based on recommended portfolio weights in live client portfolios at the RP Max risk level from January through July of this year. Historical averages based on a risk model identical to the one being used in live portfolios and an assessment of monthly asset risk from 1977 through 2021, where available.

Across the board, Hedgewise exposure throughout 2022 has been significantly lower than historical averages. This simultaneously moderates the drawdown as it occurs, while presenting the opportunity to increase exposure once asset prices have fallen.

To better visualize this, the following graph shows how this year's performance in the RP Max strategy compares to the hypothetical "historical average" portfolio from above.

2022 RP Max Live Performance vs. "Historical Average" RP Max Portfolio

"RP Max, Live" portfolio based on composite performance across all live clients at the RP Max risk level, including all costs and fees. "RP Max, Historical Avg. Weights" represents a hypothetical model portfolio composed of the precise percentage exposures from the prior chart: 21% copper, 17% gold, 47% 30yr Treasury bonds, 52% equities, 31% 30yr TIPS, and 6% energy. The model includes an estimate for all fees, dividends, and coupons paid. Data as of July 22, 2022.

Hedgewise has nearly halved the drawdown of this year compared to a more passive approach, but this does not fully capture the potential positive impact. Now that asset prices are so much cheaper, Hedgewise has an opportunity to increase exposure back in line (or even above) its historical averages. This would drive future gains that outsize the initial drawdown, and this potential increases the more that the red and blue lines above diverge.

For example, the "historical average" portfolio has a current YTD loss of 30.6%. It would require a subsequent gain of 44% to return to breakeven (the percentage gains required to offset any loss are always higher mathematically since you are starting from a lower base). If Hedgewise participated in this gain from today forward, it would wind up with a +19% total return, even though asset prices had only returned to the same levels as the start of 2022 (mathematically, this is the -17.5% loss in the live portfolio multiplied by a 44% gain). These potential gains are only "created" because of the initial loss.

To illustrate this further, here is the same math run at various dates this year. In each case, it shows the potential "created" gain for the Hedgewise portfolio given the loss for the "historical average" portfolio.

Potential Future Gain Created by Equalizing Exposure After Losses

"Historical Avg." LossLive Portfolio LossPotential "Created" Gain"
Feb 22-5%-2%4%
May 22-22%-12%14%
Current-31%-18%19%
See prior disclosure. Uses identical analysis but drawn from different points in time over the course of 2022. Data as of July 22, 2022.

Potential return for the strategy is higher now than it was in January, prior to any drawdown. The additional losses in May and June have only increased it further.

To be clear, this is being discussed from a probabilistic perspective, and these gains are not guaranteed. To capture them, the portfolio must first return to the historical average weights at or near the bottom, and then a full recovery must ensue. But it is still accurate to say that potential opportunity has increased throughout the course of this year, and that it would not exist if these losses had not occurred.

The remaining question is whether Hedgewise will succeed in taking advantage of this. If the portfolio returns to historical average weights but asset prices decline further, additional opportunity will be missed. The same is true if the portfolio fails to increase weights before asset prices recover.

The good news is that there is a systematic way to approach this problem, and it is why so much time has been spent discussing the Fed and interest rates over the past two years. Unlike other assets, bonds have a more specific range of outcomes which allows Hedgewise to greatly increase its odds of success.

Bonds, the Big Picture, and 2022

Stepping back to a bigger macroeconomic picture, bonds are unique compared to riskier assets like stocks or commodities because interest rates are controlled by the Fed and generally operate within a band of stimulative, neutral, or restrictive. The "neutral" rate is continuously predicted and published by the Fed, and everyone expects rates to spend most of their time around this level (because stimulative/restrictive rates are reserved for periods of recession/overheating, which should be infrequent).

The current estimate of the neutral rate is 2.4%. Here is a look at how the interest rates on 30yr Treasury bonds have moved in 2022 compared to this.

30yr Treasury Bond Interest Rates vs. Neutral Rate, 2022 YTD

Source: Federal Reserve

The Fed has moved from stimulating the economy at the start of this year to restricting it to fight inflation. So long as you believe that the neutral rate is correct and that the Fed will eventually succeed in bringing down prices, this means 30yr interest rates should eventually fall closer to the orange line. If that happens, bond prices would rise by about 18% in addition to the 3%+ coupon paid out in the interim.

While these assumptions could be wrong - maybe the neutral rate is higher, or rates will have to become much more restrictive to beat inflation - bonds are without question a much less risky investment now than they were at the beginning of 2022. With this in mind, here are the monthly bond exposure levels of the Hedgewise RP Max portfolio this year.

Hedgewise Total Bond Exposure in the Live RP Max Portfolio, 2022 YTD

Columns represent the total recommended percentage bond exposure in live client portfolios in the RP Max product. Total bond exposure is equal to recommended exposure in long-term Treasury bonds plus total exposure in long-term TIPS. Historical average and maximum exposure lines based on a risk model identical to the one being used in live portfolios and an assessment of monthly asset risk from 1977 through 2021, where available.

Bond exposure in the Hedgewise portfolio automatically adjusts as rates move from stimulative to restrictive, ensuring that it can capture much of the "potential" gain discussed earlier. However, note how there is significant room to add exposure. If rates continue higher, this would be viewed positively until the "maximum" exposure level is reached. Ironically, this would drive both near-term loss and longer-term expected gain in parallel.

To be fair, this would no longer function if rates rose and stayed high indefinitely, e.g., if the neutral rate were 4% or higher. I believe that is unlikely because it would imply long-term inflation expectations higher than 3%, which is in direct conflict with the Fed's mandate of targeting inflation of 2%. If inflation expectations were that high, the Fed would maintain a restrictive stance to continue to drive down demand until inflation was also subdued. In other words, it is much more likely that the Fed destroys growth than that it permits inflation to exceed 3%, which means a prolonged recession is a much higher likelihood than a neutral rate over 4% (and Chairman Powell has essentially said this outright).

Perspective on the Past and Future

In January 2022, the RP Max portfolio had historically low exposure to both equities and long-term bonds. If you had asked me at the time for the ideal scenario in six months, it would have been for both asset classes to lose 20-30% as quickly as possible. This would enable higher long-term returns for the portfolio and increase the ability of stocks and bonds to properly hedge each other across different economic environments.

Fast forward to today, and we have come close to a perfect landing. On the margins, it would have been nice if it happened a little bit faster and if both asset classes lost a little bit more (they still might, which would be good!). In theory, commodities should have held up more strongly in such an inflationary environment, but their weights have also been below historical averages, so this presents additional opportunity. Overall, this has gone well, but it takes some perspective to understand how this sentiment logically applies to a 20% drawdown.

This is easier to conceptualize when you look ahead. The portfolio is already well-positioned to gain 30-40% whenever the underlying asset classes breakeven with January 2022 (This equates to a net gain of 10-15% if you were measuring from the beginning of this year). My best estimate is that this happens between mid-2023 and early 2024, depending on the specific asset. The outcome has the potential to be even better depending on how market risk evolves and whether prices continue to fall. These gains will have been "created" by the losses of this year, and no timing or judgment is required.

It can be difficult to embrace this process because these concepts do not exist for purely passive investors. If you invest in 100% stocks, you can only make back what you lose, and any drawdown is unwelcome. For Hedgewise, drawdowns can take many different forms, and the present one is already "good" with the potential to be "great", depending on the shape of the recovery.

Some Final Counterintuitive Thoughts

I've frequently advised clients this year that it is a great opportunity to put money to work, and it is only getting better and better along the way. That was as true in January 2022 as it is today, despite the 20% drawdown (at the RP Max risk level) that has occurred since. How can this be?

The simple reason is that return expectations have been consistently positive. In perfect hindsight, if we returned to January 2022, your expected return by mid-to-late 2023 would be 10-15%. Not only does this account for the present drawdown, but those gains are dependent upon it!

In every subsequent month since then, the expected return has only improved, and if you happen to be sitting on cash presently, there is a high likelihood of gaining 30-40% by the end of next year. It is easy to get hung up on predicting the exact bottom, but realistically, these are all good entry points, especially when Hedgewise is systematically taking advantage of additional losses along the way. If you happen to call it perfectly, whether through luck or skill, that is like an extra "active management" bonus. But realizing a slightly lower gain without any judgment or timing is also a great outcome.

The losses incurred this year have been close to ideal. The portfolio has held near-minimum exposures in most asset classes since January and now has an opportunity to take advantage of lower prices, which is already happening systematically in the bond market. A hard landing would be a great outcome and more losses would be welcome. Worst case, the economy recovers too quickly, and you make back your money without as much "extra" gain. This is exactly how a good hedge should work, and all that it requires is the patience and time to see it through.

Disclosure

This information does not constitute investment advice or an offer to invest or to provide management services and is subject to correction, completion and amendment without notice. Hedgewise makes no warranties and is not responsible for your use of this information or for any errors or inaccuracies resulting from your use. Hedgewise may recommend some of the investments mentioned in this article for use in its clients' portfolios. Past performance is no indicator or guarantee of future results. Investing involves risk, including the risk of loss. All performance data shown prior to the inception of each Hedgewise framework (Risk Parity in October 2014, Momentum in November 2016) is based on a hypothetical model and there is no guarantee that such performance could have been achieved in a live portfolio, which would have been affected by material factors including market liquidity, bid-ask spreads, intraday price fluctuations, instrument availability, and interest rates. Model performance data is based on publicly available index or asset price information and all dividend or coupon payments are included and assumed to be reinvested monthly. Hedgewise products have substantially different levels of volatility and exposure to separate risk factors, such as commodity prices and the use of leverage via derivatives, compared to traditional benchmarks like the S&P 500. Any comparisons to benchmarks are provided as a generic baseline for a long-term investment portfolio and do not suggest that Hedgewise products will exhibit similar characteristics. When live client data is shown, it includes all fees, commissions, and other expenses incurred during management. Only performance figures from the earliest live client accounts available or from a composite average of all client accounts are used. Other accounts managed by Hedgewise will have performed slightly differently than the numbers shown for a variety of reasons, though all accounts are managed according to the same underlying strategy model. Hedgewise relies on sophisticated algorithms which present technological risk, including data availability, system uptime and speed, coding errors, and reliance on third party vendors.

May 2022: "Good" Losses, Bad Year
Posted in Market Commentary on 2022-05-02

Summary

  • This year, global markets have experienced the worst and fastest cross-asset drawdown in modern history due to a mix of uncertainty about the war in Ukraine, "Zero Covid" in China, and runaway inflation.
  • While painful in the short-term, these losses are surprisingly a positive development. With a fuller understanding of how Hedgewise functions in the current environment, we can see why bigger short-term losses are preferred.
  • The Hedgewise algorithm is built to systematically "convert" every 1% loss into a larger expected long-term gain. We will examine this in-depth in the bond market, where the dynamic can be most easily understood.
  • The current Hedgewise drawdown is much smaller compared to similar historical periods as well as major Risk Parity competitors, which further improves future potential upside.
  • The prevailing environment of panic alongside Fed tightening is one of the most accurate historical signals that a bottom is close, but any additional loss will only add to total expected returns in time.

Overview: We Knew It Was Coming, But It Happened Fast

For the past two and a half years, Hedgewise has been analyzing how markets would behave against a backdrop of a "Fed-induced bubble" and cautioning against getting involved in its many strange distortions (i.e., meme stocks, negative yields, SPACs, crypto). A culmination of events in March and April has swiftly unwound most of the bubble, and while its speed and depth has been historically unprecedented, global markets – and Hedgewise in particular – will be better off for it.

As a quick, and hopefully final, refresher of how the Fed created a bubble, here is the familiar visualization of how near-zero interest rates affect expected asset returns over time. It literally "pulls" returns from the future into today, and at the extremes, it can create negative future return expectations (for example, negative real yields mean you are guaranteed a negative real loss on your money)

How Passive Expected Total Returns Change Over Time with Zero Interest Rates

Source: Hedgewise Analysis

The Fed got itself in a mess by pushing the bond market towards the yellow line with its overaggressive stimulus, and then lots of other assets followed suit. They were crossing their fingers that they could leave these policies in place for long enough for the 'real' world to catch-up. This would have looked like a few years going by with moderate inflation, and asset prices would have been mostly flat while they slowly raised rates along the way (i.e., the horizontal yellow line remains flat until it eventually intersects with normal returns).

The trouble is that this required inflation to stay relatively low, and for nothing "bad" – like a war, for example – to happen to the world in the meantime. In 2022, we experienced all of that at once, and markets are moving down the red lines accordingly.

For passive investors this is bad news, as many asset prices are completing a round trip to zero (or worse) compared to before the pandemic began. This is the problem with a Fed-controlled environment: they are moving money around in time, but not increasing the fundamental pie.

For Hedgewise, on the other hand, the potential return that was just pushed to the future will be larger than its near-term losses. This is possible because of specific Hedgewise algorithms that take advantage of this environment and because the portfolio has positioned cautiously throughout this era to account for its likely reversal. In short, Hedgewise will systematically own more of these assets when they recover than it does when they are falling, and this can be shown both in theory and in practice.

Still, this can be a hard pill to swallow, and it can feel wrong to accept another 5% loss now even if it leads to an extra 5% net gain in the future. Why not just avoid the drawdown altogether and re-enter at the bottom? It is crucial to maintain perspective that there is a better chance that markets have already bottomed than that they have not, and that becomes more and more likely as prices fall further. The Hedgewise methodology takes advantage of those losses without having to time them and avoids missing the recovery once we reach the bottom.

As it relates to the present, there is a good case that markets have already overreacted to transitory events like the war in Ukraine and the Covid situation in China. Periods of Fed tightening are also classically volatile because investors tend to fear the worst whenever there is heightened uncertainty, and that effect is being amplified by the Fed's pandemic mistakes. Everyone goes "risk-off" at once, and many assets trade at a discount to fair value simultaneously. These periods have historically predicted some of the best near-term returns for Hedgewise regardless of the final economic outcome.

There is no doubt that this will go down as a historic market event, but it is shaping up to be a good one for Hedgewise so long as you know where to look.

The Big Picture: Measuring "Good" Losses

Periods of loss are fully expected in the Hedgewise framework because it is systematic and involves no judgment or timing. Its long-term success does not come from avoiding loss, but from mitigating the short-term damage through risk management and subsequently taking advantage of cheaper asset prices. From this perspective, the proper way to evaluate any drawdown is its size relative to broader market conditions.

For context, here is year-to-date performance across each asset class.

Performance by Asset Class, 2022 YTD

Source: Bloomberg, St. Louis Fed, Hedgewise Analysis. Data as of 04/29/22 and includes an estimate for all dividends and coupons.

In 2022, bonds are down 18% and stocks are down 13%, while commodities outside of energy have barely moved the needle. Incredibly, if you look back all the way back to 1950 for any similar period of performance, you will not find one. In fact, bonds have only lost 15% or more one time ever in modern history, and that was when Paul Volcker was breaking the back of stagflation in 1980-1981 and raising short-term interest rates to nearly 20%. Back then, gold doubled in price alongside this as investors sought inflation hedges aggressively, but gold is only up about 3% this year.

To emphasize, cross-asset performance over the past four months has been substantially worse than 1980, when inflation had been raging for a decade alongside multiple recessions and energy crises.

While no other episode has been as bad as this one, there have been a handful of other similar cases which all occurred during periods of aggressive Fed tightening (keep in mind that these are purposefully some of the worst data points in history and very rarely occur) The following table shows comparable asset performance during these times alongside model performance of Risk Parity "Max".

Comparison of Asset Performance During Similar Economic Environments vs. RP Max

Bonds Equities RP Max
Feb-Mar 1980 -7% -11% -24%
Jan-Sept 1981 -12% -10% -23%
Feb-Jun 1984 -9% -4% -18%
Feb-Nov 1994 -14% -4% -18%
Current -18% -13% -10%
Source: US Treasury, Fed Reserve Economic Data, Bloomberg, Hedgewise. RP Max performance based on a hypothetical model that relies on the same algorithm used in live client portfolios. Data based on publicly available index or asset price information and all dividend or coupon payments are included and assumed to be reinvested monthly. See full disclosures at end of article.

In every other similar event, RP Max had nearly twice the drawdown as it does currently against less severe backdrops. 2022 will likely go down as one of most successful periods of loss mitigation for Hedgewise ever.

This relative success can also be measured compared to other major benchmarks. For example, here is how Hedgewise has performed against the two largest passive Risk Parity funds (note that the closest historical benchmark to these funds is the RP "High" risk level).

Performance of Hedgewise vs. Passive Risk Parity Funds

Source: Bloomberg, Morningstar, Hedgewise. RP High performance is a composite of live client performance at that risk level and includes all fees, costs, and dividends. RPAR is a publicly traded ETF. The Wealthfront mutual fund trades under the ticker WFRPX. An estimate for all dividend and coupons have been included.

We'll dive into greater detail about the mechanics behind this relative outperformance in a bit, but first it is important to step back to the bigger economic picture. Losses driven by Fed tightening are moving gains back to the future. The deeper the cross-asset drawdown, the more "built-in" rebound accrues. For example, here is how each asset class performed in the 12 months following each of the prior similar periods.

Subsequent 1yr Returns by Asset Class During Similar Economic Environments vs. RP Max

30yr Bonds Equities RP Max
March 1980 9% 40% 44%
September 1981 47% 10% 81%
June 1984 45% 31% 78%
November 1994 36% 38% 99%
Source: US Treasury, Fed Reserve Economic Data, Bloomberg, Hedgewise. RP Max performance based on a hypothetical model that relies on the same algorithm used in live client portfolios. Data based on publicly available index or asset price information and all dividend or coupon payments are included and assumed to be reinvested monthly. See full disclosures at end of article.

While these numbers might seem challenging to imagine in the present environment, consider a few interesting facts. TIPS bonds will be paying between a 7-10% annualized coupon for the next year to cover inflation. If long-duration bonds eventually return to the long-term "neutral" rate currently estimated by the Fed, they will rally another 12-15%. Equity returns tend to at least match inflation over time because prices and profits eventually move up alongside one another. For stocks to simply match expected CPI of 6% for 2022 (which would mean a 0% real return), the S&P 500 would have to rally over 20% by December.

This highlights the natural duality of an inflationary environment. It is par for the course to have large drawdowns due to persistent uncertainty and price shocks, followed by large rebounds as all assets catch up with prevailing price levels and uncertainty falls. Knowing this pattern, bigger losses are preferred if you can mitigate their impact since they will tend to precipitate a larger relative recovery.

In this sense, current Hedgewise losses are some of the "best" on record. To see these mechanics more clearly, let's do a deep dive into how the Hedgewise algorithm manages its bond exposure in a near-zero interest rate environment.

Fun With Zero Interest Rates: When More Losses Are Better

The way that Hedgewise manages its bond exposure is intuitive: it decreases its exposure as rates approach zero and increases it as they approach more normal levels. This systematically creates a dynamic where bigger losses are better because you keep on increasing exposure along the way (i.e., you are automatically selling higher and buying lower).

As an example, 30yr bonds began 2022 with an interest rate of 2%, and the Fed currently estimates that the "neutral" long-term rate (which is basically its long-term projected level) is 2.4%. Imagine one scenario – let's call it "Inflation Problem" – where rates first rise to 4% before falling back down to 2.4% at the end of three years. In a second scenario ("No Problem"), rates sleepily go from 2 to 2.4% without much volatility in between. The following graph simulates how the Hedgewise algorithm would be expected to perform in each scenario alongside a purely passive bond investment.

Simulated Bond Performance Scenarios, Rates Rise From 2% to 2.4%, 36 Months

Source: Hedgewise Analysis. The Hedgewise model is using a scaled level of exposure as interest rates shift and presumes a "Max" Hedgewise risk level. Simulation based on randomized interest rate movements over time along each path. Every simulation will be slightly different, but each outcome is broadly representative of the expected return path.

This nicely highlights the various trade-offs. In the "Inflation Problem" scenario, Hedgewise eventually improves its total return by over 10%, but it first must grapple with a 15% drawdown when rates peak at 4%. These two outcomes are inextricably related: you can only get the extra return because of the circumstances created during the drawdown (i.e., you can increase your bond exposure more heavily while receiving a higher coupon payment)

It is interesting to examine this behaviorally. From a financial perspective, this is a solid trade-off, and bigger drawdowns are merely indicators of higher eventual returns. You would not seek to limit it or stop yields from rising even higher. Yet there is a strong human impulse to limit losses however possible, and a common reaction is to ask, "but why not just wait to invest until after the drawdown happened?"

The trouble is that would require knowing precisely when rates had peaked, while Hedgewise benefits no matter where and how that happens. For example, the following graph shows two more scenarios where rates peak at 3% and 3.5% compared to the original 4% we used in the "Inflation Problem". Rates are still assumed to end at the neutral rate of 2.4%.

Simulated Bond Performance Scenarios, Various Rate Peaks, 36 Months

Source: Hedgewise Analysis. The Hedgewise model is using a scaled level of exposure as interest rates shift and presumes a "Max" Hedgewise risk level. Simulation based on randomized interest rate movements over time along each path. Every simulation will be slightly different, but each outcome is broadly representative of the expected return path.

As a reminder, rates are already near 3% right now, and this may well be the peak of this cycle (especially if we hit a recession, which will almost certainly quash inflation and send long-term yields back down). If not, any additional drawdown eventually converts into higher final returns. It is a win-win with no timing required, so long as you can "look past" the necessary drawdown in the middle.

These simulations depend on a terminal rate of 2.4%, but positive total returns would still be expected even if the terminal rate was as high as 4%. If you were intent on making a "bear" case, it would be for rates to reach 4.5%+ perpetually, but it is very difficult to project that realistically given longer-term demographic and technological trends.

This algorithmic approach is unique to bonds in a near-zero interest rate environment, which is why it is such a big deal to understand right now. The current Hedgewise drawdown attributable to bonds falls within this framework, which means the strategy is having a great year in terms of total expected net return.

This dynamic was not available in the similar historical periods highlighted earlier, which explains the much more severe drawdowns that were incurred. However, it is not as if those were "failures" either. At the Max risk level, occasional drawdowns of 20-30% are expected, and do not detract from long-term expected returns. These scenarios are almost always driven by Fed-induced uncertainty, and it is only a matter of time until one or many assets rebound. The same is expected in 2022, but with a significant bonus from the zero-interest rate bond framework.

A Refresher on Fed Tightening

Back in 2018, the Fed underwent a year-long tightening that sent markets tumbling, and Hedgewise published a deep historical analysis at the time that is worth revisiting. The gist is that this almost always happens when the Fed starts increasing rates because investors are paralyzed amidst the uncertainty. There are too many simultaneous bad potential outcomes (i.e., hyperinflation, recession, stagflation, etc.), so investors price all of them at once. This leads some assets to become undervalued because only one scenario can unfold.

This environment tends to happen suddenly and chaotically. It is very difficult to time, but it implies a rapid recovery whenever greater certainty returns. Investors should generally expect deep and quick drawdowns followed by equally rapid recoveries regardless of the actual economic outcome.

To get a better sense of this, the following chart captures every period of disruptive Fed tightening since 1972. The first bar on the graph shows the sum of equity and bond losses over each period to highlight the degree of cross-asset damage. The second bar shows the drawdown in the Risk Parity Max strategy during the same period (note that model data is used prior to 2015, and live data is used since then).

Stock and Bond Performance vs. RP Max Drawdown, Major Fed Tightenings Since 1972

Source: US Treasury, Fed Reserve Economic Data, Nasdaq Data Link, Hedgewise. RP Max performance based on a hypothetical model that relies on the same algorithm used in live client portfolios through 1994. 2018 and Current data based on an average of live client portfolios at the Max risk level and include all costs and fees. Index data based on publicly available index or asset price information and all dividend or coupon payments are included and assumed to be reinvested monthly. See full disclosures at end of article.

Before this year, stocks and bonds had an average combined 16% loss during these events, and the Risk Parity "Max" strategy had an average drawdown of 19%. In 2022, stocks and bonds have already exceeded the combined loss of all prior events, but the Risk Parity drawdown is the minimum observed.

It is expected that one or many assets will rally sharply following any of these periods, even though it is difficult to predict which one. Bonds will usually rally in a recession, gold will rally if inflation persists, and equities will rally in a soft landing. The following graph shows the subsequent 3 month return across various assets after all the prior events (current datapoint excluded).

Subsequent 3 Month Asset Returns After Prior Events

See prior disclosure.

There has been a major rally in one or more asset classes within 3 months of every event, though it is often different depending on the outcome. In 1974, bonds and gold rallied during an ensuing recession. Commodities did well in 1978 when inflation failed to come under control. Bonds and equities rallied together in the soft landing of 1994. From a Hedgewise perspective, this is all fine! You can see this in how the Risk Parity Max strategy fared alongside these recoveries.

Subsequent Risk Parity Max Returns After Prior Events, Various Timeframes

See prior disclosure.

Whatever the outcome, Hedgewise recovered strongly and quickly, and I expect that to eventually be the case this time as well. The only tricky question is whether we have reached the bottom yet in 2022. We are already well outside historical precedent. 1974 and 1981 were much worse years for the real economy, in many ways, yet we have already surpassed those in terms of cross-asset drawdowns. You could argue that the pandemic bubble helps explain this, but there was a similar level of financial repression in the late 60s and early 70s as well. My guess is that the confluence of the war, the China Covid situation, and inflation have contributed to an unprecedented level of uncertainty, and I doubt that can get much higher than it already is.

Fortunately, Hedgewise can fall back on a few silver linings no matter what happens next. Any additional losses, especially within bonds, will only add to the size of the expected recovery. The current drawdown is much smaller than it could have been, and this will further buffer future upside whenever it comes.

Conclusion: 2022 Is The New 1981

The focus of this article has been to provide perspective on performance as it relates to Hedgewise, but from a human angle, this has been an incredibly tough month. It has been 40 years since America has grappled with this kind of inflation, and it is mind boggling that it could even exist in this way again. That would be earth-shattering enough on its own, but we have a new war on top of it, and somehow China is still implementing lockdowns worse than Wuhan in 2020. This will go down as an incredibly rare, incredibly hard moment in history, and it really has no modern parallel for the financial chaos it has already caused.

We have all been affected by this and losing money alongside it only adds to that stress. It is natural to see markets melting down and second-guess whether you could have handled it differently. It can also feel like some of these threats are existential. Will China ever move on from Covid? Will the war in Ukraine go nuclear? Will the Fed have to raise rates to 5, or 7, or 10% before its done? These are reasonable questions and understandable fears, and they are part of the reason that markets have been so chaotic. The things we feel as individuals are affecting financial decision-makers all over the world in the same way.

There is great irony in that the closer the world feels to falling apart, the more likely it is that many asset classes are on sale. Some of these scenarios may unfold, but not all of them. Inflation will continue raging, or it will stop. A recession will come, or a soft landing. Hedgewise should do quite well as soon as the future is better known. In the meantime, there are a few silver linings if you know where to look.

Disclosure

This information does not constitute investment advice or an offer to invest or to provide management services and is subject to correction, completion and amendment without notice. Hedgewise makes no warranties and is not responsible for your use of this information or for any errors or inaccuracies resulting from your use. Hedgewise may recommend some of the investments mentioned in this article for use in its clients' portfolios. Past performance is no indicator or guarantee of future results. Investing involves risk, including the risk of loss. All performance data shown prior to the inception of each Hedgewise framework (Risk Parity in October 2014, Momentum in November 2016) is based on a hypothetical model and there is no guarantee that such performance could have been achieved in a live portfolio, which would have been affected by material factors including market liquidity, bid-ask spreads, intraday price fluctuations, instrument availability, and interest rates. Model performance data is based on publicly available index or asset price information and all dividend or coupon payments are included and assumed to be reinvested monthly. Hedgewise products have substantially different levels of volatility and exposure to separate risk factors, such as commodity prices and the use of leverage via derivatives, compared to traditional benchmarks like the S&P 500. Any comparisons to benchmarks are provided as a generic baseline for a long-term investment portfolio and do not suggest that Hedgewise products will exhibit similar characteristics. When live client data is shown, it includes all fees, commissions, and other expenses incurred during management. Only performance figures from the earliest live client accounts available or from a composite average of all client accounts are used. Other accounts managed by Hedgewise will have performed slightly differently than the numbers shown for a variety of reasons, though all accounts are managed according to the same underlying strategy model. Hedgewise relies on sophisticated algorithms which present technological risk, including data availability, system uptime and speed, coding errors, and reliance on third party vendors.

Related Posts

April 2024: An Excellent RecoveryOctober Update: Quick Perspective on Bond Volatility September 2023: When Volatility Is WelcomeMarch 2023: Mapping a 40% RecoveryOctober 2022: Good News in Surprising PlacesJuly 2022 Commentary: The Ideal DrawdownMay 2022: "Good" Losses, Bad Year2021 Year-In-Review: Inflation Brings New Opportunity October 2021: No Need to Fear Overvalued Markets May 2021 Commentary: Sorting Through Market Froth 2020 Year-In-Review: Navigating an Everything BubbleSeptember 2020 Commentary: Deconstructing the New Investment WorldRisk Parity Shines During Pandemic A Few Thoughts on the Coronavirus 2019 Year-In-Review: The Long and Short of Sustained OutperformancePerspective on 2019 Performance: An Excellent, Ho-Hum RecoveryThe Anatomy of Momentum: Why the Strategy Works, and How to Play the Odds2018 Year-In-Review: This Too Shall PassOctober 2018: Better Times AheadSeptember 2018: Amidst Volatile Markets, Hedgewise Leads the Pack Best-In-Class Risk Parity PerformanceCan You Time Risk-Managed Strategies? February 2018: Why Not to Panic When Markets Go CrazyHow to Link an Existing Interactive Brokers AccountAnalyzing Hedgewise 2017 Performance: Benchmarks, Timeframes, Theory and ProofQ3 Update: Hedgewise Outperforming Every Asset Class in 2017Understanding the Theory Behind Better ReturnsApril 2017: A Great Start to the Year2016 Year In Review: Hedgewise OutperformedHedgewise Systematically Avoids Bond CorrectionNovember Commentary: Election Risk Is Just Like Any Other Risk, And It Is Being ManagedHow to Open An AccountHow to Create Leverage Using Options ContractsHedgewise Outperforming Every Major Risk Parity Mutual Fund in 2016What's Next for Risk Parity? 2016 Hedgewise Midyear Report: Choppy Markets, Big ReturnsThe Right Way To Invest In Oil Rising Interest Rates And Risk ParityThe Right Time to Buy Oil in 2016The Wrong Way To Invest In OilRisk Parity Outperforming the S&P 500 by 7% in 2016Risk Parity: Year-In-Review and 2016 OutlookWho We AreHow It Works: Faster, Cheaper, and More EfficientOur CustodianFeesWhy Commodities are the Smart Play for 2016Retirement Investing in a Rising Interest Rate EnvironmentComparing Hedgewise Risk Parity to the Competition Improvements to our Risk ModelSeptember 2015: Risk Parity Limits Losses, and the Upside of FearAugust 2015: Perspective on the Commodity CrashIs Gasoline the Smart Oil Play? (UGA vs. USO) 2015 Mid-Year Review: Understanding Unbalanced MarketsNavigating the Bond Market CorrectionFeeling Good About A Down MarketNew Account Set-Up - InvitationThe Optimal Gold Investment Strategy (Switching Between DGL and GLD)How Hedgewise Saved You Taxes in 2014This Is Why You Are Still Diversifying WrongThis Is Why You Are Diversifying WrongRisk Parity: What It Is, How It Works, and Why It MattersThe Financial Revolution Has Begun: 5 Bold Predictions for the Next DecadeMust Bond Investors Fear Rising Interest Rates? Insights From 1958 To 1982 The Oil Futures Curve Reversal: What You Need to Know5 Reasons Why You Should Be Afraid of a Bear Market, and How to Protect Your PortfolioHow to Invest in Oil for the Long Term, Avoiding Contango and Tracking ErrorHedgewise FAQTax Optimization and Tax Harvesting