


Summary
- In 2021, Hedgewise has gained 2.5% - 9% (depending on your risk level), keeping up with the performance of the S&P 500 despite its torrent pace and without overexposing clients to a potential equity pullback.
- This performance is especially remarkable compared to bonds, which have lost 10% this year and nearly 30% since last March.
- Though stocks have performed well in 2021, there remains a significant amount of market "froth". Pockets of excessive speculation have already begun to unwind, with many Covid-era favorites down 20 - 40% from their peak in February.
- Inflation is a real threat to market valuations because even a slight normalization could justify a 15 - 20% correction to the S&P 500. There is a high probability that rates will return above 2%, but this is not reflected in current equity prices. The Fed may be erring by allowing the economy to run too hot, which is causing labor shortages and supply disruptions.
- Hedgewise provides a unique haven for its clients by relieving any need to decipher these risks. As we near the tail-end of the Covid crisis and its aftermath, this approach will likely outperform most alternatives.
Introduction: Is There a Bubble or Not?
The chaos of the past year makes it hard to hold on to a consistent narrative. The event itself was terrible, but the economic outcome might be good? Or the economic outcome is bad, but the investing outcome is good? The reality is complex, and there are competing narratives unfolding in parallel.
As previously examined, the combination of enormous fiscal and central bank stimulus has been a primary driver of asset prices over the past year. A single observation sums this up nicely: the S&P 500 is expected to realize earnings in 2021 about 4% higher than what was expected in January 2020, before any of us saw Covid coming. The price of the S&P 500 is now ~30% higher than it was back then. Can both prices be rational at once?
The confounding factors include the impact of near-zero interest rates, government stimulus checks, unemployment benefits, the vaccine and re-opening cadence, and an explosion of speculation. In some segments of the market, this led to definitive bubbles, and many of those have begun to correct. The S&P 500 is more difficult to decipher because of deeper crosscurrents.
The US recovery has been faster than expected this year, with 2021 Q1 earnings beating estimates by over 8%, and this alone has driven most of the YTD gain. Alongside, long-term interest rates have reverted to where they were in January 2020, but there has been little correction of price-earnings multiples to adjust. This latter inconsistency is difficult to reconcile and helps to explain the volatility in equities happening recently. The economy has been snapping back faster than expected, but prevailing prices were anchored to unrealistic interest rate assumptions to begin with.
This "frothiness" will probably continue to unwind, and inflationary pressure is the most likely catalyst. Investors are noticing that a "hot" economy comes with drawbacks, and that higher rates may be both necessary and healthy. In a great final irony, the last act of Covid may be how the return of a balanced, productive economy is directly at odds with inflated asset prices.
If this makes your head spin, take comfort that the Hedgewise approach sidesteps these concerns and is in an excellent position to outperform during this potential unwinding. The strategy is built to withstand any economic environment, and it already anticipates the impact of high inflation, rising rates, or whatever comes in between.
Analyzing Recent Hedgewise Performance
Here is a quick look at how the Risk Parity Max strategy has performed against other major asset classes so far in 2021.
Performance of Risk Parity Max vs. Major Asset Classes, 2021 YTD
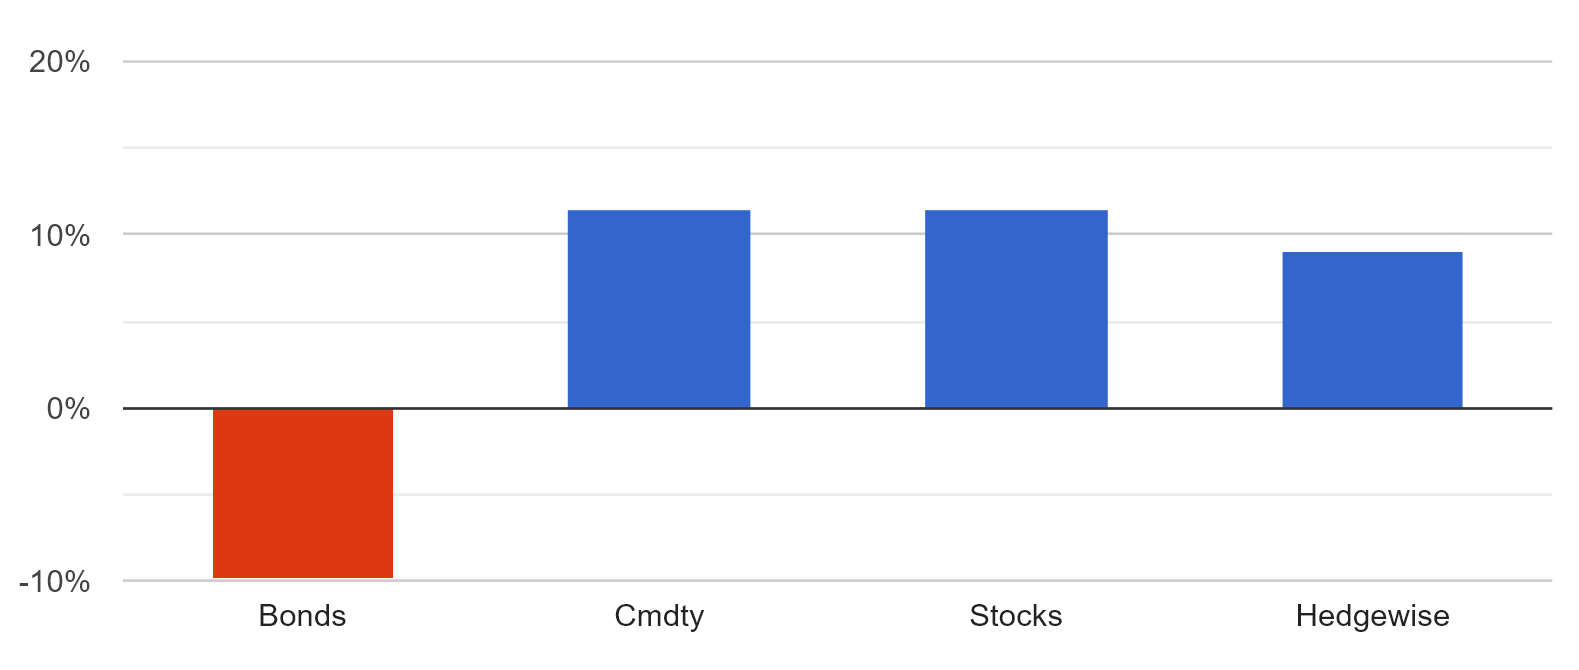
Hedgewise has kept up with the S&P 500 despite its excellent performance and the worst start of the year for bonds in decades. While I've published prior research on how Hedgewise manages the risk of higher interest rates, it is still remarkable to see it go precisely according to plan. Risk Parity is often misconstrued as a bond-heavy strategy, but this period firmly refutes that notion.
Widening the perspective to a longer timeframe reinforces how little correlation Hedgewise performance has with bonds, and how Risk Parity has firmly outperformed that asset class over the past half decade.
Performance of 30yr Treasury Bonds vs. Risk Parity Max, January 2016 to Present
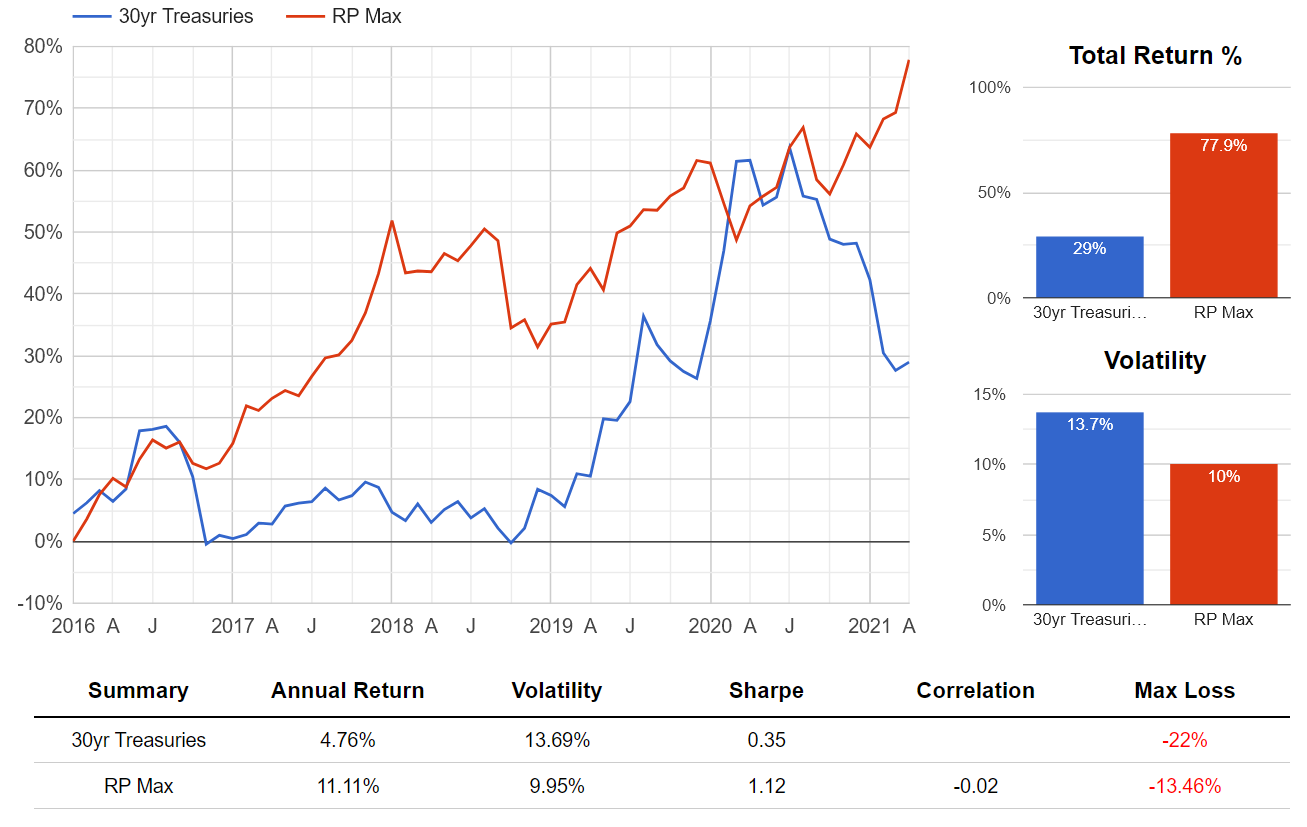
Bonds have done quite well since 2016, yielding almost 5% per year, and had a huge spike during the pandemic. That was only sufficient to catch up with Hedgewise, and performance has since regressed with the economic recovery. Risk Parity has exhibited lower volatility, lower drawdowns, and higher returns throughout. This is possible despite bonds having typically been a substantial portion of the Hedgewise portfolio, often at weights of 50% or above. Intelligent use of risk management and diversification transforms a portfolio into something greater than the sum of its parts. Viewed as an alternative "safe" investment to long-term bonds, Hedgewise has demonstrated itself as a consistently superior option.
This story is easy to tell over long stretches of time in which the performance of every asset class has ebbs and flows. It is harder to isolate the benefits for a time period when a single asset class is surging, as the S&P 500 has done recently.
Performance of S&P 500 vs. Risk Parity Max, January 2016 to Present
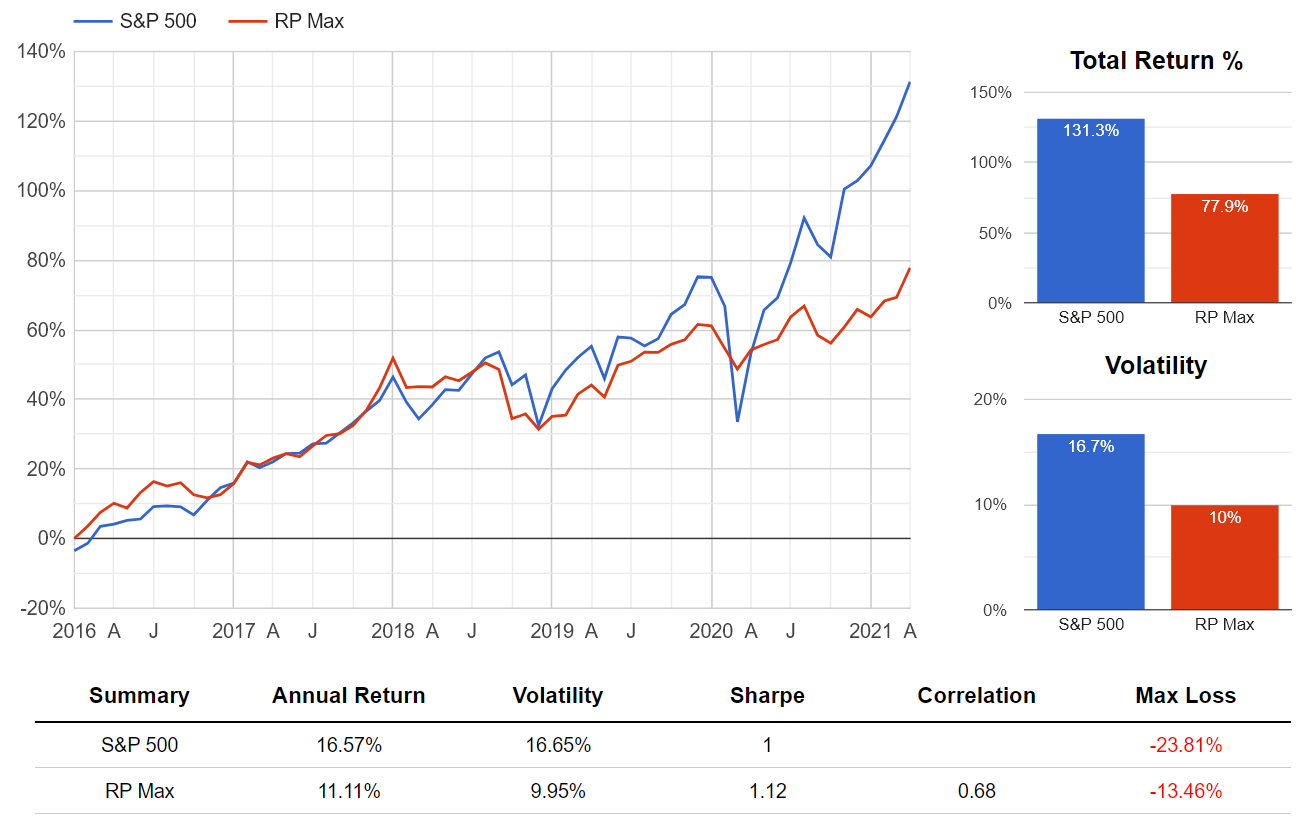
The missing caveat is that Risk Parity Max is built to target half the overall risk of equities, with the expectation that level can still match or beat stocks over most long-term time horizons. To fairly compare performance, especially over shorter timeframes, both strategies should be set to an equivalent level of risk. The following simulates the Risk Parity strategy set to a similar level of volatility as the S&P 500 during this period (named "RP Max+2").
Performance of S&P 500 vs. Risk Parity Max+2, January 2016 to Present
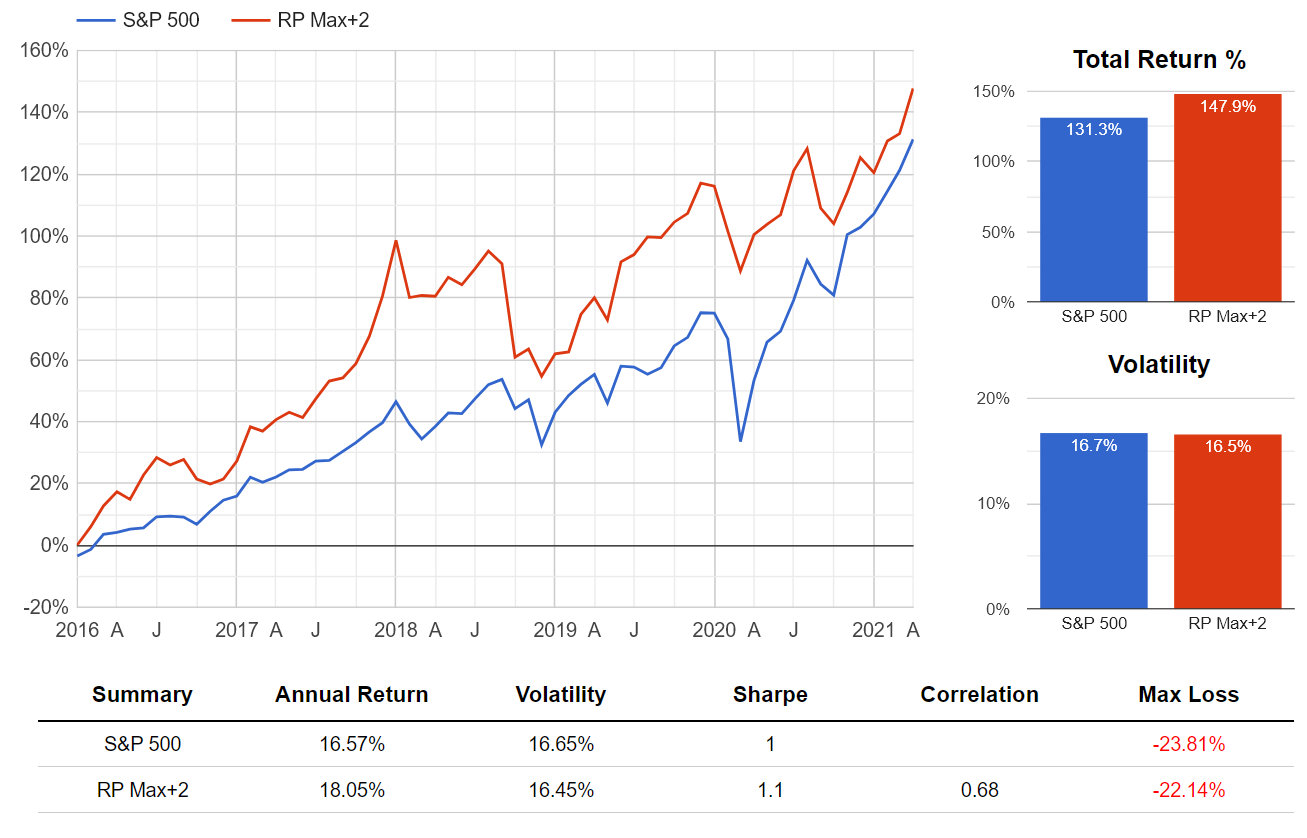
A Risk Parity portfolio exhibiting nearly identical levels of volatility and drawdown to the S&P 500 has still outperformed it since 2016. Over this stretch, stocks gained over 16% annually and avoided any lasting pullback, market whipsaws dragged on risk-managed performance, and elevated volatility muted Hedgewise participation in the pandemic recovery. None of this has been enough to handicap the strategy relative to equities when compared on an equal basis.
While these results look tempting, remember that the Hedgewise portfolio is designed to outperform stocks over longer-term horizons and to minimize the risk of loss. Whenever stocks next encounter a sustained pullback, Hedgewise should even further differentiate itself because of the strategy's diverse construction. This can be more easily understood by breaking down the source of returns in 2021.
Hedgewise Return Contribution by Asset Class, January to May 1, 2021
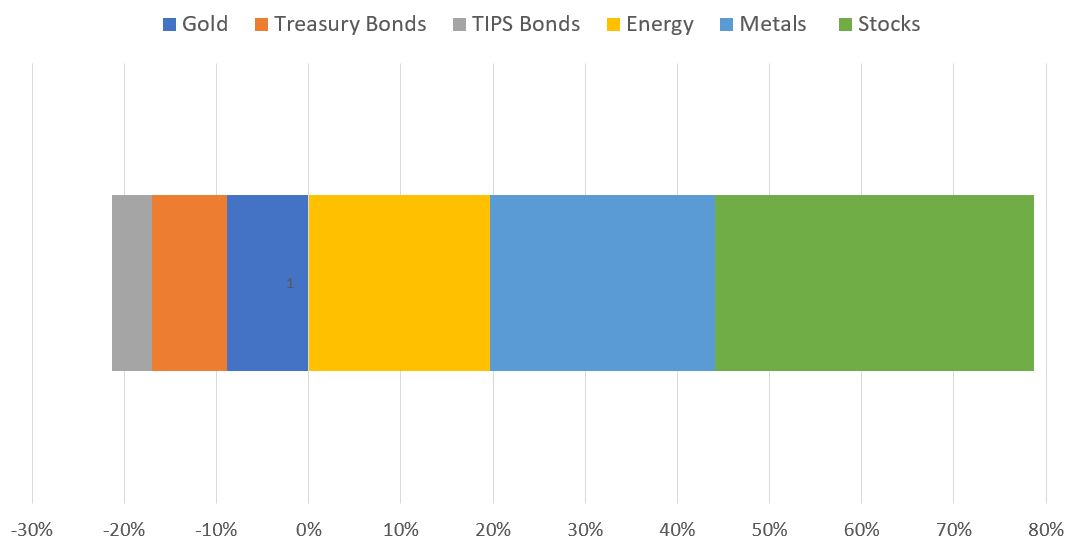
Gains in 2021 have been driven by a nearly equal mix of energy, industrial metals, and stocks. Meanwhile, losses in the bond market have been mitigated using the risk management techniques discussed previously. Should stocks switch places with bonds next, the portfolio's resilience will persist.
The takeaway is that Risk Parity has functioned as expected this year and throughout the pandemic. The outlier has been the rapid appreciation in equities and other speculative pockets, which has exacerbated a trend of excessive risk-taking. Much of this is already unwinding with the economic re-opening, and highlighting the inherent dangers of joining in.
Understanding and Navigating Market Froth
The investing story of the pandemic is easiest to understand at the extremes. A flood of money hit the market last year through the Fed and government stimulus, and eventually combined with new financial technology and bored stay-at-home traders to create a tsunami of speculation. Price appreciation eventually snowballed on itself and became disconnected from any real narrative of the economy. Meme stocks and cryptocurrencies are probably the best examples of this, but there have been many other themes, including stay-at-home beneficiaries, high growth stocks, the re-opening trade, SPACs, IPOs, and others.
We have reached a point where these can be clearly labeled bubbles.
Performance of Popular Covid Trades, February 8, 2021 to Present
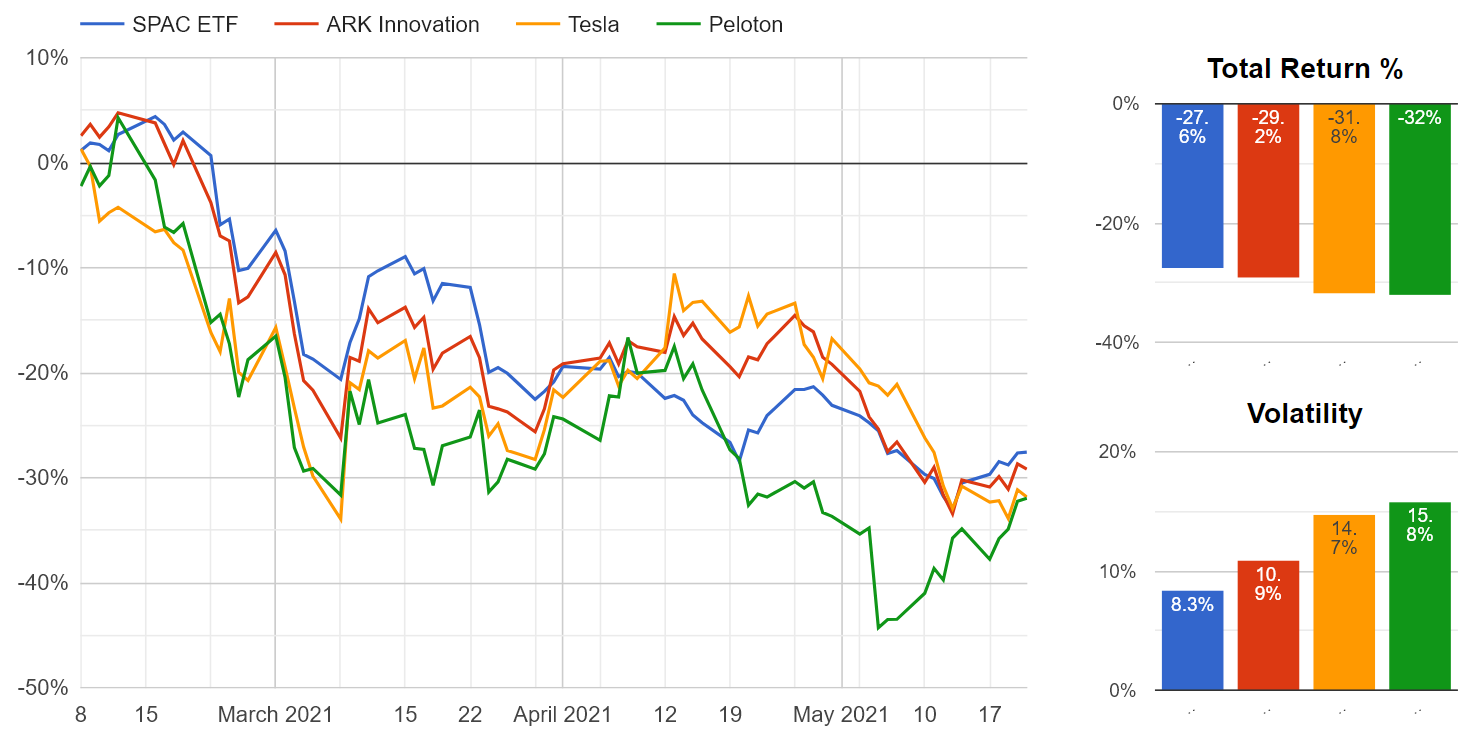
This is meaningful to observe because it dispels the notion that perhaps the appreciation has been reasonable. Bubbles have absolutely been a part of the story, and there have already been serious losses for those who invested recently. Many of these companies remain up 100% or more compared to last January despite this correction, suggesting additional downside is likely.
This extreme view helps to introduce what is happening in the S&P 500 more broadly. Many of these individual companies are part of the index, so there is some direct crossover. The bigger impact comes from a general lift of stock valuations across the board on a relative basis. This "frothy" spillover effect is not large enough to form an outright bubble, but it is having a measurable impact.
The obvious way to examine this is with price-earnings multiples. The best analytical case for elevated valuations is that low interest rates justify higher prices. You can get a sense of how this trade-off works by modeling a few back of the envelope assumptions. The following table shows what different interest rates imply as a "fair" P/E multiple, the associated "fair" price of the S&P 500, and how that compares with the actual market price today.
| Interest Rate | Model P/E | Model Price | Vs. Current |
|---|---|---|---|
| 1.65% | 21.5 | $3,947 | -5% |
| 2% | 20.0 | $3,670 | -12% |
| 2.5% | 18.2 | $3,337 | -20% |
Currently, 10yr Treasury bonds are hovering close to 1.65%, while 30yr bonds yield closer to 2.5%. Depending on which one you think is the fair interest rate to apply to stock valuations, the S&P 500 is somewhere between 5% and 20% overvalued.
Part of the reason this persists is because the Fed is keeping short-term rates at 0%. Until these come off the ground, prices lack a catalyst to forces revaluation. Inflation is the most likely driver of this, and the market is grappling with whether the Fed will have to act to control it.
In an overheating economy, rising prices come from a shortage of raw materials, labor, and transportation. This slows down production everywhere, and sudden price jumps in staple goods impact the livelihood of families whose income has yet to catch up. This is a "bad" kind of inflation that causes real suffering.
The Fed appears content to tolerate this for the sake of a robust Covid recovery, but the market is seeing that it might be too much, too fast. For example, lumber prices have jumped over 300% in the past year. This creates scarcity across the construction market with no positive spillovers; it may even reduce hiring because firms cannot get the supplies they need to do their work.
The economy will be better off when it returns to a moderate pace in which 2% - 2.5% interest rates are necessary and a sign of health. If it overheats first and rates jump quickly, an equity correction is likely. If it gets there more slowly, prices could bounce around for a year or two until earnings fully catch-up with valuations. Either way this froth will present a headwind until it resolves.
The question is what this all means to you as an investor.
Does It Matter to Your Portfolio?
The answer depends on what kind of investor you are, and what adjustments you made over the course of the pandemic. For Hedgewise clients, none of this requires action or concern. Risk Parity can weather a 20% stock correction just like it weathered the recent bond crash. Avoid the temptation to shift your risk level or portfolio mix in response to this speculative mania. Performance tends to even out over time without the need for excessive risk-taking.
For pure equity investors, a long-term passive allocation remains reasonable despite the current froth. Over 15 years, this probably will not matter much. Periods of muted returns or corrections should be part of the expectation. However, if you do not have the risk tolerance or time horizon for such losses, or you had participated more actively in the speculation of the past year, now may be an excellent time to unwind those bets.
On balance, the competing narratives of the pandemic will settle somewhere between the economic recovery being faster than expected and speculators getting too far ahead of themselves regardless. The pace of inflation will be the key to how it resolves, and the Fed may contribute to unnecessary collateral damage if it waits too long to raise rates to more normal levels. Risk Parity is well positioned for such an environment because of its mix of inflation-sensitive assets and its ability to navigate corrections, as recently witnessed in the bond market. The froth in equities cannot last forever, but that story is only meaningful if you have constructed your portfolio around it.
Disclosure
This information does not constitute investment advice or an offer to invest or to provide management services and is subject to correction, completion and amendment without notice. Hedgewise makes no warranties and is not responsible for your use of this information or for any errors or inaccuracies resulting from your use. Hedgewise may recommend some of the investments mentioned in this article for use in its clients' portfolios. Past performance is no indicator or guarantee of future results. Investing involves risk, including the risk of loss. All performance data shown prior to the inception of each Hedgewise framework (Risk Parity in October 2014, Momentum in November 2016) is based on a hypothetical model and there is no guarantee that such performance could have been achieved in a live portfolio, which would have been affected by material factors including market liquidity, bid-ask spreads, intraday price fluctuations, instrument availability, and interest rates. Model performance data is based on publicly available index or asset price information and all dividend or coupon payments are included and assumed to be reinvested monthly. Hedgewise products have substantially different levels of volatility and exposure to separate risk factors, such as commodity prices and the use of leverage via derivatives, compared to traditional benchmarks like the S&P 500. Any comparisons to benchmarks are provided as a generic baseline for a long-term investment portfolio and do not suggest that Hedgewise products will exhibit similar characteristics. When live client data is shown, it includes all fees, commissions, and other expenses incurred during management. Only performance figures from the earliest live client accounts available or from a composite average of all client accounts are used. Other accounts managed by Hedgewise will have performed slightly differently than the numbers shown for a variety of reasons, though all accounts are managed according to the same underlying strategy model. Hedgewise relies on sophisticated algorithms which present technological risk, including data availability, system uptime and speed, coding errors, and reliance on third party vendors.