


Summary
- 2021 was another great year for Hedgewise, as it successfully navigated rising bond yields and outperformed all major Risk Parity alternatives.
- Despite the rocky start to 2022, there are many indications that Hedgewise risk management techniques have been working effectively.
- As interest rates normalize, it will likely open further opportunity for Hedgewise to outperform despite volatility in equities.
Introduction: Understanding the Start of 2022
The individual narratives of the past two years (Covid, interest rates, government stimulus, and meme stocks, among others) have obscured the simple but slow-motion story playing out beneath the surface. The Fed brought interest rates as low as it possibly could in response to a crisis, which logically fueled bubble-like asset prices and speculative mania. In 2021, markets eagerly assumed that this was sustainable, a belief which was encouraged by the Fed's assertion that inflation was transitory and that it would leave rates lower for longer. Over the past month, it has become clearer that the Fed was mistaken, but markets are still deciphering the size of the mistake and how it will be unwound.
This uncertainty is driving recent market volatility, which is in line with the expectations set out in earlier market commentary. As a quick refresher, Hedgewise summarized this likely narrative all the way back in September 2020 with the following illustration, which shows how artificially low interest rates change return expectations over time. The blue line is the "normal" state of markets with rates above 2%. The orange line is the "expected" behavior after rates hit zero, and the yellow line is what may happen at the extremes.
How Passive Expected Total Returns Change Over Time with Zero Interest Rates
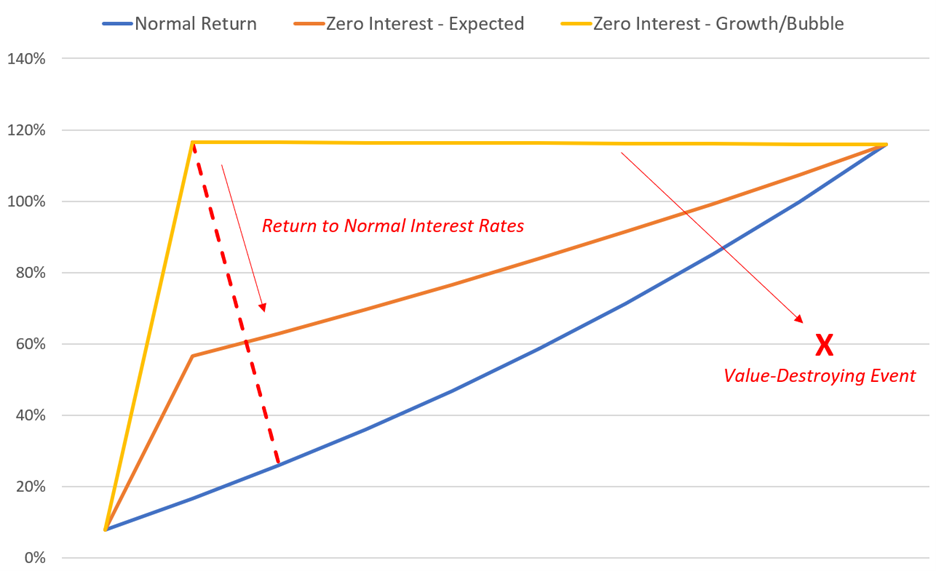
The 'frothy' segments of the market were likely hovering around the yellow line, while the S&P 500 was somewhere closer to the orange one. This month, we are traversing down the first dotted red line as markets digest the possibility that interest rates may need to settle much higher than assumed. For traditional passive investors, this presents a conundrum: you either go along for the ride, which will involve big initial gains followed by mediocre returns at best or significant losses at worst, or you try to time it but risk getting out too early or too late. This isn't a very compelling option set, but the good news is that Hedgewise is built to sidestep it. 2022 presents an excellent opportunity to showcase this in action, and the benefits of the approach can already be seen with the right perspective.
Unpacking Recent Hedgewise Performance
A counterintuitive aspect to risk-managed investing is how short-term losses can be viewed positively in the bigger picture. For example, if a 1% loss significantly increased the chance of an eventual 5% gain, that is a great trade-off. The Fed's response to the pandemic has amplified this dynamic in very specific ways, the most easily of which applies to the bond market.
Bonds are unique because the Fed can force a 'bubble' by pushing interest rates to zero and buying trillions of dollars of securities through quantitative easing. This is how aberrations like negative real yields can persist, which guarantee a long-term loss on a bond investment. Such a performance profile lines up very nicely with the yellow 'growth/bubble' line on the prior illustration.
Since it is easier to observe and predict this kind of bubble, it can also be taken advantage of by reducing bond exposure as interest rates get closer to zero and vice versa. Hedgewise discussed its theoretical approach to this in an earlier article, but 2021 presented an excellent live test. The following graph compares a passive investment in long-term Treasury bonds to the approach used in the Hedgewise Risk Parity "Max" portfolio (i.e., this shows the return of a 100% investment in 30yr Treasury bonds compared to the performance driven by the monthly percentage weighting in the Hedgewise RP Max strategy).
Performance of Passive Bond Investment in 30yr Treasuries vs. Hedgewise Approach, 2021
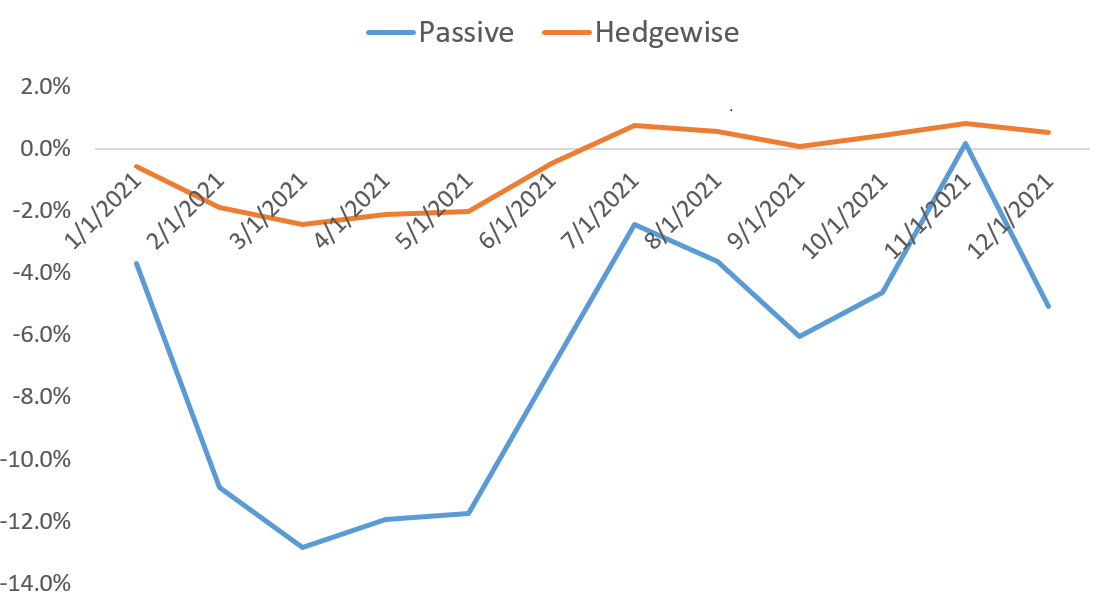
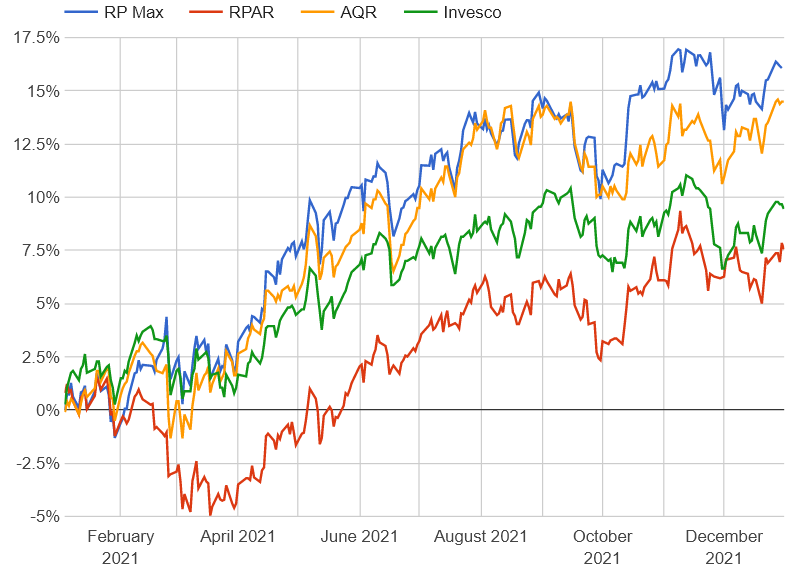
Hedgewise effectively converted a net 5% loss in Treasury bonds into a 1% gain last year. This outcome played a key role in allowing Hedgewise to outperform all major public Risk Parity alternatives in 2021.
Performance of Hedgewise Risk Parity vs. Major Public Alternatives, 2021
While this is a nice validation of Hedgewise risk management techniques, 2022 will likely present an even greater opportunity to demonstrate their effectiveness. Counterintuitively, the potential for gain increases with volatility and as bond yields move higher. For example, the following simulation shows how bonds would be expected to affect the Hedgewise portfolio if interest rates moved all the way up to 4% over the next 18 months before settling at 2.5% in 3 years.
30 Year Bond Performance Impact Simulation: Passive vs. Hedgewise, 3 Year Period
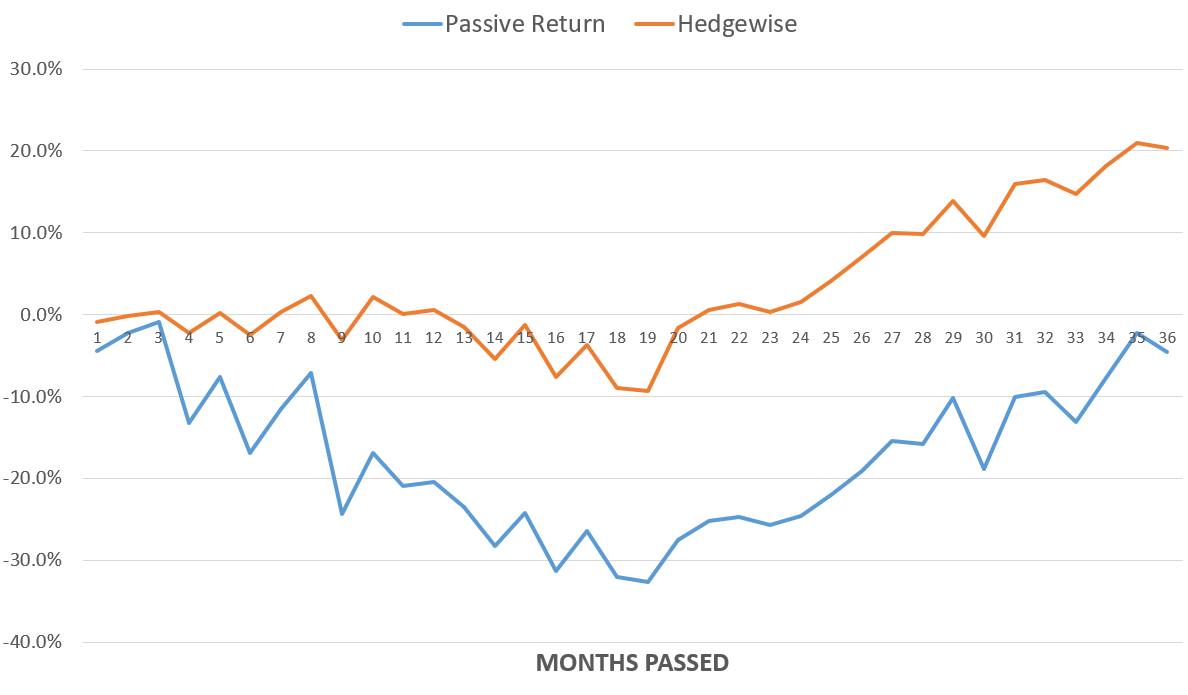
In this scenario, bonds would boost the Hedgewise portfolio by an average of 6% annually despite a slight overall loss for a passive investment. However, this does require 'looking past' the initial 10% drawdown with a focus on the relative total opportunity rather than absolute point-in-time performance.
This context will help to make greater sense of 2022, as rising interest rates should be a boon to Hedgewise even if volatility and small drawdowns are a natural part of the picture.
Analyzing the Rocky Start to 2022
Here is a quick look at how Hedgewise has performed against the major asset classes as of January 24, 2022.
Performance of Major Asset Classes vs. Risk Parity "Max", 2022 YTD
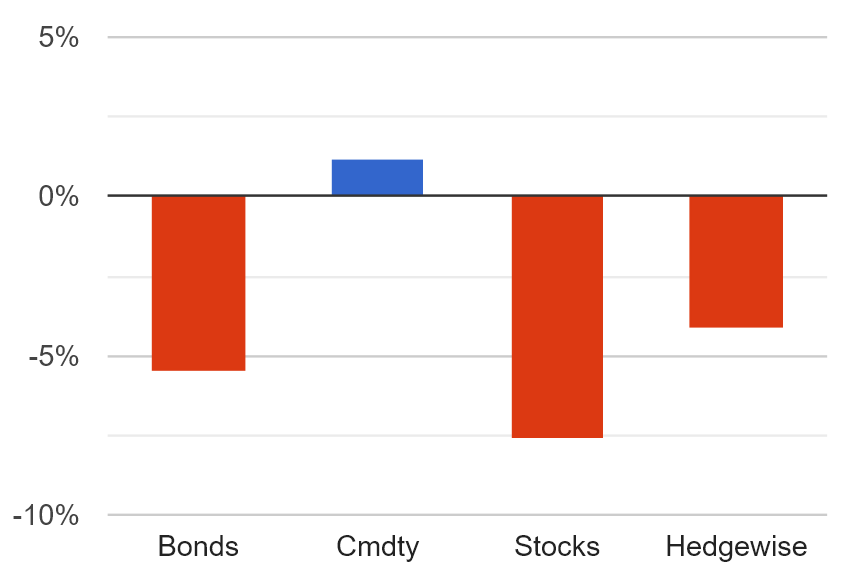
Hedgewise is down about 4.4% at the Max risk level, while equities have lost 7.6% and bonds have lost 5.4%. Intuitively this seems like a reasonable outcome, but it is still difficult to sustain losses and it is natural to wonder whether this could have been improved.
A deeper dive into historical data reveals how this first impression is deceiving. Since 1970, there have only been three other months in history (!) when stocks have lost 5% or more, bonds have lost 2% or more, and gold has failed to rally. The following graph shows the performance of the RP Max model portfolio in each of these months, alongside how it did relative to the S&P 500. The result in this current month has been highlighted for comparison.
Historical Performance of RP Max Model Portfolio in Similar Months to January 2022
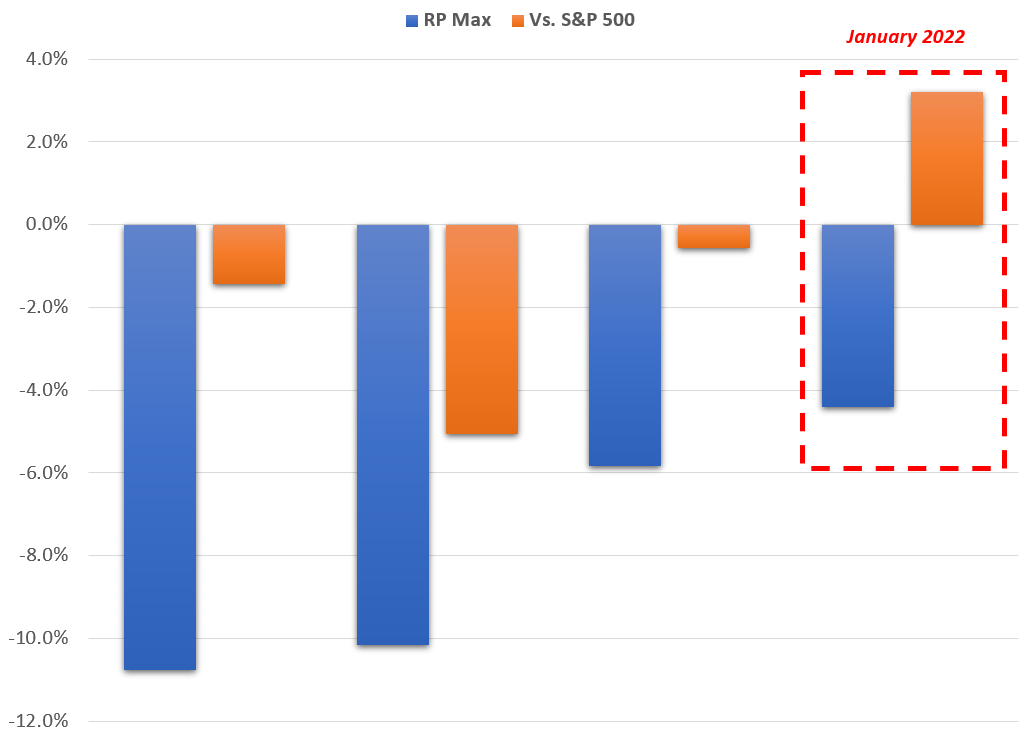
Outside of the current month, the model lost 9% on average, and did 2% worse than equities. In January, the live portfolio has lost 4.4% while outperforming equities by over 3%. This highlights a few neat points.
First, this has been a historically extreme month. All the other data points occurred in the 1970s, and it is no coincidence that is the last time inflation was a major problem. That said, inflation reached well over 10% in that decade, but you still only had three months as bad as what just happened in January. There's strong reason to expect this will be near the worst of the year, especially from a cross-asset perspective.
Second, it is remarkable to have a loss of only 4% given the circumstances, and this reflects the power of neutralizing the risk of rising interest rates.
Finally, the further that rates travel above 2%, the more potential benefits accrue to the portfolio as bonds return closer to normal historical weights. If stocks have further to fall, bonds should provide a more powerful source of diversification. The yield itself is higher, which very directly increases the financial benefit of holding bonds. And as discussed earlier, bond volatility itself can provide an alternative means of gain that is independent of passive returns.
The more serious a threat inflation becomes, the more likely that these benefits will be amplified. While the losses of this month may be uncomfortable, these broader implications are welcome.
You may be wondering why I haven't spoken much about equities yet, but there's a good reason for that. From a Risk Parity perspective, if you can neutralize the impact of rising interest rates in an otherwise inflationary environment, you get a recipe for mostly positive outcomes regardless of what stocks wind up doing.
Why Not to Worry About Stocks
The funny thing about risk management is that it is much easier to see how effective it is when markets are having problems. Equities have had an incredible run on the back of the Fed's artificially low interest rates, but it was inevitable that it would end sometime and Hedgewise is well-prepared for it.
Hedgewise has multiple levers for managing drawdown risk in any given asset class. Equity exposure is not particularly high this month from a historical perspective, and that will continue to adjust as market risk changes. Other asset classes, especially metals like gold and copper, are also likely to provide effective protection against scenarios like a recession or stagflation. In many ways, the Fed had repressed the utility of these levers by keeping interest rates artificially low for so long, and it will be a positive development to see more natural market behavior return.
The current environment is reminiscent of the mid-1970s, though inflation probably won't peak nearly as high as it did then. The Fed kept rates too low in the late 60s, and stocks were the only game in town for many years. This led to a very tumultuous decade for equities once inflation became a problem in 1973, but the Hedgewise Risk Parity model was relatively unaffected.
Annual Performance of S&P 500 vs. RP Max, 1973 to 1981
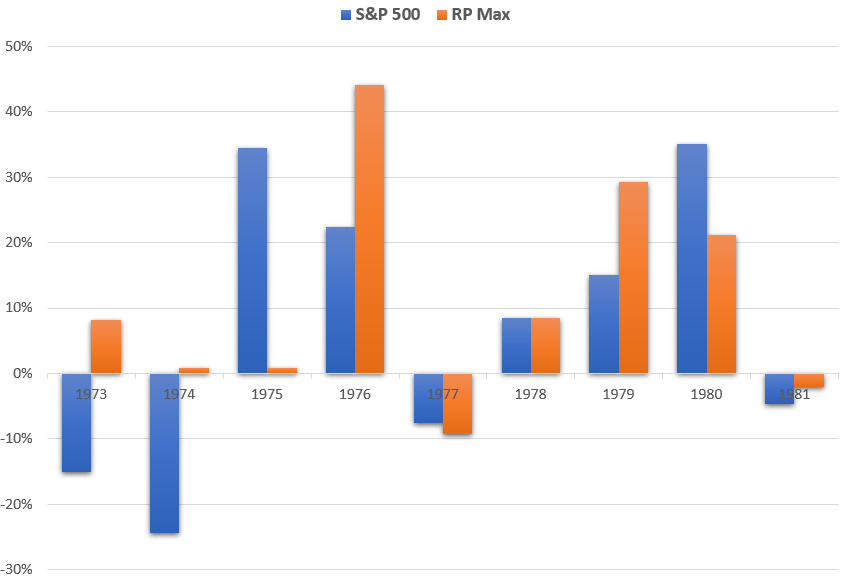
There were still plenty of drawdowns in this timeframe, but that is expected. The more important points were how uncorrelated those losses were to the stock market, and that the strategy produced a better risk-adjusted return over time.
Cumulative Performance of S&P 500 vs. RP Max, 1973 to 1981
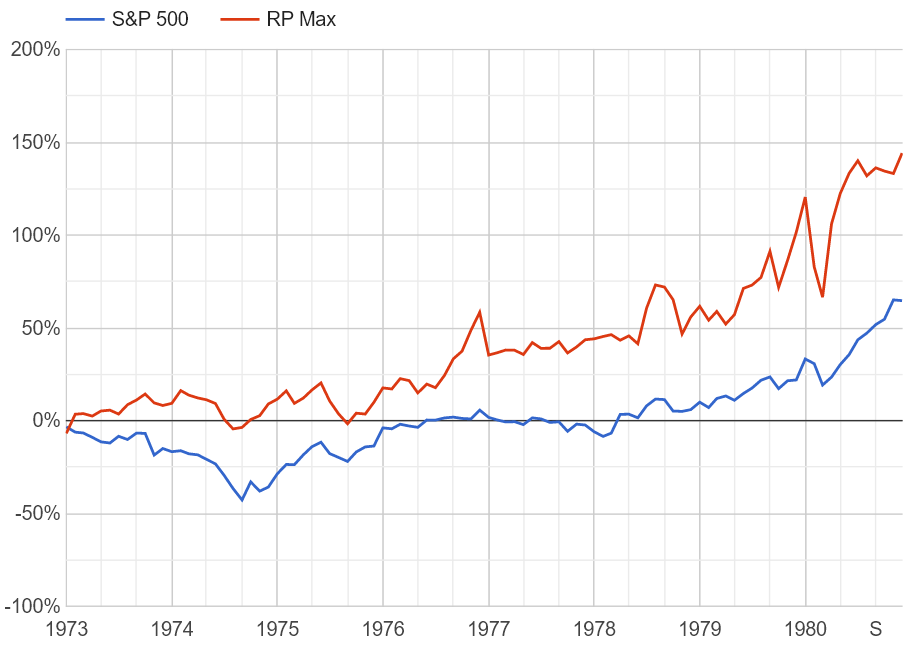
In the present day, there's even greater reason for optimism because of how Hedgewise can effectively neutralize the current risk of rising rates. Taking this into account, drawdowns should be even more moderate and infrequent than they were in the 1970s. The normalization of interest rates should allow bonds, gold, and commodities to play a much more significant and healthier balance in the portfolio than has been possible in this strange pandemic era.
Wrapping Up
From an investment perspective, it is likely that the 'boom' times are over, that volatility and uncertainty will increase, and that outcomes like a recession or stagflation are possible. This will be unfamiliar for many market participants since inflation has not been a problem for nearly five decades, and it is difficult to comprehend a Fed which has 'lost control' of the situation. Fortunately, these are the kinds of circumstances for which Hedgewise Risk Parity was built.
Disclosure
This information does not constitute investment advice or an offer to invest or to provide management services and is subject to correction, completion and amendment without notice. Hedgewise makes no warranties and is not responsible for your use of this information or for any errors or inaccuracies resulting from your use. Hedgewise may recommend some of the investments mentioned in this article for use in its clients' portfolios. Past performance is no indicator or guarantee of future results. Investing involves risk, including the risk of loss. All performance data shown prior to the inception of each Hedgewise framework (Risk Parity in October 2014, Momentum in November 2016) is based on a hypothetical model and there is no guarantee that such performance could have been achieved in a live portfolio, which would have been affected by material factors including market liquidity, bid-ask spreads, intraday price fluctuations, instrument availability, and interest rates. Model performance data is based on publicly available index or asset price information and all dividend or coupon payments are included and assumed to be reinvested monthly. Hedgewise products have substantially different levels of volatility and exposure to separate risk factors, such as commodity prices and the use of leverage via derivatives, compared to traditional benchmarks like the S&P 500. Any comparisons to benchmarks are provided as a generic baseline for a long-term investment portfolio and do not suggest that Hedgewise products will exhibit similar characteristics. When live client data is shown, it includes all fees, commissions, and other expenses incurred during management. Only performance figures from the earliest live client accounts available or from a composite average of all client accounts are used. Other accounts managed by Hedgewise will have performed slightly differently than the numbers shown for a variety of reasons, though all accounts are managed according to the same underlying strategy model. Hedgewise relies on sophisticated algorithms which present technological risk, including data availability, system uptime and speed, coding errors, and reliance on third party vendors.