


Summary
- 2022 has been one of the worst years in the last century for financial markets, but it has provided a huge opportunity for Hedgewise to benefit from its risk management techniques.
- Compared to passive Risk Parity benchmarks, Hedgewise has outperformed by 15% to 20% YTD (at the RP Max risk level), which is among its best years ever from a relative perspective.
- It is difficult to appreciate this outcome so long as the current drawdown persists, but the medium-term outlook is already substantially better than it was in January, present losses included.
Introduction: Yes, This Has Been Crazy
What has happened to financial markets so far this year has been extreme. Not just once-in-a-decade event extreme, not just another financial crisis or pandemic extreme, but worst-in-measurable-history extreme. As Bloomberg noted a couple weeks ago, "Worldwide government bond markets are on course for the worst year since 1949, when Europe was rebuilding from the ruins of World War Two." If you've been feeling confused, shocked, or incredulous about markets for the past few months, that would make perfect sense.
This context is important because as portfolio losses accrue, it is challenging to keep perspective and avoid second-guessing. A 20% loss might be hard to differentiate from 30% despite being a much better outcome. As asset prices drop, it can feel terrible even if you have room to add exposure at much more attractive entry points. You may lose interest in relative performance and future opportunity and prefer to just stop losing money. This year is more likely to be conjuring up such feelings than any time in modern history.
And yet, if you can briefly suspend disbelief, 2022 has been a great year for Hedgewise. With near minimum levels of exposure across most asset classes, Hedgewise has substantially reduced its drawdown while simultaneously improving expected future returns. On a relative basis, September was one of the best single months ever. The three-to-five-year outlook is better now than it was at the market peak in January - really! - and all of this can be shown precisely.
To understand how this could be true, it is useful to provide context for how exceptional markets in 2022 have been.
No Historical Comparison
Many have compared this year to the late 1970s, when Paul Volcker aggressively raised interest rates to slay a decade of inflation. But in terms of tightening financial conditions and asset performance, this has already been much worse.
For example, long-term bonds have now lost over 30% this year alone, with a total drawdown over 40% since July 2020. Going back to 1972 (the earliest that good data was available), here are all the instances when bonds have lost 20% or more.
History of Bond Drawdowns Over 20%
| Date Range | Max Drawdown |
|---|---|
| June 79 to Sept 81 | -23.4% |
| Dec 08 to May 09 | -26.0% |
| July 20 to Present | -43.6% |
The datapoint from 2008 is mostly a red herring: rates went from 4.3% in November 2008 to 2.8% in December, as the financial system nearly collapsed, and then completed a round-trip back to 4.3% when the crisis was avoided. This was not a tightening of financial conditions and had little to do with the Fed. The experience in 1979 is more instructive, as 30yr rates went from 8% all the way to 15%, but on a relative basis, this was still much less painful than what is happening today.
The sheer scale and speed of this event has made it much harder than usual to sort through. For example, if bonds lost 10% in a single year, and you lost nothing, that would be a great outcome. But this year, the same relative performance would mean you lost 33% instead of 43%. It is challenging to treat these as two equally good outcomes.
The tricky part is differentiating between simple drawdown reduction and the ability to generate new gains. Losing 33% instead of 43% may be insubstantial if both portfolios return to the same level after a recovery, but it is more powerful if it can be translated into a permanent 10% advantage.
This dynamic is exactly what Hedgewise is optimizing for in a year like this one, and any loss reduction is likely to mirror future potential gain. This has gone exceptionally well so far in 2022, and it has only been possible due to such extraordinary circumstances.
The Good News
In September, RP Max lost about 11%, and this represents a historically excellent outcome for Hedgewise. How can this be?
The following graph shows the Hedgewise weights across asset classes for last month (at the RP Max risk level). Notably, every exposure outside of bonds was at or near its minimum possible level, as represented by the grey bars below.
Hedgewise Weights by Asset Class, September 2022
Outside of bonds - which we'll cover in much greater depth shortly - Hedgewise managed risk last month almost perfectly. Another way to understand this is by measuring the specific amount of potential loss avoided within each asset class. For example, if equities were weighted 25% less than average, and incurred a 10% loss, then that portfolio would have "avoided" a 2.5% potential loss through risk management.
Hedgewise Losses Avoided Through Risk Management, September 2022
| Asset | Sept 22 Weight Vs. Hist. Avg. | Sept. Return | Loss Avoided |
|---|---|---|---|
| Copper | -9.2% | -3.5% | 0.3% |
| Gold | -10.1% | -3% | 0.3% |
| Bonds | -10.6% | -12% | 1.3% |
| Equities | -26.8% | -9.6% | 2.6% |
| Energy | -3.5% | -9.6% | 0.3% |
In other words, Hedgewise "should" have lost 16% last month, but instead it lost only 11%. To further validate this, we can compare Hedgewise performance to the RPAR ETF, which is a more passive risk parity product and has a similar target volatility to the RP High risk level.
RP High Live Performance vs. RPAR ETF, September 2022
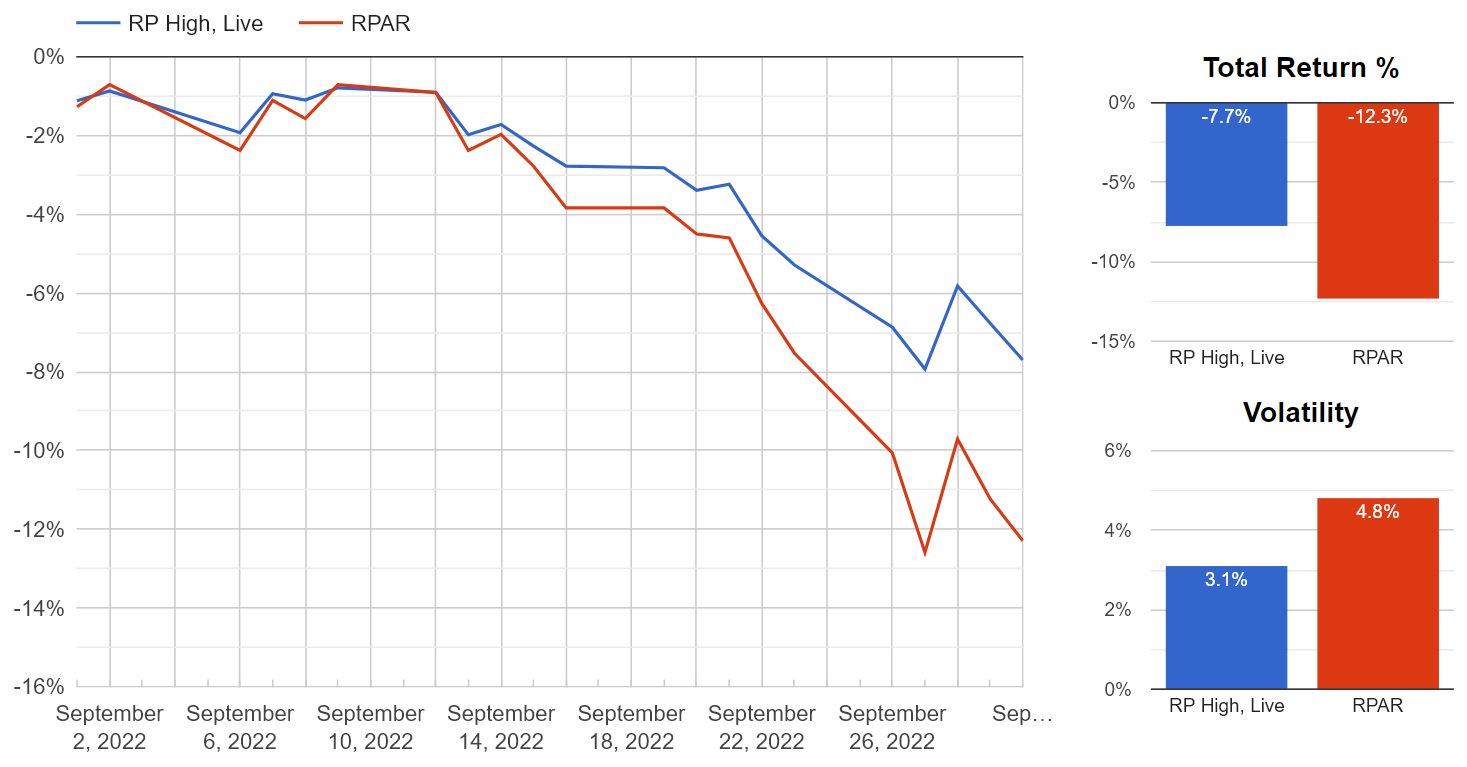
After adjusting for volatility, this is almost exactly the delta expected. There is rarely this degree of differentiation in most years, never mind in a single month. In more normal circumstances - say at the end of a year, Hedgewise had gained 15% while most similar funds had gained 10% - it would represent one of the best annual outcomes ever. Though Hedgewise performance in September was no less real or impactful, it can feel more difficult to appreciate alongside a significant drawdown.
This is ironic because successful loss avoidance is such a powerful driver of long-term outperformance. Part of this is simple probability: if an asset was at its minimum exposure during a period of loss, exposure will probably be higher during any subsequent recovery. In addition, you get a mathematical boost because any given loss requires a larger percentage gain to return to breakeven.
For example, in September, the "passive" risk parity portfolio lost 16%, compared to an 11% loss for Hedgewise. For the passive portfolio to return to breakeven, it must subsequently gain 19%. If Hedgewise participates in this, it would wind up with a 6% total gain. The higher the loss differential, the higher the potential future gain.
We can run this same calculation at various points in time this year to see how it has changed as bigger losses have accrued.
Potential Net New Gain Created by Loss Avoidance, RP Max
| Hist. Avg. Loss | Live Portfolio Loss | Potential Net New Gain Post-Recovery | |
|---|---|---|---|
| Feb 22 | -5% | -2% | 4% |
| May 22 | -22% | -12% | 14% |
| July 22 | -31% | -18% | 19% |
| Current | -41% | -26% | 25% |
From this perspective, the 26% drawdown of this year likely represents 25% of net new gain post-recovery. Said differently, whenever markets recover to the levels of January 2022, Hedgewise now has the potential to be 25% higher than where it started this year. This does not require fancy timing or good luck - asset weights need only return to historical average levels, and markets subsequently recover their YTD losses.
Returning to an earlier comparison, performance this year is comparable to a scenario where most assets are down 20%, and Hedgewise is breakeven. The scale of this year's losses just makes it much harder to see.
Hopefully the mechanics are becoming easier to follow. Losses are good if asset weights are low and have a high chance of increasing at much cheaper prices. Outside of bonds, Hedgewise has achieved near the best possible outcome this year. In fact, if you removed bonds from the portfolio, the current drawdown for RP Max would only be about 10%. But if you are going to concentrate a drawdown in a single asset class, bonds are where you want to do it from a systematic perspective.
I'd Rather Lose Money in Bonds
Treasury bonds have a few unique attributes that differentiate them from other asset classes. There is close to zero default risk, meaning if you hold a government bond to maturity, you are guaranteed to make your money back plus interest. As prices go down, interest goes up, so you are instantly paid more going forward whenever you accrue losses today. Because interest rates have such a huge impact on the economy, they will always tend to gravitate towards a "neutral" rate that is consistent with the Fed's mission of achieving 2% inflation alongside stable employment. The higher rates go above the neutral level, the more likely they will subsequently fall in the future, and vice versa.
These factors make bonds much more predictable and systematic than other assets and lead to counterintuitive outcomes where short-term losses can be preferable to gains.
A useful demonstration of this is using three-year government bonds, which began 2022 yielding a 1% interest rate. The Fed's best estimate of the "neutral" rate is 2.7%, so you'd expect that rates will rise. As a passive investor, what would be the best outcome over 5 years - for rates to stay where they are, rise slowly to 2.7%, or jump suddenly above the neutral rate and eventually settle back down to 2.7%?
We can model this easily, and the following shows how a passive portfolio would perform in all three scenarios. The actual three-year rate today is around 4.4%, so we'll use that number to model the final scenario where there is an initial "spike" before rates eventually return to neutral.
3yr Government Bond Model Performance, Various Interest Rate Scenarios
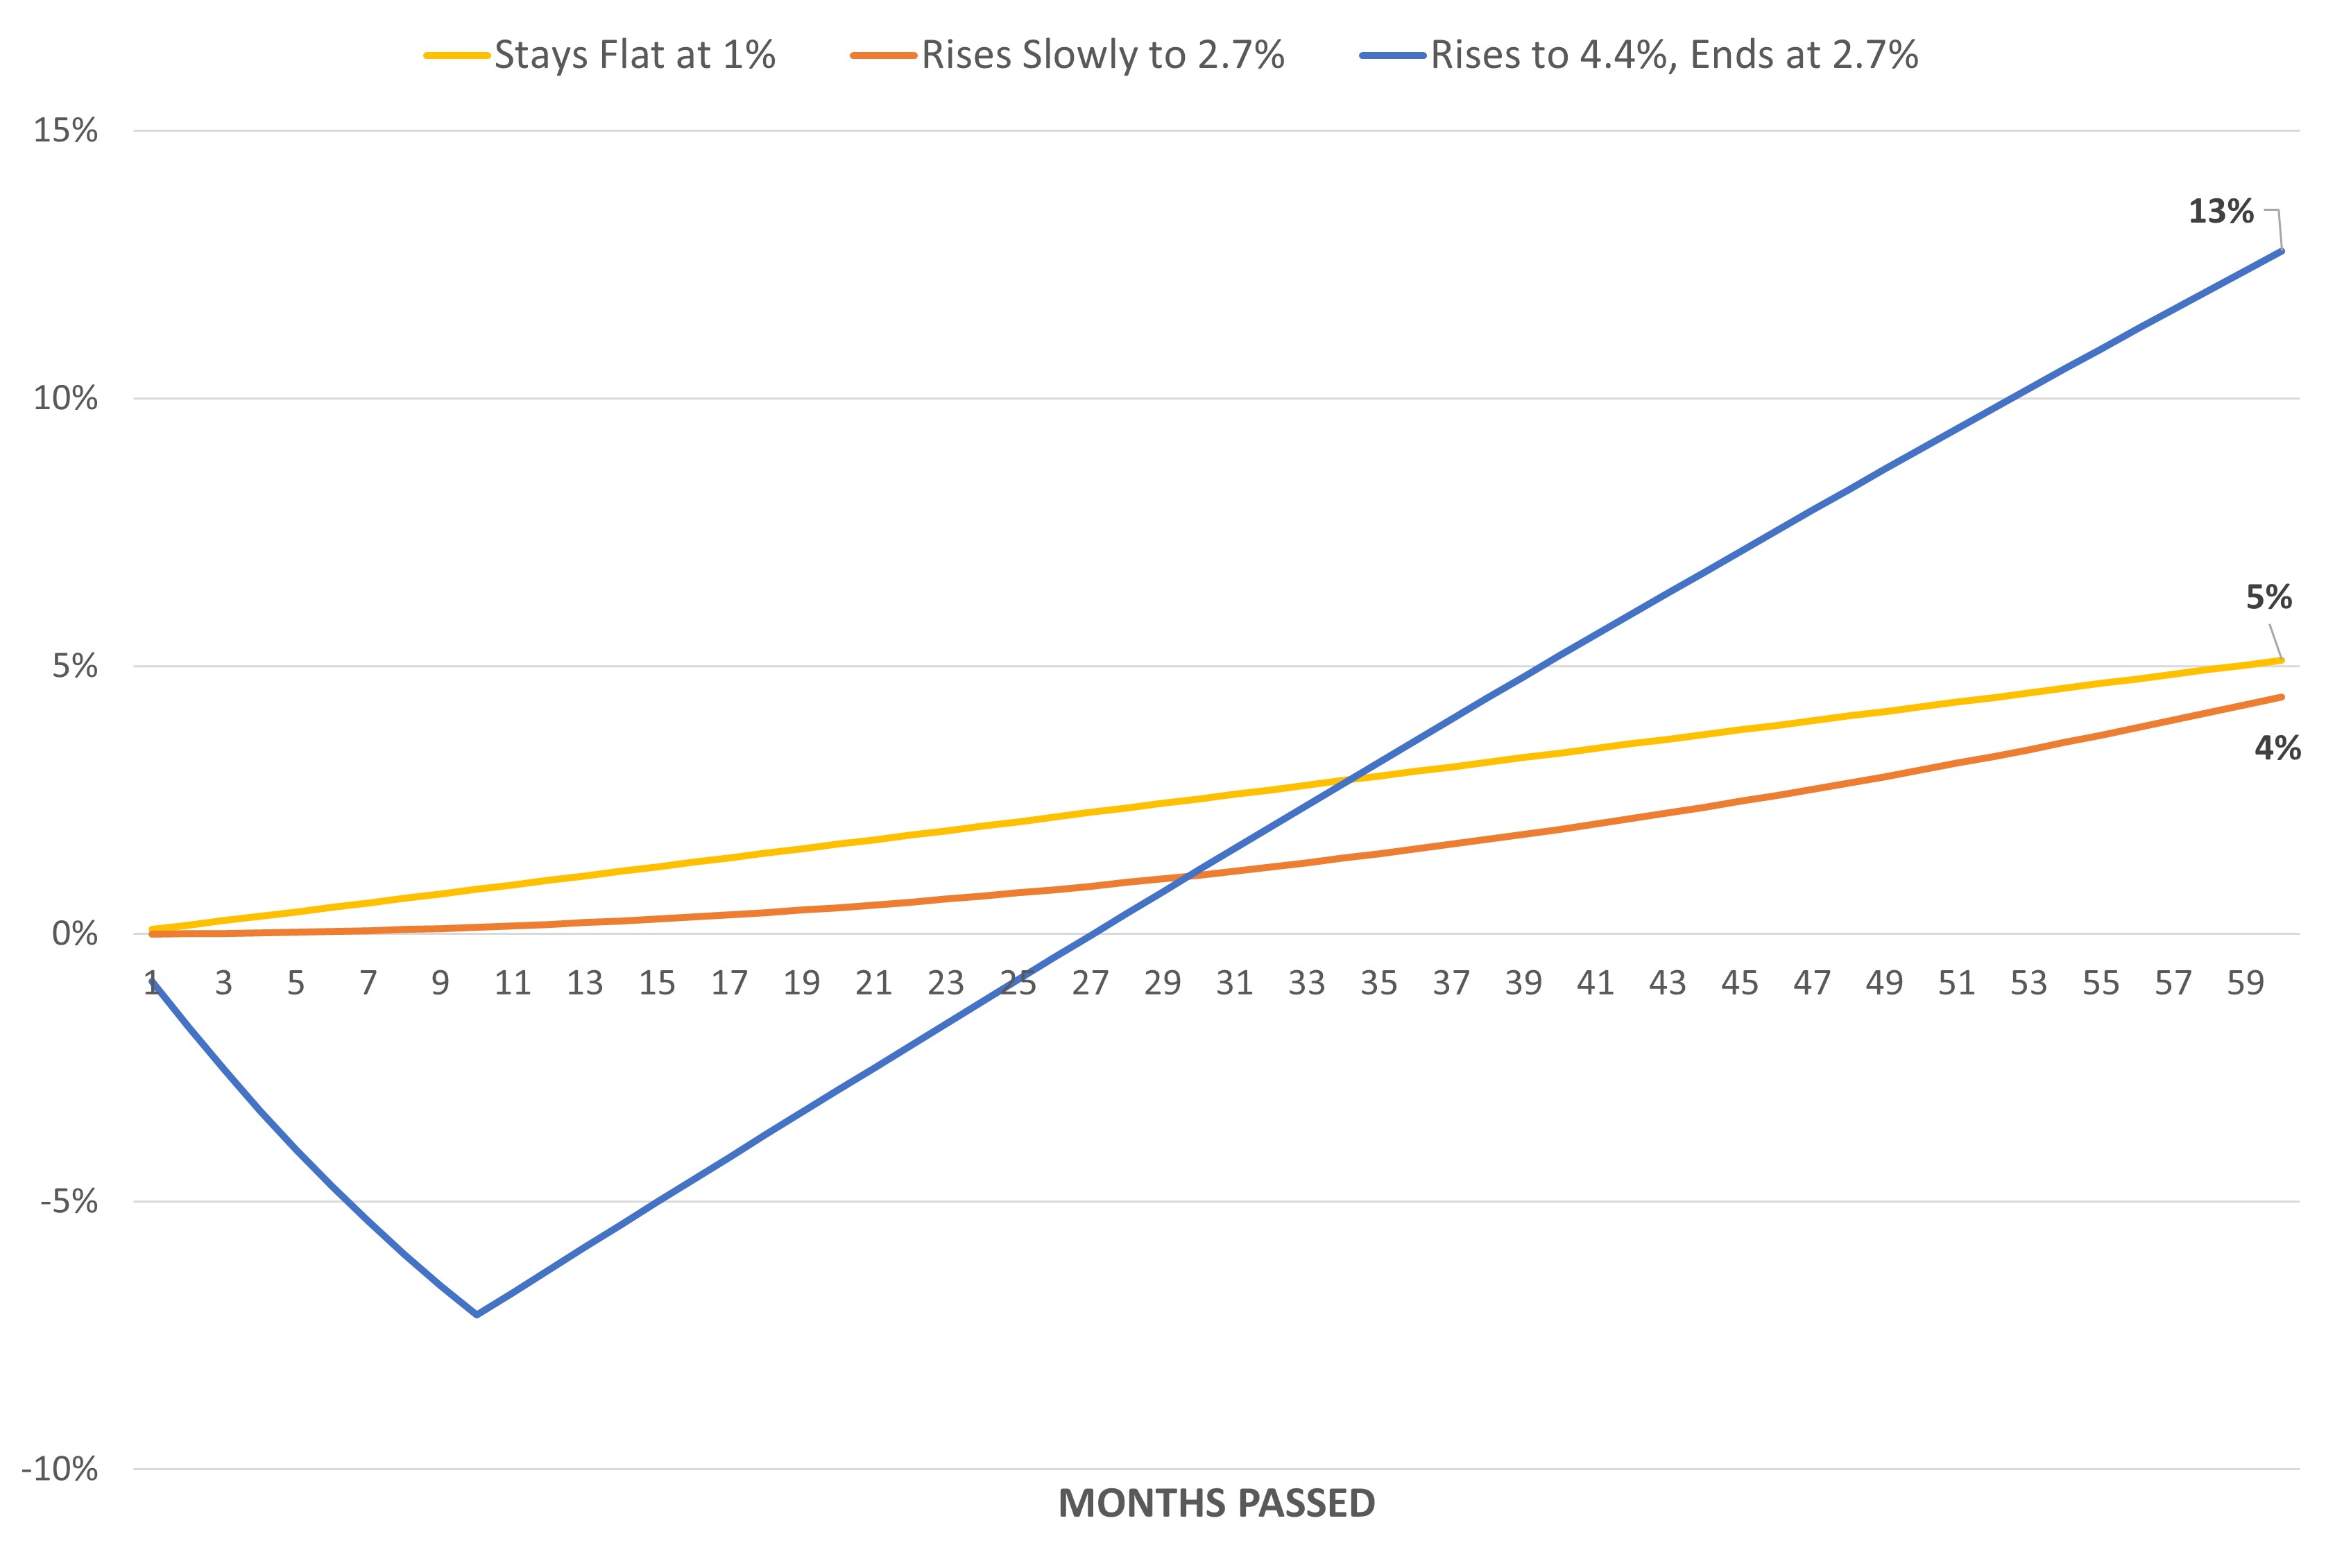
It may be a surprise to see that the sudden rate jump yields a better outcome, despite initial losses of 7%. This is because all three scenarios wind up in the same place, but in the third you are paid a much higher level of interest in the interim. If you were a purely passive investor with a five-year time horizon, you'd prefer the current spike in rates to no rise at all.
Given what we know about how predictable bonds are, though, why would we stop there? As rates move above the neutral rate, there is an increasing chance that they will fall in the future. In a very simple form of risk management, say you decided to hold 33% exposure with rates starting at 1%, and implemented a system to increase that evenly to 100% exposure if rates hit 4%.
3yr Government Bond Model Performance, With Simple Risk Management
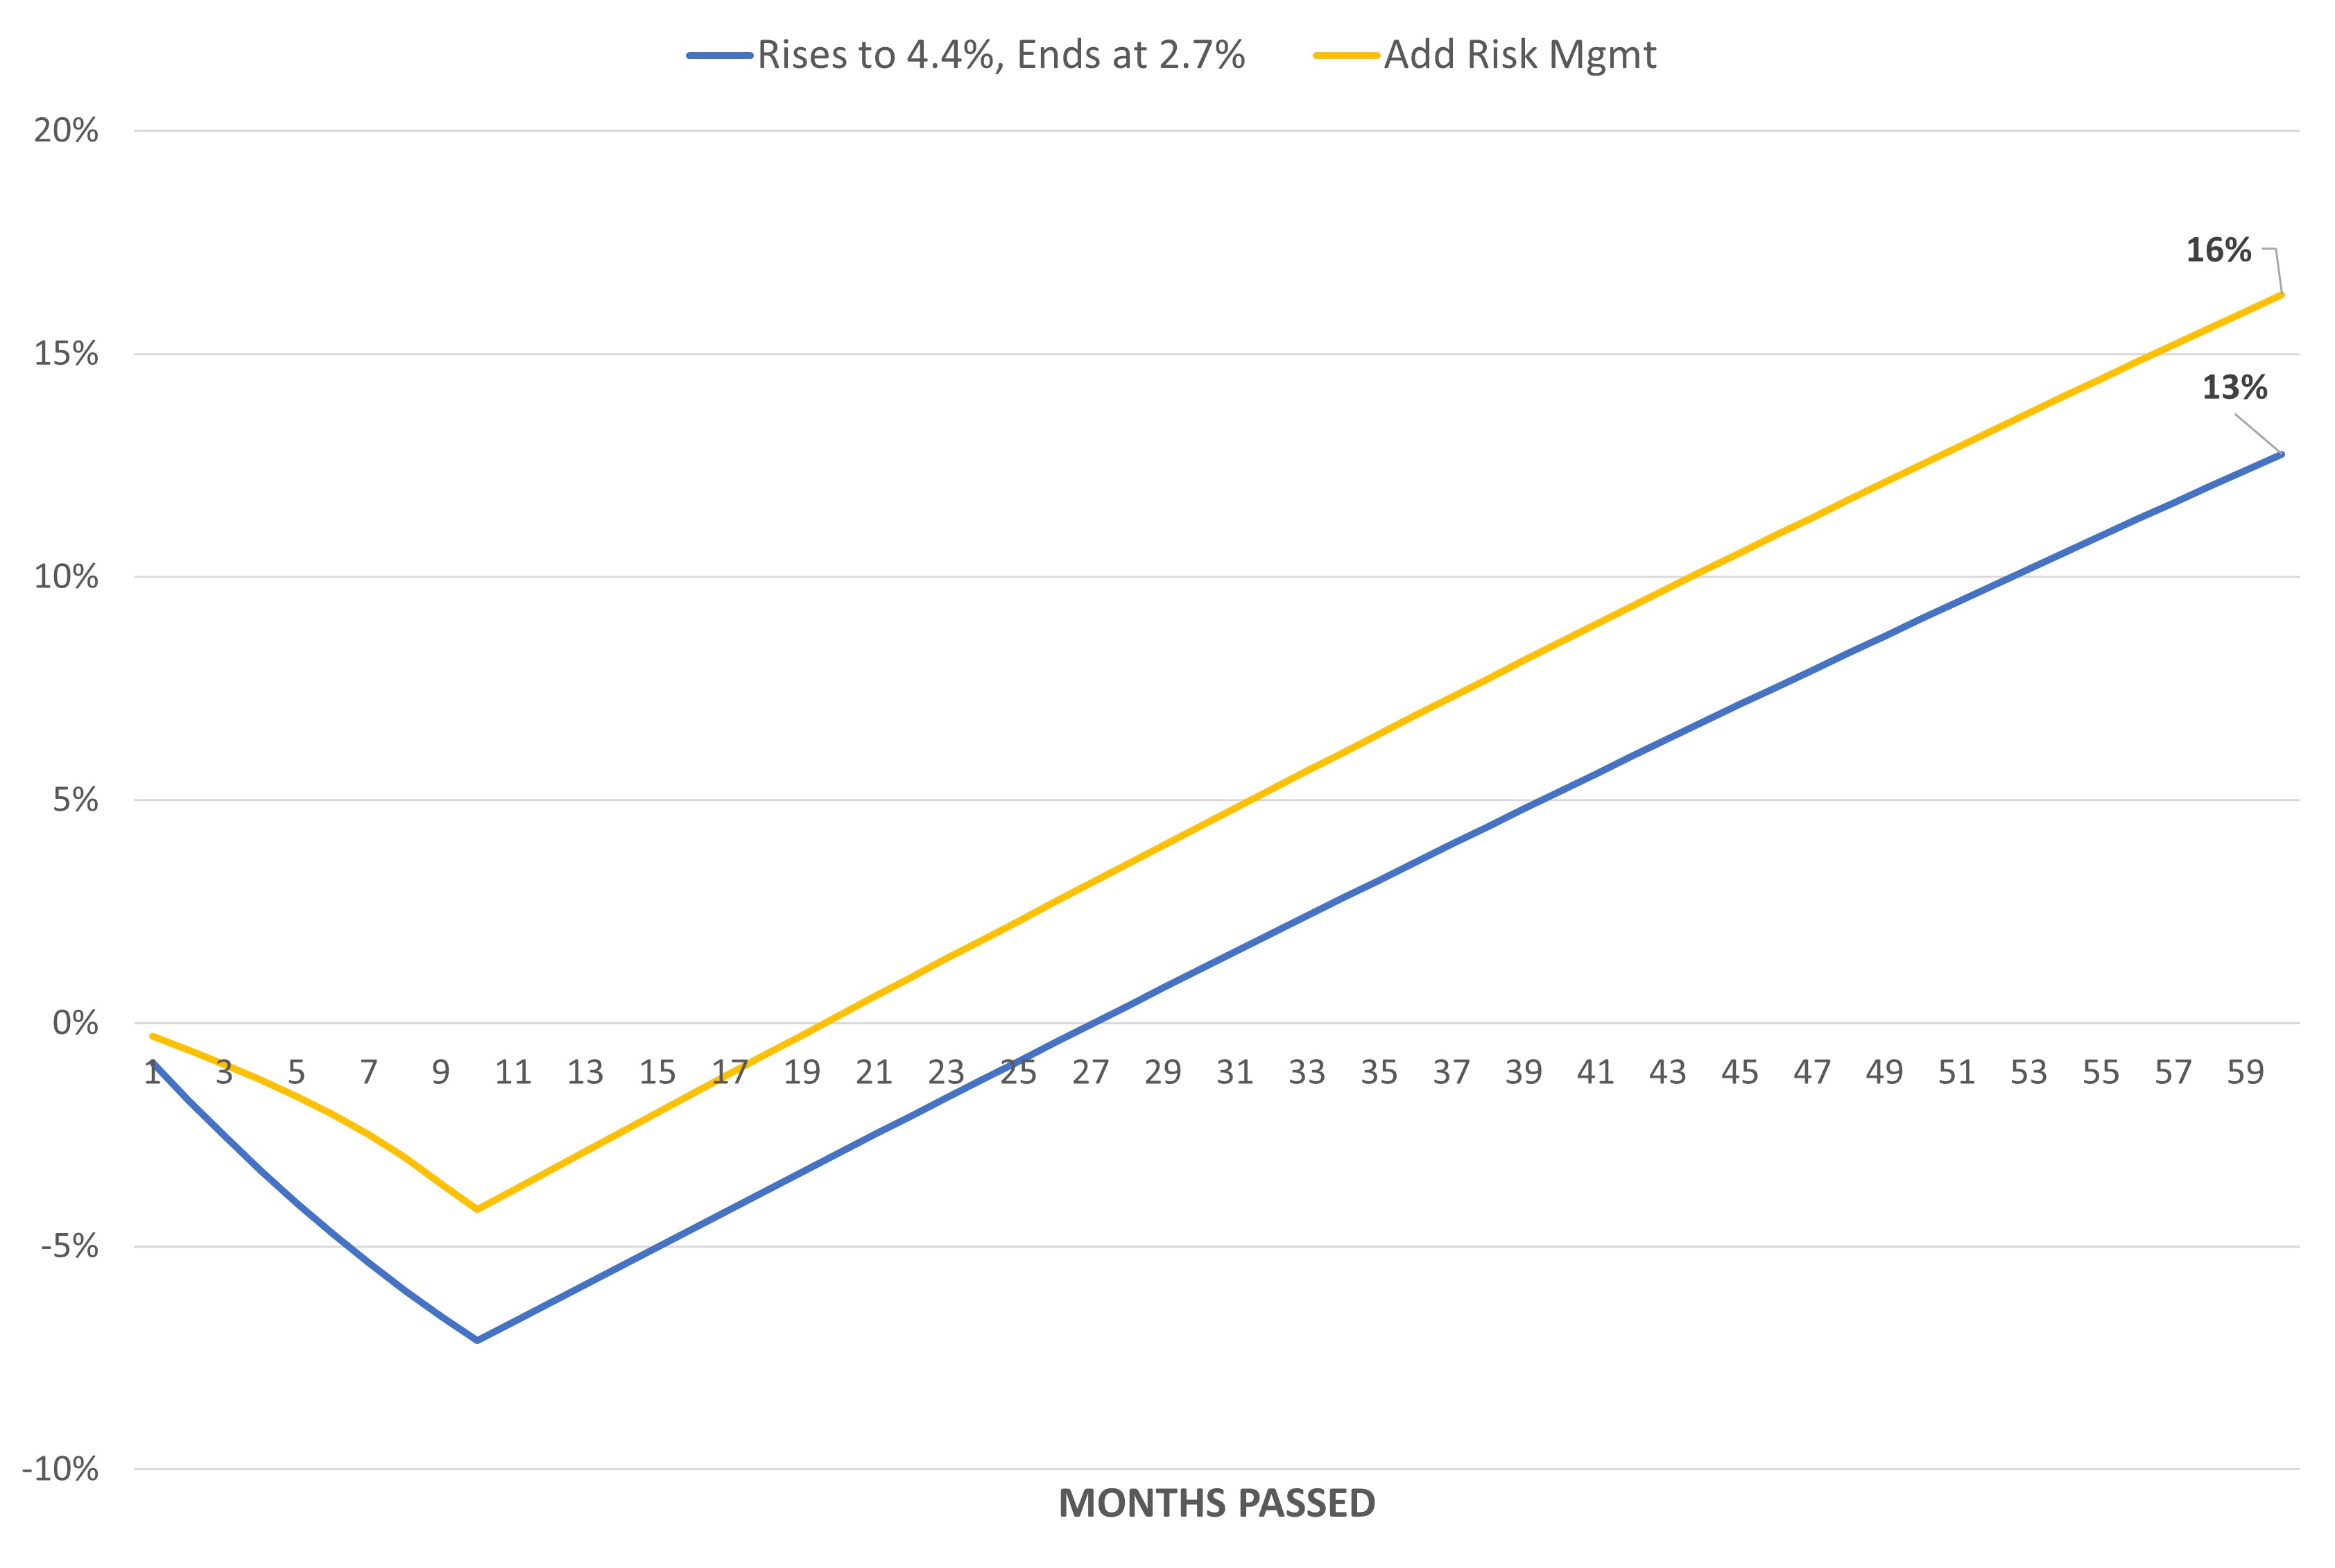
It probably feels counterintuitive, but this halves your drawdown and nets you another 3% in final return. Even if you could magically time this curve and move from no exposure to 100% at the exact bottom, you'd only net 5% extra at the end of five years (i.e., 21%). Simple risk management gets close to this ideal scenario with no work or timing required, so long as you can "look past" the initial drawdown and focus on your longer-run returns.
Now imagine that interest rates rise to 6% instead. Would the framework still hold?
3yr Government Bond Model Performance, 6% vs 4.4% Interest Rate Peak
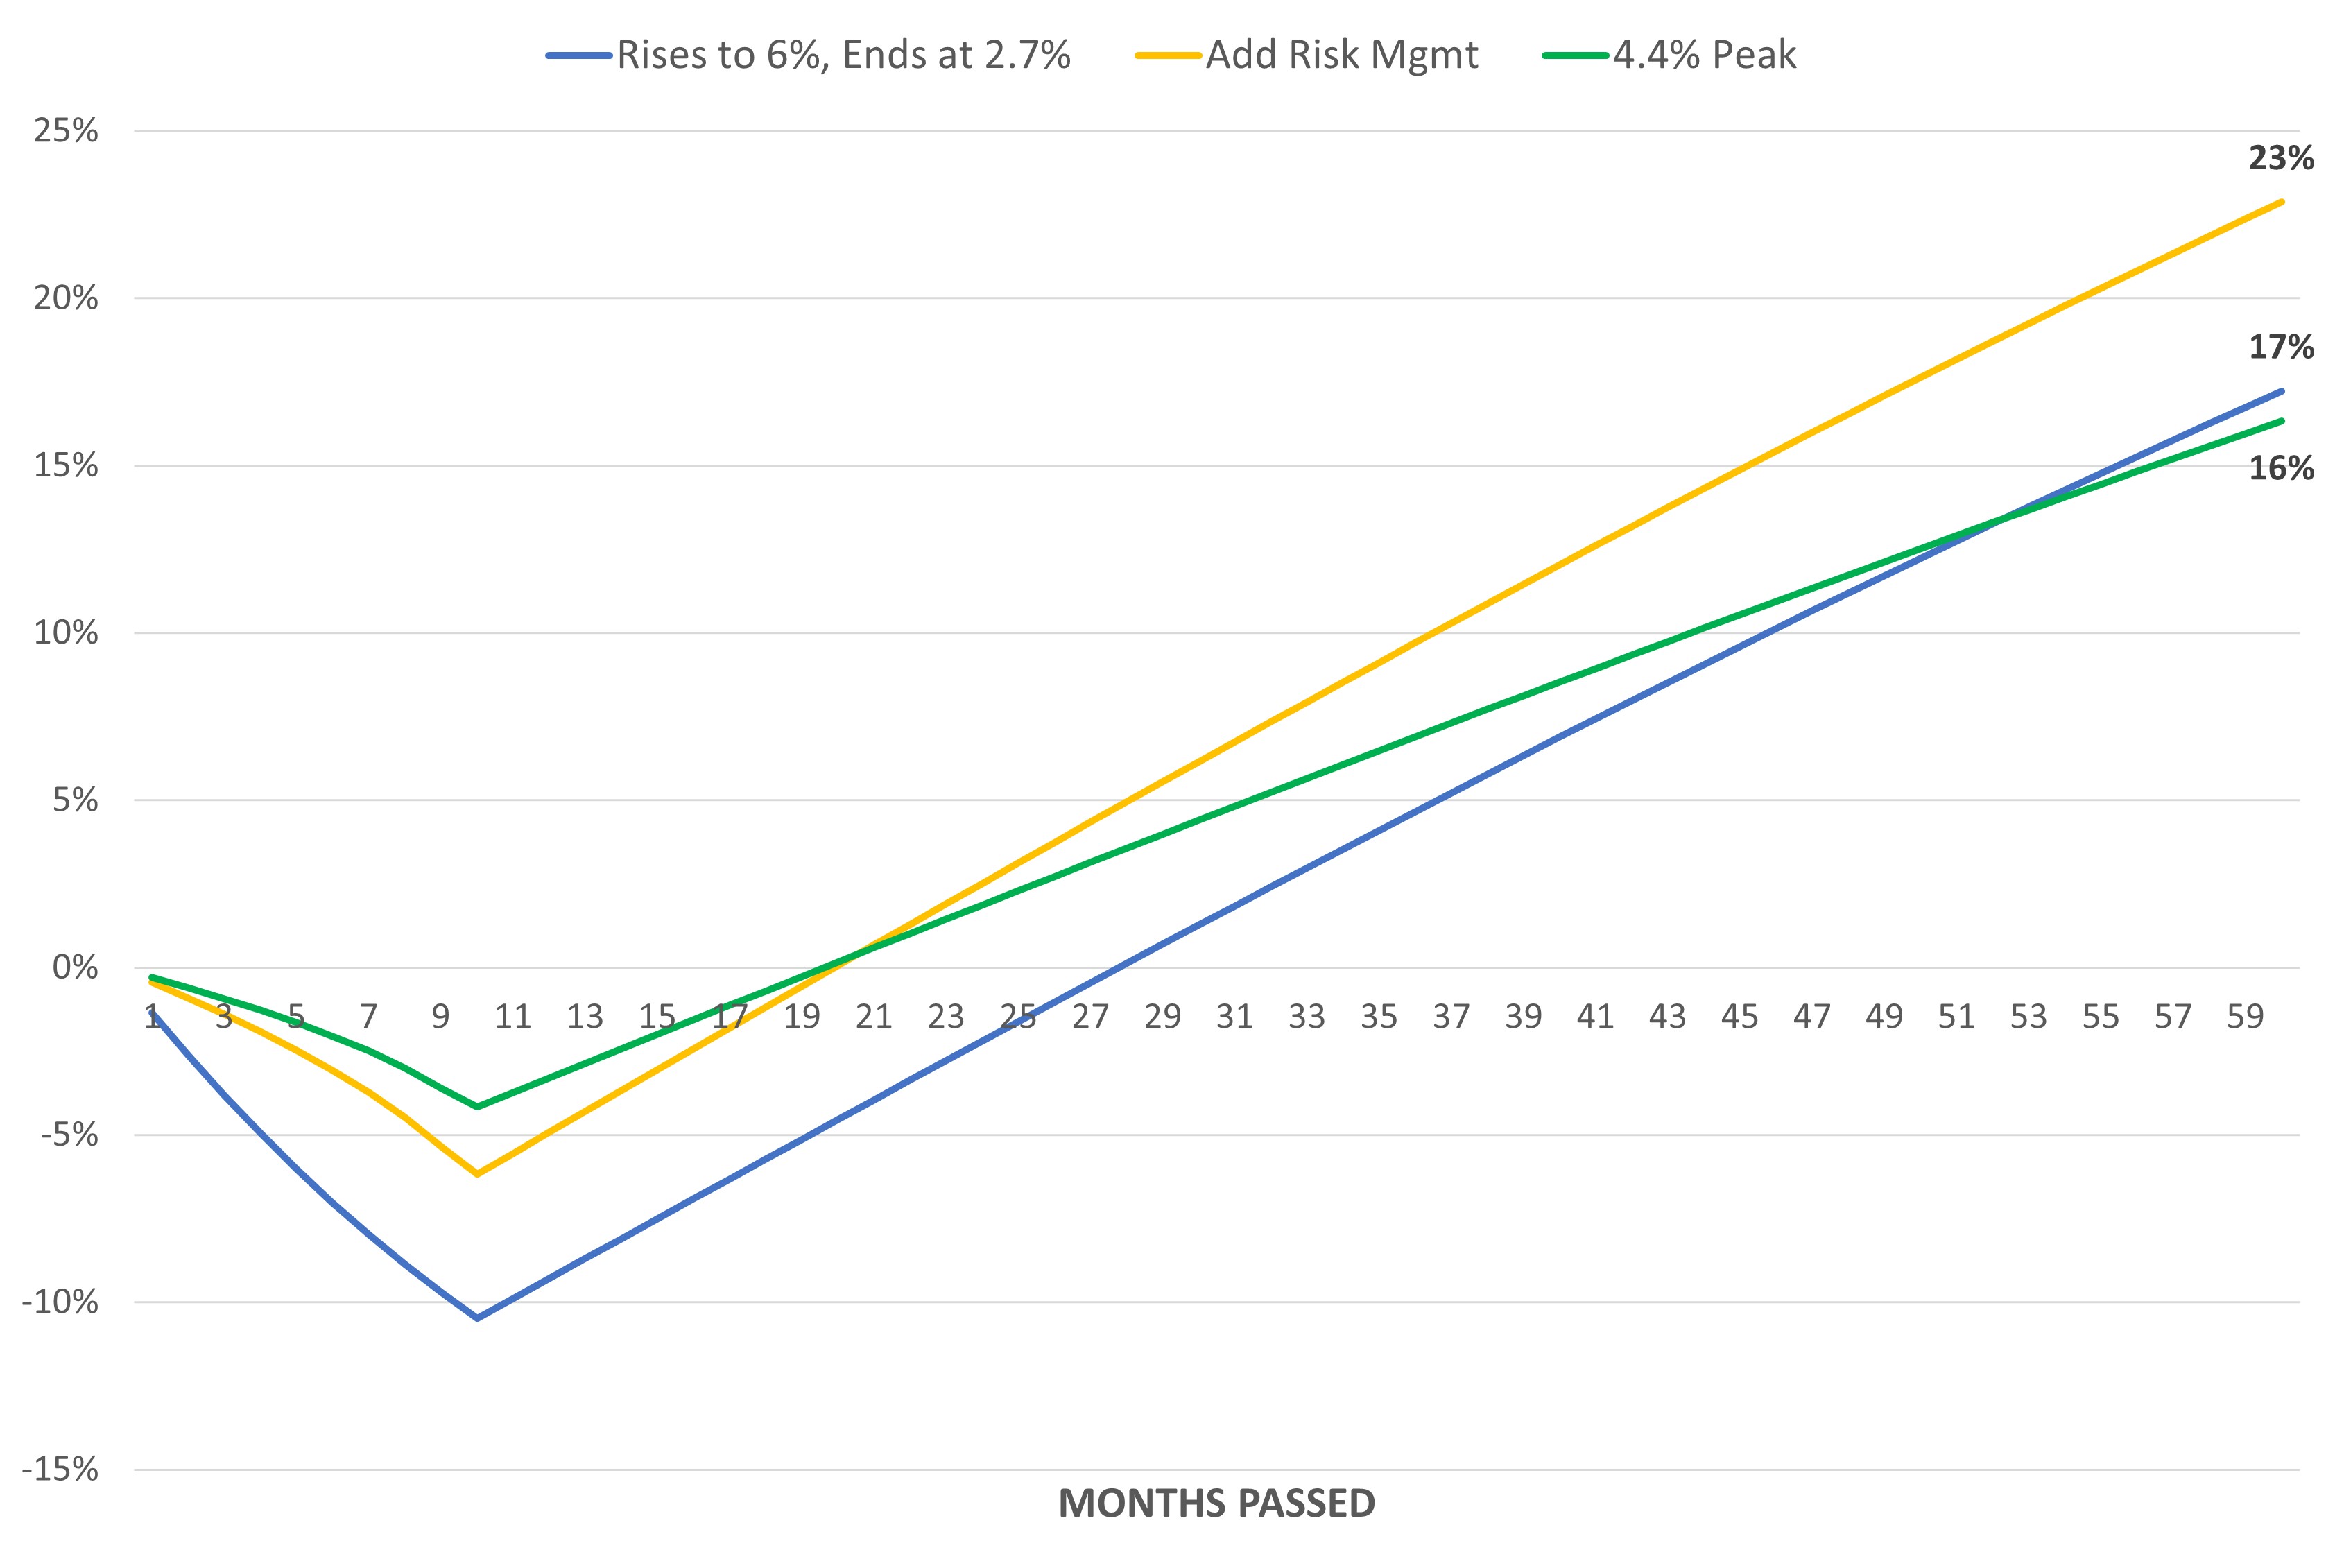
By the end of five years, a 6% interest rate peak yields a better outcome despite the larger initial drawdown. While this math is straightforward, the implications can feel backwards. Revisiting the earlier example, a 4.4% peak with perfect timing (i.e., no drawdown, invest at precise bottom) yields a total return of 21%. A 6% peak with simple risk management yields 23% despite initial losses. A rational investor should prefer the latter, but that means rooting for higher bond losses and foregoing any attempt to time them.
These same lessons apply to longer bonds in a similar manner, just amplified.
How This Works for Long Bonds and Hedgewise
Now let's bring these concepts to life in the live Hedgewise portfolio, which uses twenty and thirty-year bonds in addition to more sophisticated risk management.
Just as in the theoretical discussion, Hedgewise began this year with limited bond exposure and has increased it methodically as rates rose above neutral levels. The following shows the live relative performance of bond exposure in the RP Max portfolio versus passive 30yr bond returns.
Impact of Bonds on Hedgewise RP Max vs. Passive Portfolio, January to October 2022
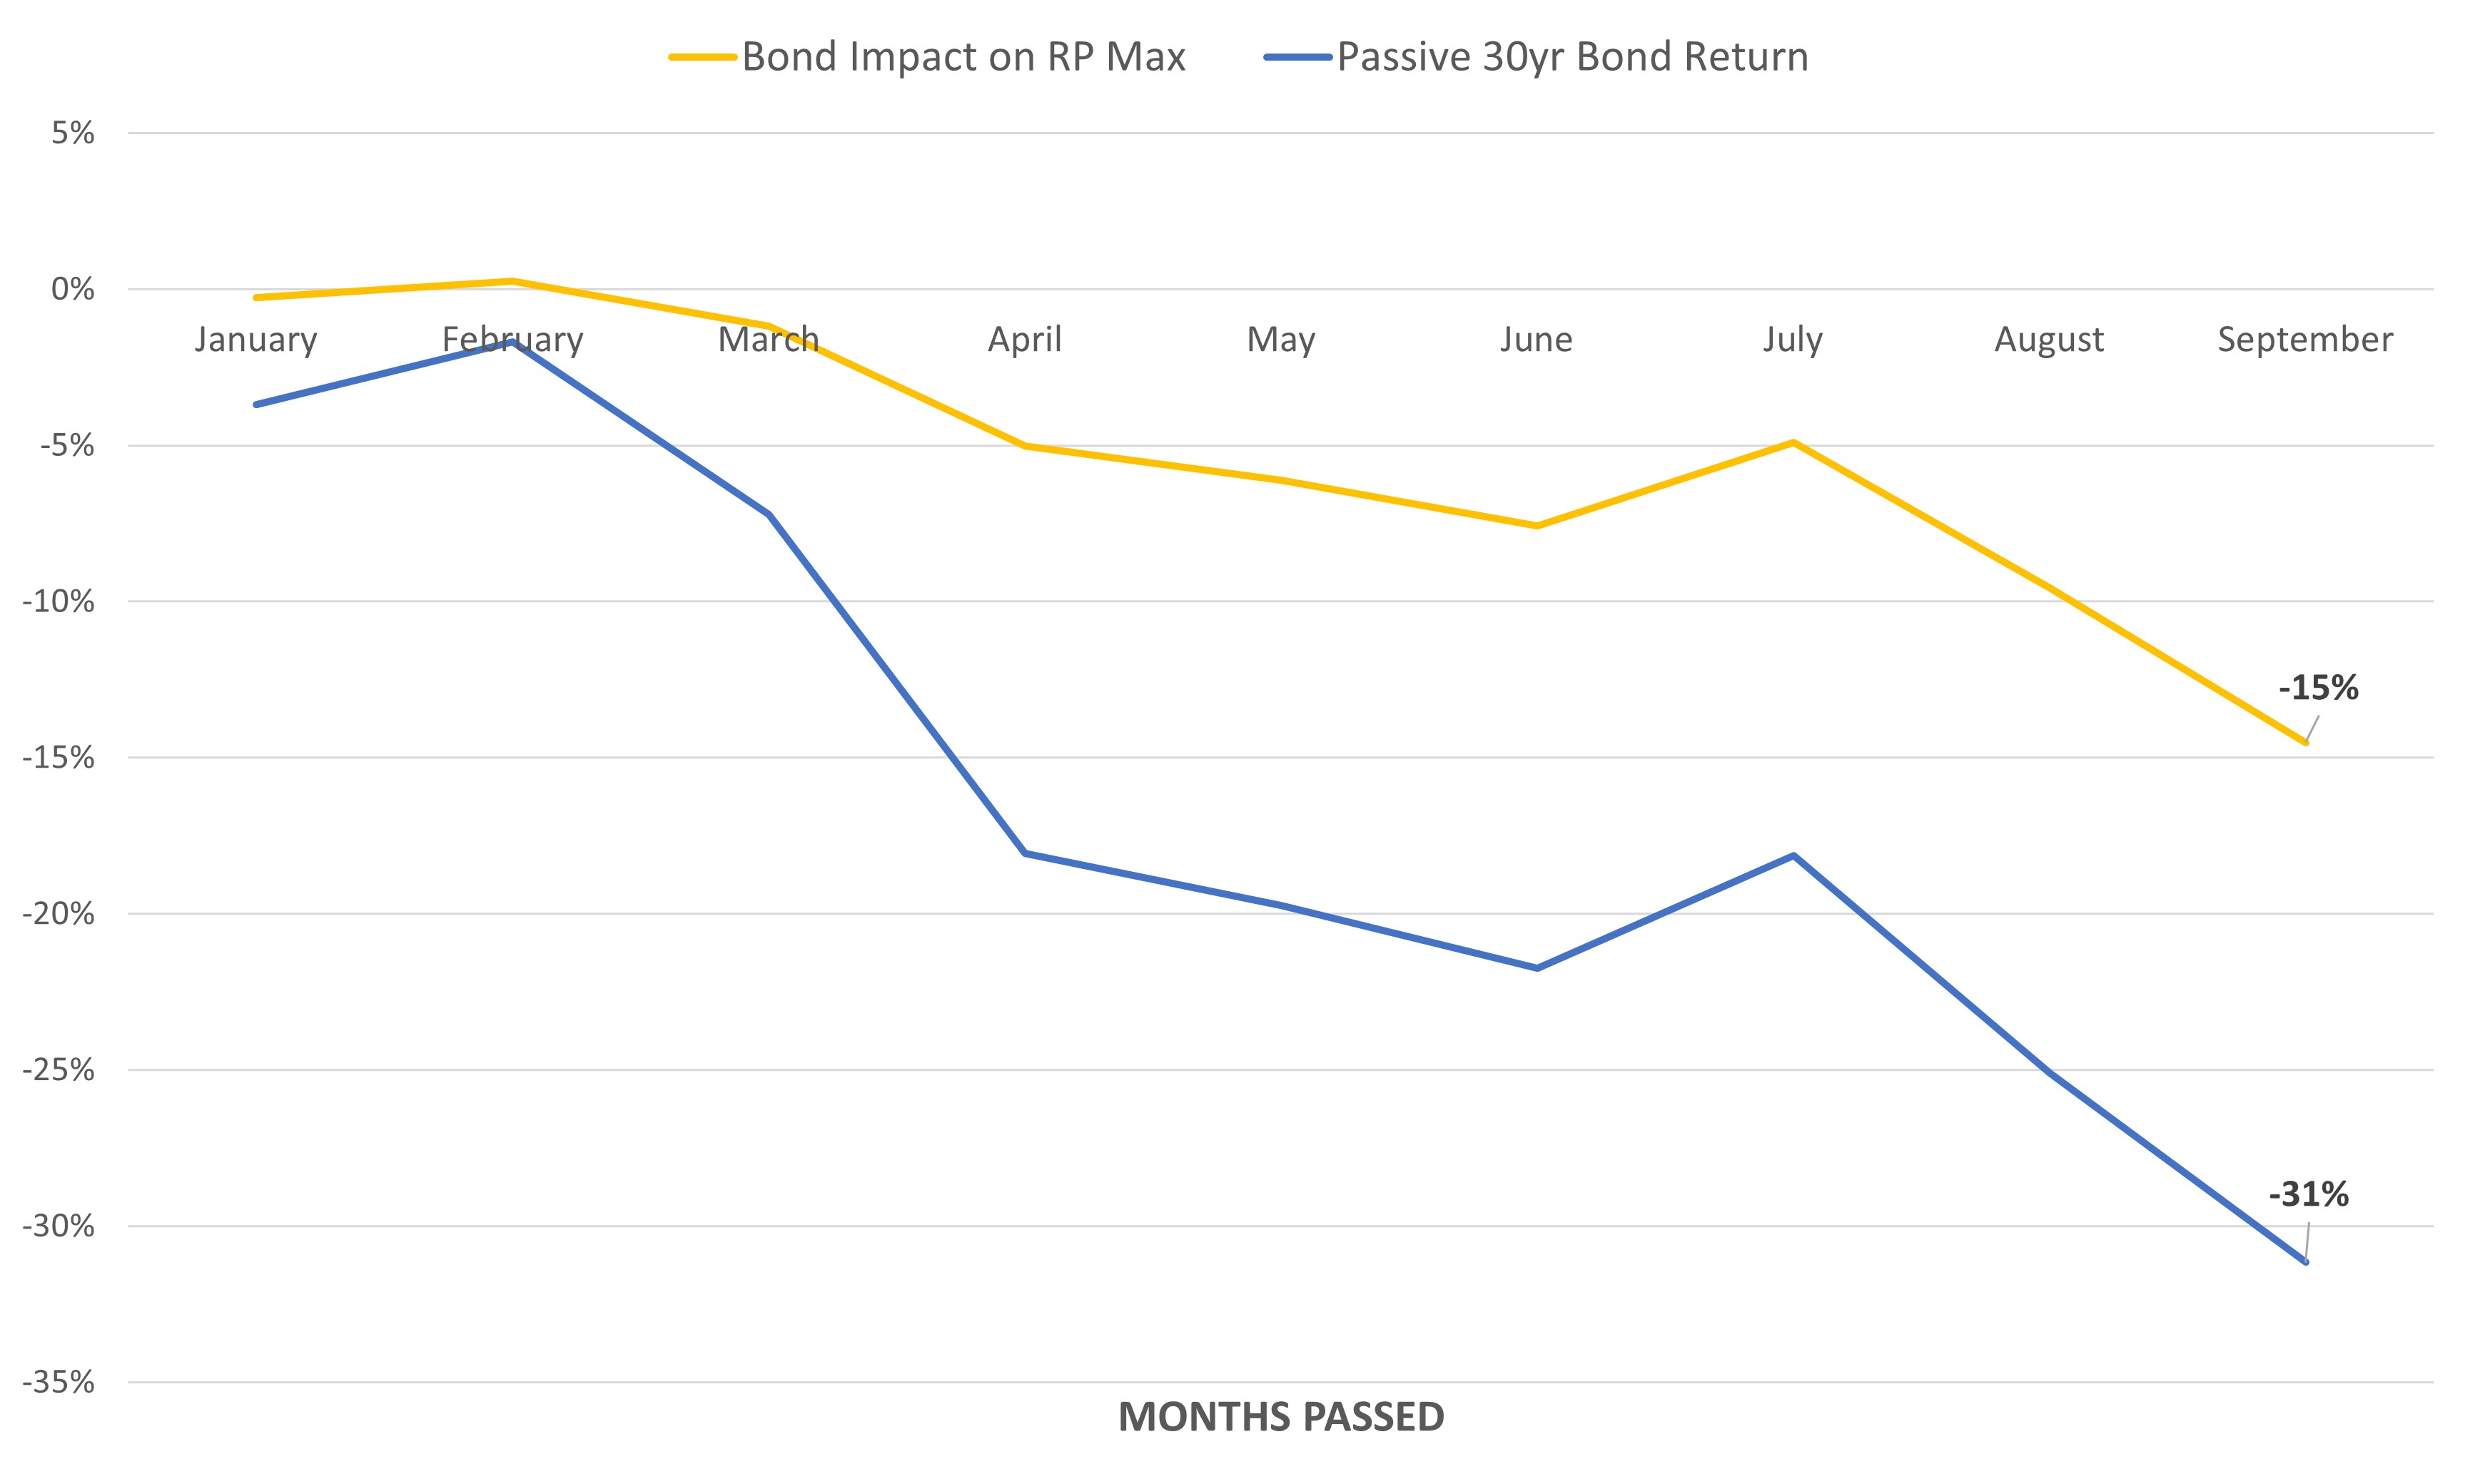
So far, so good. The drawdown is less than half that of a passive portfolio, while bond exposure has been increasing throughout the year. We can model a few simple hypotheticals moving forward. Imagine that rates have peaked this month, and slowly move down to the neutral level of 2.7% over the next four years with very little volatility. Hedgewise bond exposure is assumed to remain at the historical average level throughout the recovery (which it is close to in live portfolios at present).
Model 1: Rates Peak at 4%, Hedgewise Returns to Historical Average Bond Weights
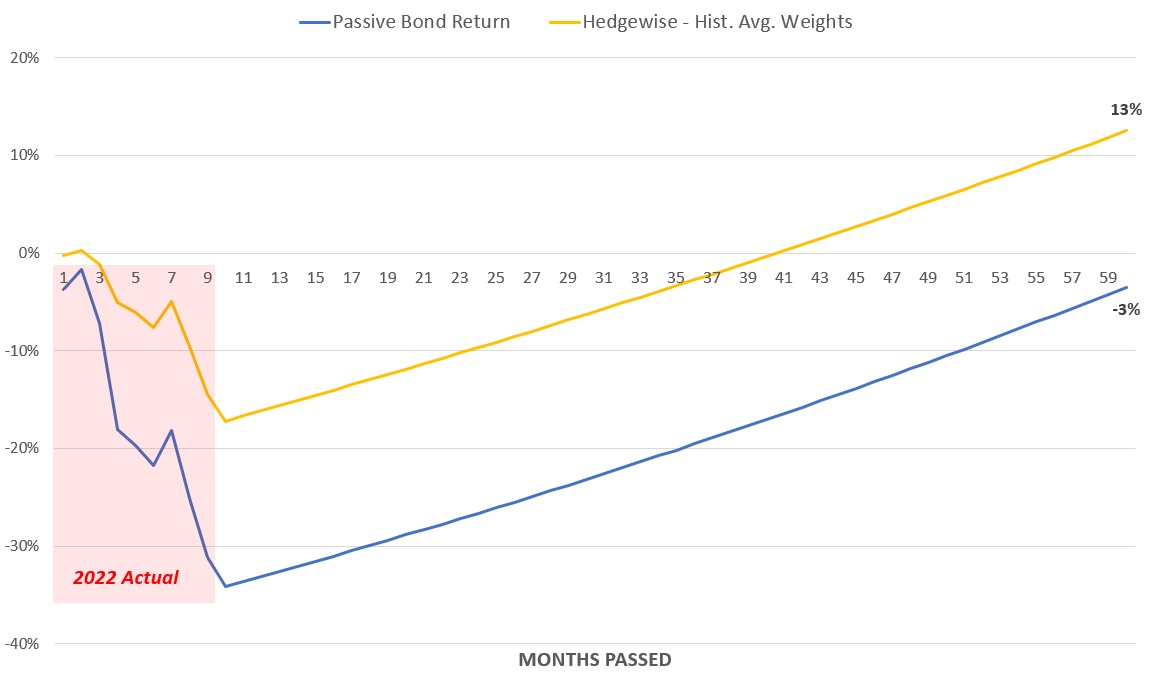
Note that the highlighted portion is equivalent to the prior graph. In this basic scenario, Hedgewise translates its current loss into a 13% net gain by the end of five years. This is already consistent with the theory discussed earlier despite representing a likely "floor" of potential outcomes.
Bond yields are unlikely to fall predictably in this perfect straight line. Expected volatility is a part of how Hedgewise applies risk management, and this year provides an excellent case study of how this can be used to further boost expected returns.
From July to September, 30yr yields went from 3.1%, down to 2.9%, and back up to 3.4%. It follows that you'd adjust exposure accordingly, and this is precisely what Hedgewise did.
Recommended Bond Exposure by Month in the RP Max Portfolio, July to September 2022
| Month | 30yr Rates | Hedgewise Weight |
|---|---|---|
| July | 3.1% | 63% |
| August | 2.9% | 58% |
| September | 3.4% | 68% |
Hedgewise is capturing little pockets of gain and avoiding potential losses as rates bounce around. Just the reduction in exposure at the beginning of August alone is worth about 0.5% in "extra" return for 2022. The more bond volatility, the more potential there is amplify these gains. We can model how this opportunity would affect expected Hedgewise returns depending on how choppy markets are over the next few years.
Model 2: Add Bond Volatility Management
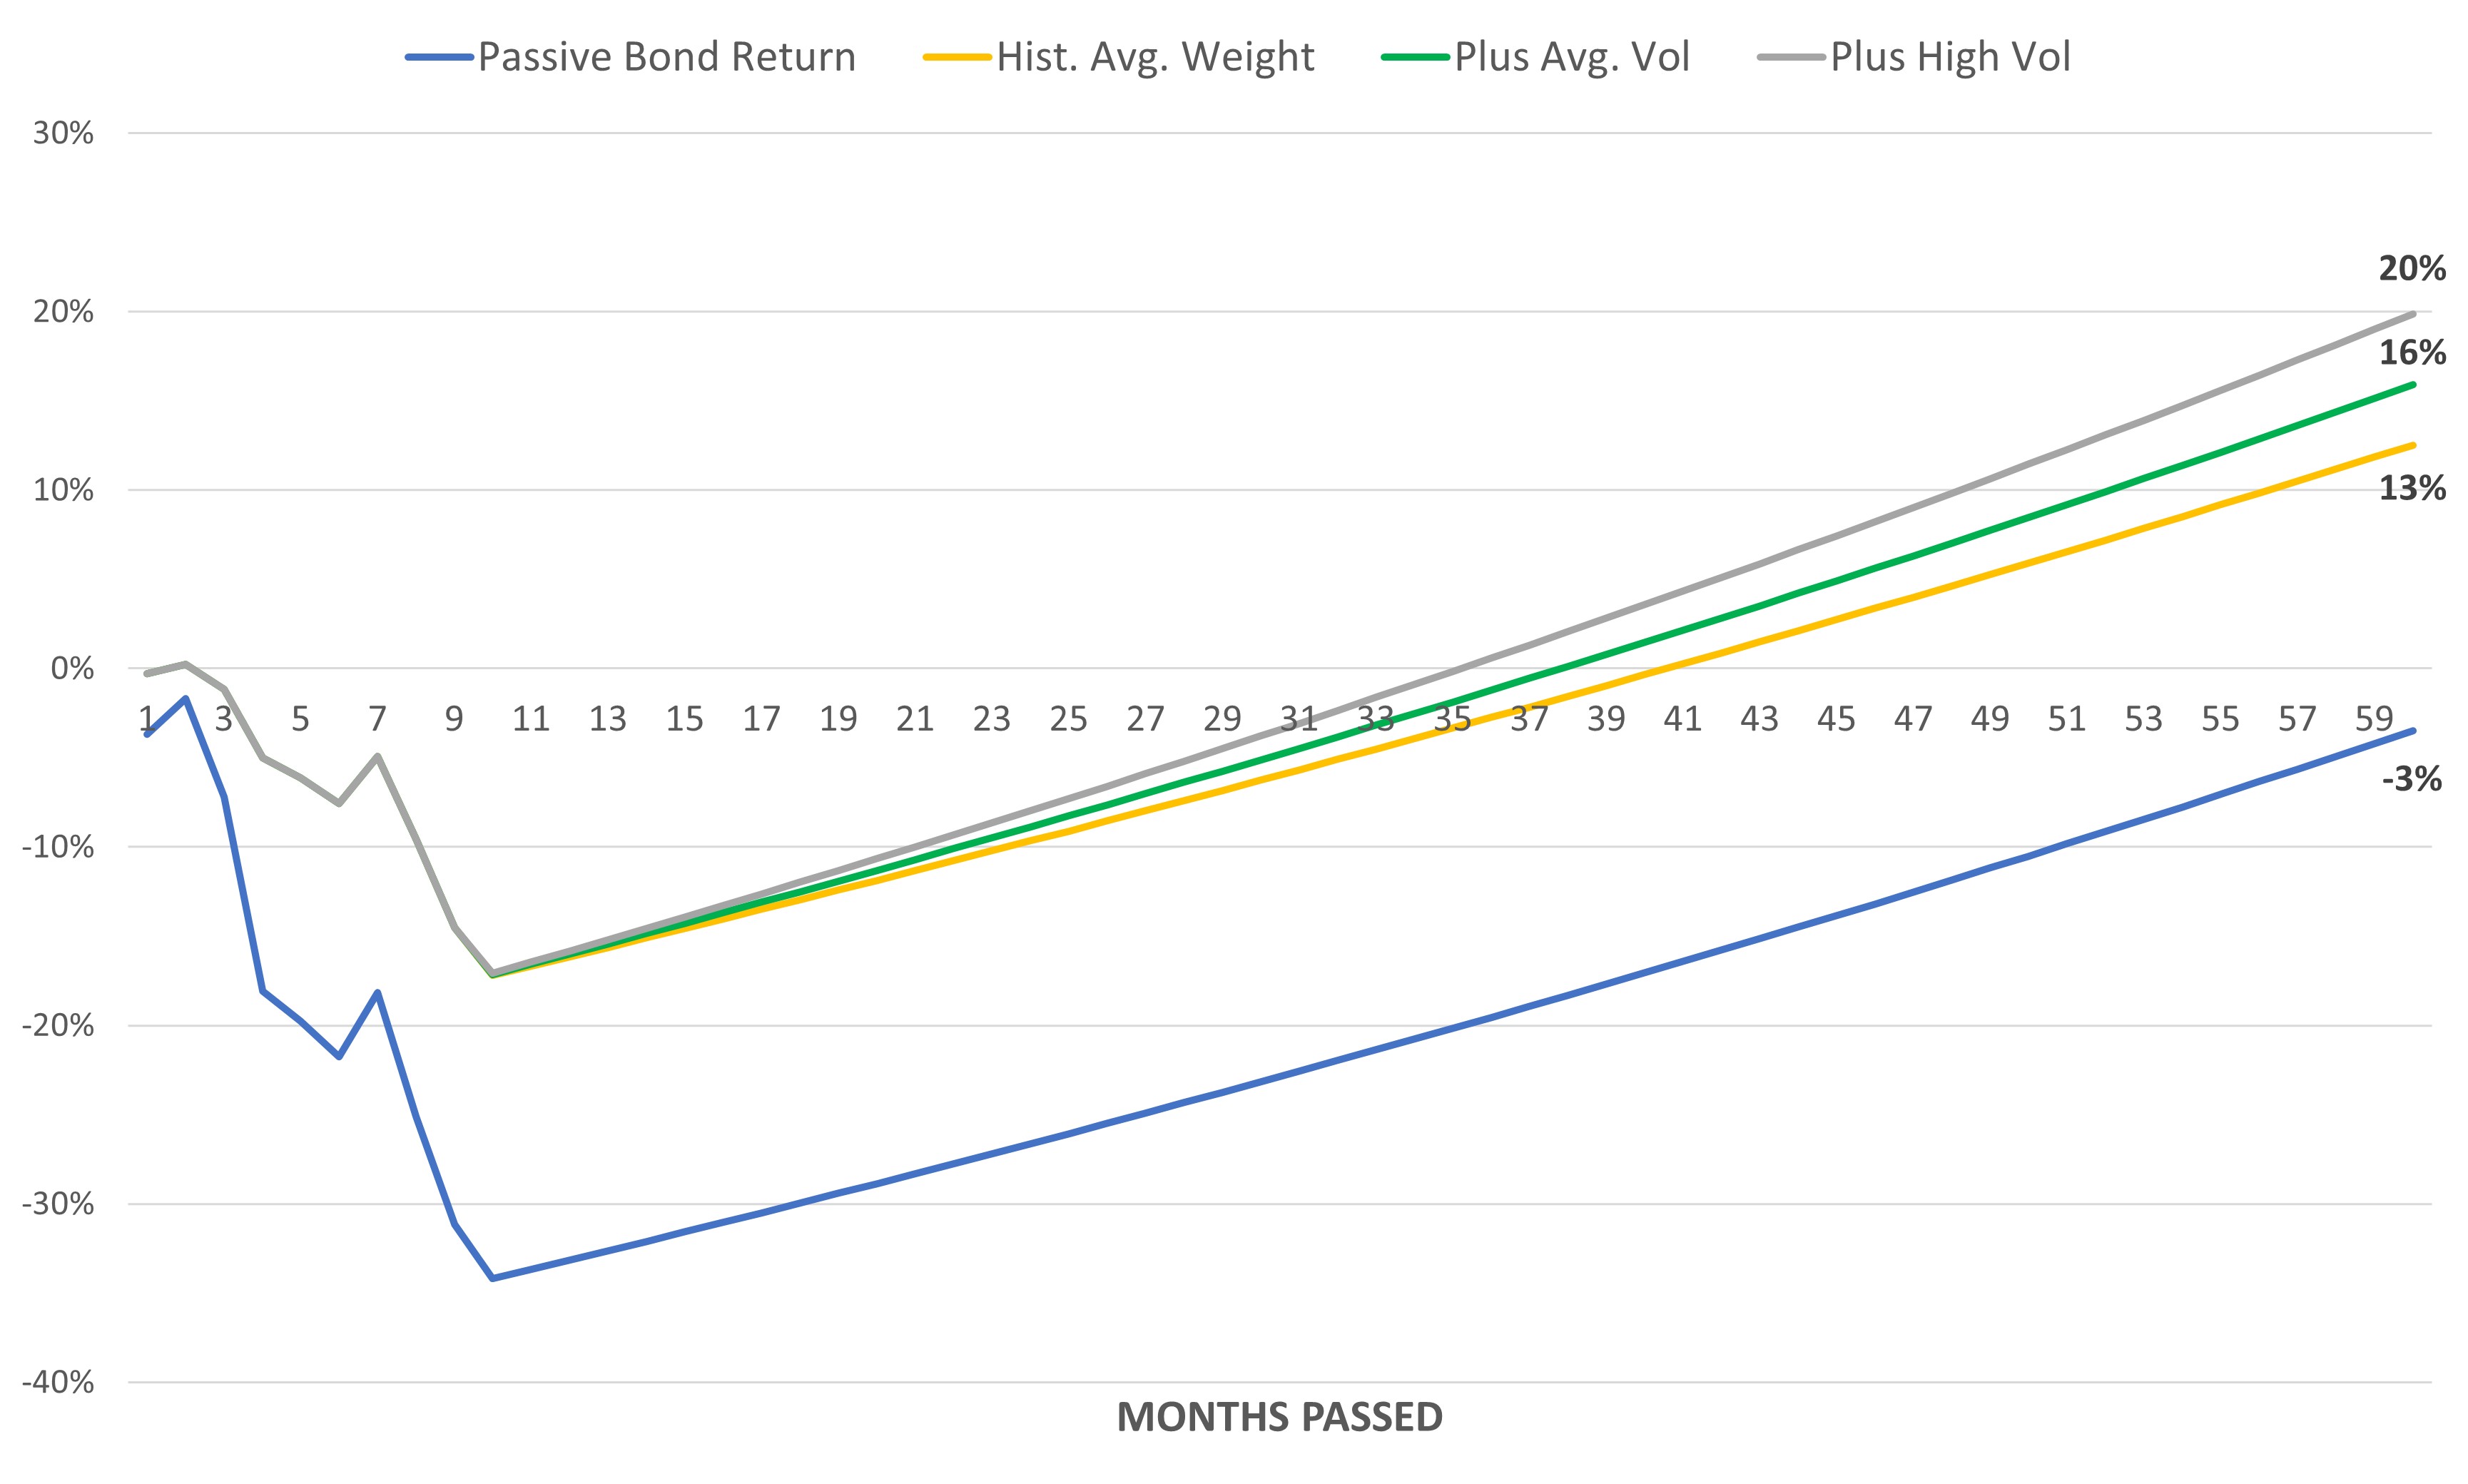
The final assumption from the initial scenario that needs revisiting is the level of bond exposure. The historical average weight is conservative, especially with rates already so high above neutral. A more likely outcome is that exposure eventually rises to 20% above this level.
Model 3: Bond Exposure Rises to 20% Above Historical Average Weight
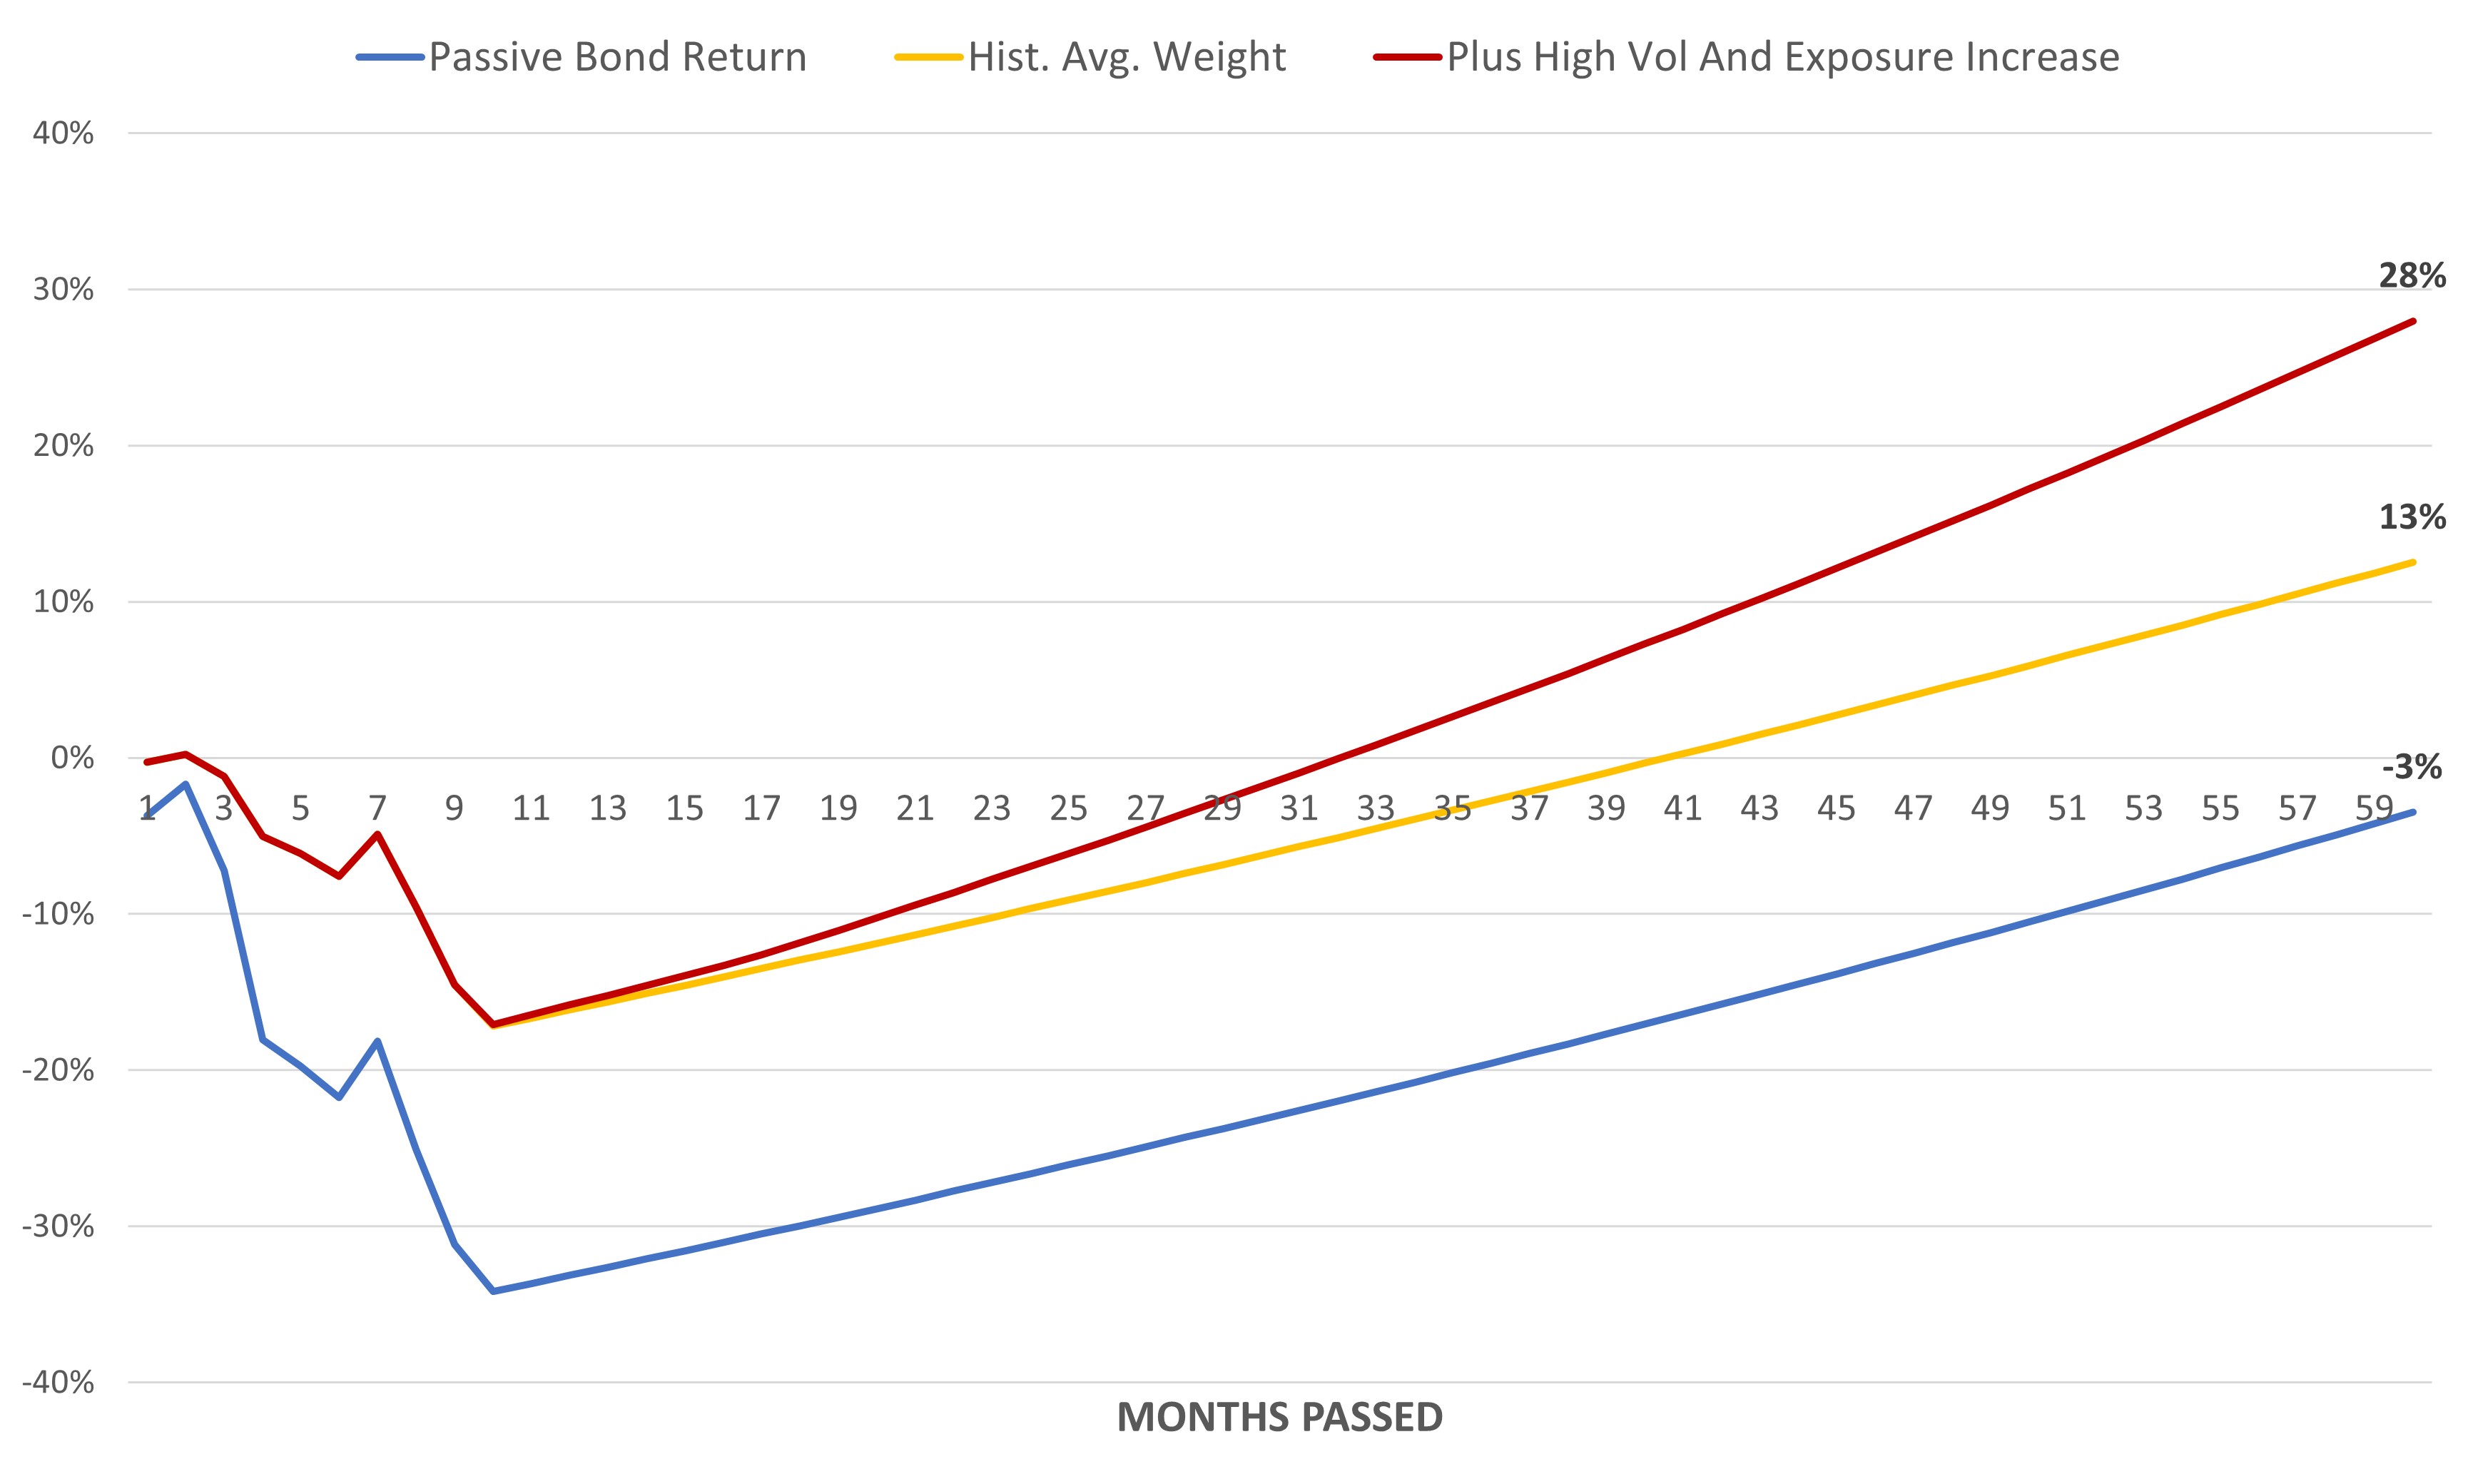
Compared to January of this year, Hedgewise has improved its five-year bond outlook by 13% to 28%, or an annualized 2.5% to 5%. This is a great outcome for any asset class, never mind one during a once-in-a-century crash! Despite that, intuition may still suggest that it would be better if losses were lower or the recovery were faster, but neither is true.
For example, here is the same model with rates peaking at 5% instead of 4%.
Model 4: Rates Rise to 5% Instead of 4%
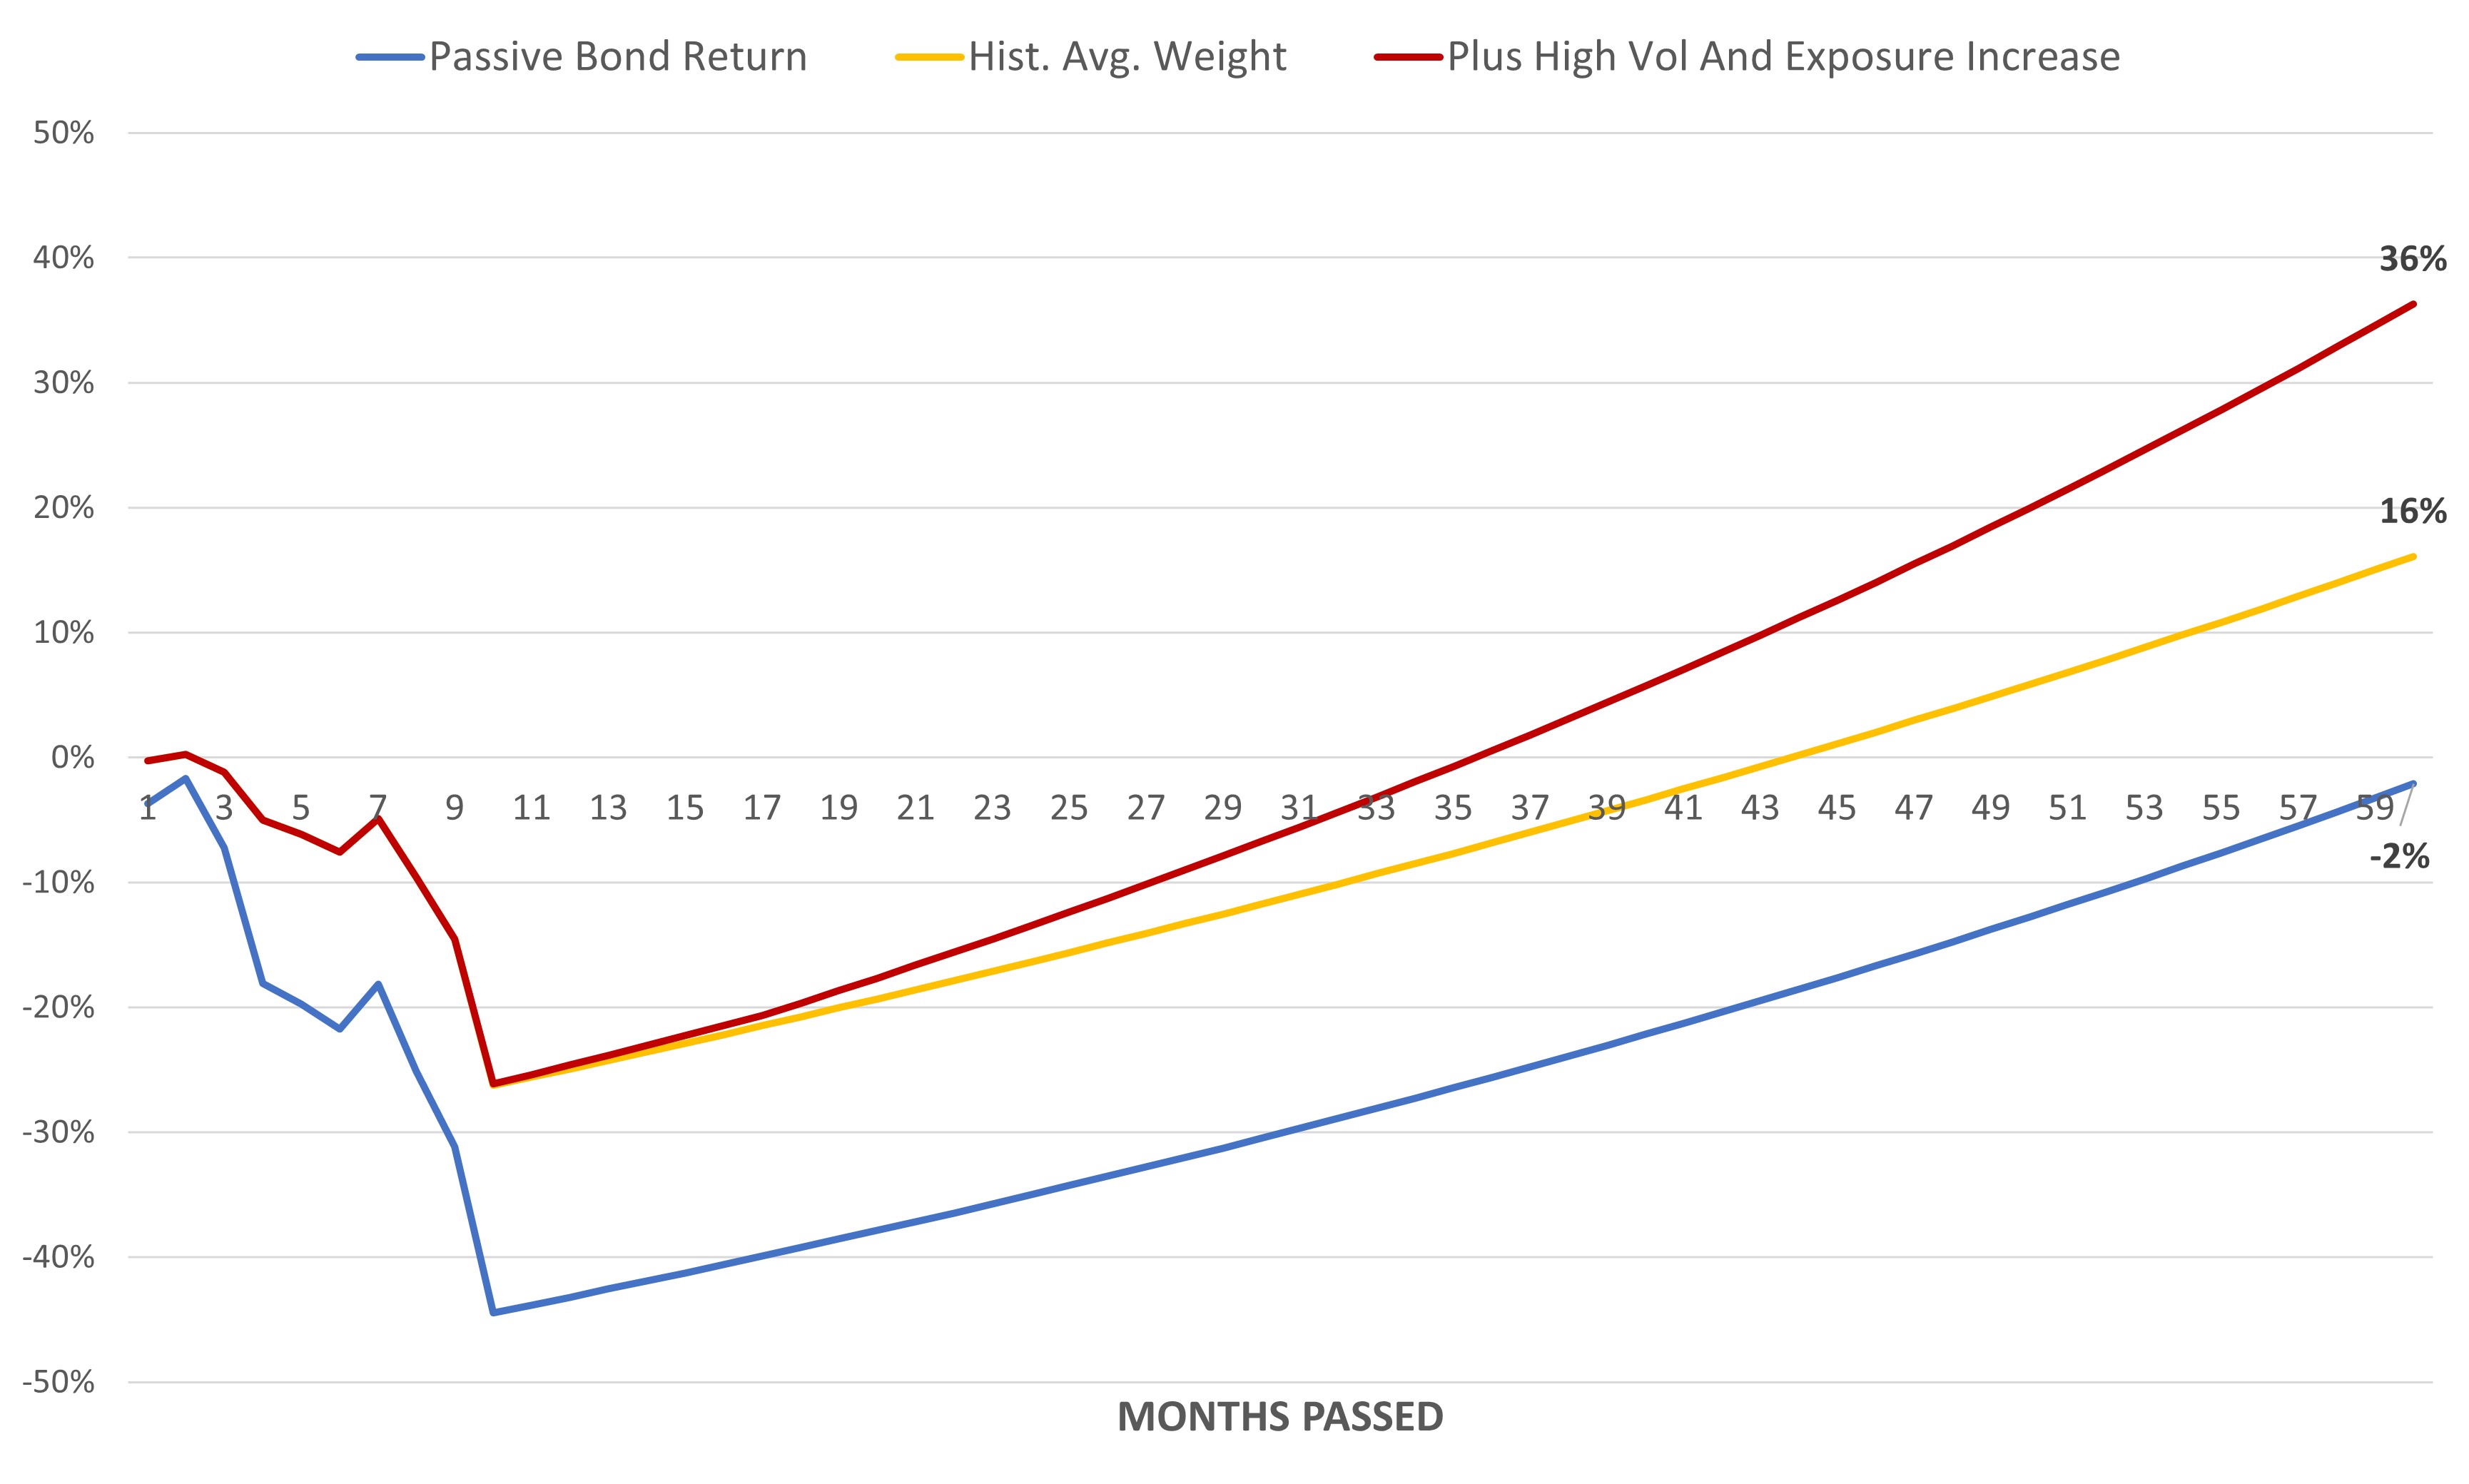
The near-term drawdown increases by 10% while simultaneously improving the five-year outcome. This is weird, but mathematically true! It is better to be paid 5% interest and it improves the chance of adding extra exposure and benefitting from volatility. Your outlook keeps improving as a mirror image to the initial drawdown.
To emphasize this further, the following graph summarizes the expected performance for interest rate peaks of 3% to 7% (the 3% peak assumes that rates fall from their current level to 3% by end of year). These curves assume increased exposure and high bond volatility, but the relative performance would be similar for other assumptions.
Comparing Expected Performance Across Various Interest Rate Peaks
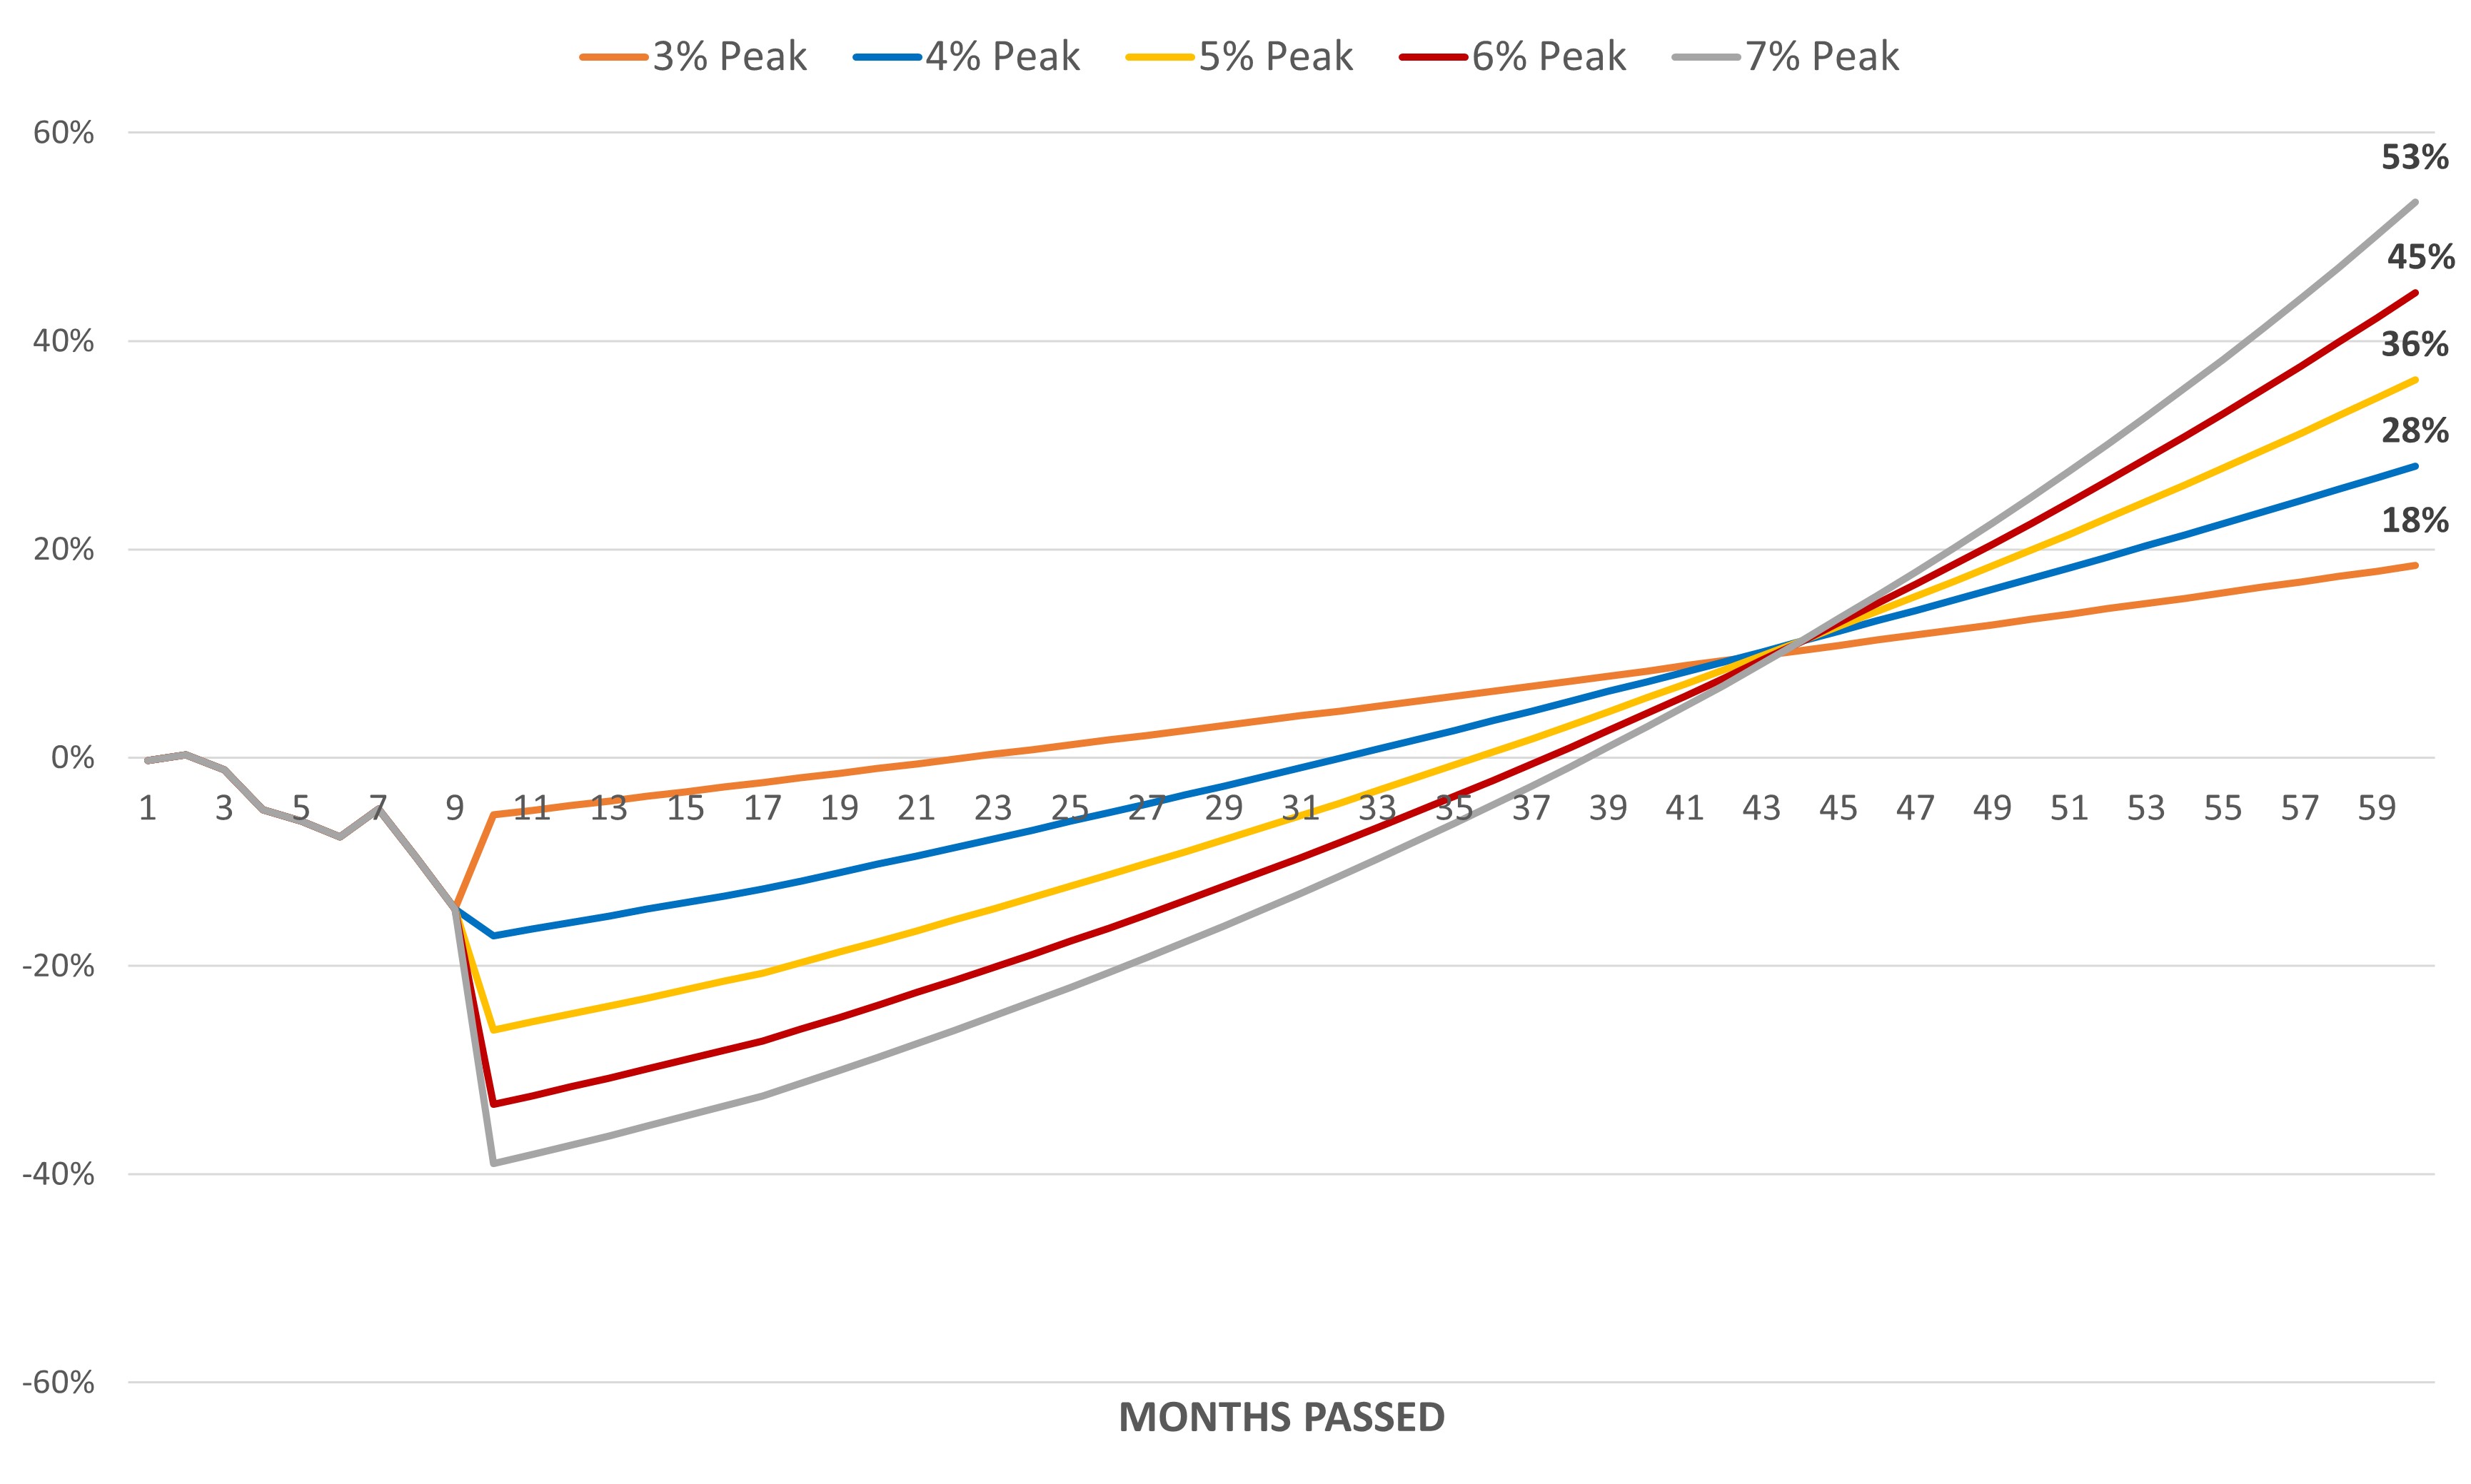
A rational investor should choose a 7% peak, along with a 40% initial drawdown. This would net you 35% in extra gain by the end of five years compared to an immediate recovery in which rates suddenly fell back down to 3%. Also note how all the curves intersect at around the same time, which reinforces how little meaning this interim period carries. Whether we have an instant recovery in bonds or not, you expect to be in a similar place a few years down the road. At that moment, you'll have a whole lot more upside if rates peak higher.
The implications can feel topsy-turvy, but the intuition is basic. It's good if interest rates rise because you can keep adding exposure and getting paid higher coupons. It's the only asset class where losses can be so systematically converted into eventual gains. This year, the five-year outlook for bonds has only gotten better. It just happens to involve a drawdown upfront.
Wrapping Up: Bad News is Good News
The massive price declines across financial markets in 2022 belie the benefits accruing to Hedgewise along the way. Exposure to most asset classes has been near a minimum throughout, which has mitigated the drawdown and maximized the chance of capitalizing on cheaper entry points. Bonds are responsible for most of the current loss, but higher interest rates are being systematically translated into longer-term expected gains. Hedgewise has outperformed passive Risk Parity benchmarks by 15-20% this year, and it is mostly a question of when this will shift into realized profit.
From a big picture perspective, the recovery of this year's drawdown will likely occur in the same 6 to 12 month timeframe regardless of its size. It will happen when rates fall back to the neutral level, and that must eventually occur because they cannot stay restrictive forever. Whether rates have already peaked or go on to rise further, it will not significantly alter the recovery timeline. (i.e., whether rates peak at 4% or 7%, the portfolio breaks even as rates subsequently approach 3%)
Given that, the size of the current drawdown should be interpreted opposite as you'd expect. Bigger and longer losses yield a greater expected gain than smaller and shorter ones, while still breaking even within the same few months. From a long-term perspective, both outcomes are superior to a scenario where markets never dropped at all.
These mechanics are specific to the bond market and rising interest rates, which may be part of the reason the concepts feel foreign. Interest rates have only ever gone lower for the past 40 years. But from a risk management perspective, bond losses are uniquely positive. Unlike equities or commodities, where you can run into periods of pure wealth destruction (e.g., oil prices briefly went negative in 2020), bonds are simply moving around money in time. This dynamic can be exploited to transform drawdowns into gains with greater confidence than any other asset class, but Hedgewise has had little opportunity to do so until this year.
In hindsight, 2022 may very well mark the start of a great new era for risk management.
Disclosure
This information does not constitute investment advice or an offer to invest or to provide management services and is subject to correction, completion and amendment without notice. Hedgewise makes no warranties and is not responsible for your use of this information or for any errors or inaccuracies resulting from your use. Hedgewise may recommend some of the investments mentioned in this article for use in its clients' portfolios. Past performance is no indicator or guarantee of future results. Investing involves risk, including the risk of loss. All performance data shown prior to the inception of each Hedgewise framework (Risk Parity in October 2014, Momentum in November 2016) is based on a hypothetical model and there is no guarantee that such performance could have been achieved in a live portfolio, which would have been affected by material factors including market liquidity, bid-ask spreads, intraday price fluctuations, instrument availability, and interest rates. Model performance data is based on publicly available index or asset price information and all dividend or coupon payments are included and assumed to be reinvested monthly. Hedgewise products have substantially different levels of volatility and exposure to separate risk factors, such as commodity prices and the use of leverage via derivatives, compared to traditional benchmarks like the S&P 500. Any comparisons to benchmarks are provided as a generic baseline for a long-term investment portfolio and do not suggest that Hedgewise products will exhibit similar characteristics. When live client data is shown, it includes all fees, commissions, and other expenses incurred during management. Only performance figures from the earliest live client accounts available or from a composite average of all client accounts are used. Other accounts managed by Hedgewise will have performed slightly differently than the numbers shown for a variety of reasons, though all accounts are managed according to the same underlying strategy model. Hedgewise relies on sophisticated algorithms which present technological risk, including data availability, system uptime and speed, coding errors, and reliance on third party vendors.