


Summary
- The Hedgewise Risk Parity product has outperformed competitive funds by an average of 4.2% in 2018 and 3.3% annually since 2016
- While 'smart beta' products like Risk Parity share a common philosophy, performance can significantly differ due to the strategic and operational approach
- By stripping down the core financial theory to its most essential benefits at the lowest possible cost, Hedgewise has emerged as an industry pioneer and generated consistent outperformance for its clients
A Framework for Evaluating Hedgewise
Two core ideas drive the investment product philosophy at Hedgewise:
- Financial theory can be used to engineer higher returns with lower risk, and
- Great care must be taken during implementation to ensure the concepts are properly represented at a reasonably low cost
To evaluate the first idea, the focus must be on how a broad theory is supposed to work, and whether those assumptions can be validated in the real world. This is the substance of a majority of the research published here, but can only really convince you of whether 'smart beta' concepts like Risk Parity make sense in general. In that regard, it's not as much of a judgment on Hedgewise itself as on the theoretical frameworks being used.
However, the implementation of these frameworks is far more nuanced than constructing indexes like the S&P 500. Managers face questions like how to define risk, how many assets to include in the portfolio, and how often to trade. If the answers are too complex, they can often drive up costs. If the answers are too simple, they can fail to properly implement the theory. These issues will dramatically impact performance across managers.
Given that, the simplest and most direct way to evaluate Hedgewise is to compare its long-term performance to other competitive funds. This is now easy to do for Risk Parity, as there are three large competitive mutual funds (AQR, Invesco, and Wealthfront). Note that Hedgewise data is based on a compilation of live client portfolios at the High risk level, which had the closest level of overall volatility to the other funds, and includes all costs and fees.
Performance Summary Since 2016
| YTD | 2017 | 2016 | Ann. | |
|---|---|---|---|---|
| Hedgewise | 1.7% | 18.2% | 10.8% | 12.9% |
| Avg. Competitor | -2.5% | 13.1% | 10.5% | 9.6% |
| Diff. | +4.2% | +5.1% | +0.3% | +3.3% |
Breakdown by Fund
| YTD | 2017 | 2016 | Ann. | |
|---|---|---|---|---|
| Hedgewise | 1.7% | 18.2% | 10.8% | 12.9% |
| AQR | -0.9% | 16.2% | 11.2% | 10.0% |
| Invesco | 1.3% | 10.0% | 9.7% | 9.1% |
| Wealthfront | -8.0% | N/A | N/A | N/A |
Hedgewise has beaten the competition by over 3% annually since 2016. Over a ten year horizon, this would lead to additional total gains of over 70%.
However, the key to establishing whether Hedgewise deserves credit for this outperformance is to examine the shape of the competitive performance curves. It isn't enough to simply generate a higher return; this must be accomplished strictly within the Risk Parity framework. If the performance of one manager deviated too significantly from the rest, it would suggest that some driver besides the core theory - like manager discretion, for example - was playing an outsized role. This would naturally diminish the benefits of the underlying strategy framework, and introduce new risks to the portfolio that have no relation to Risk Parity itself.
Performance Curves Since 2016
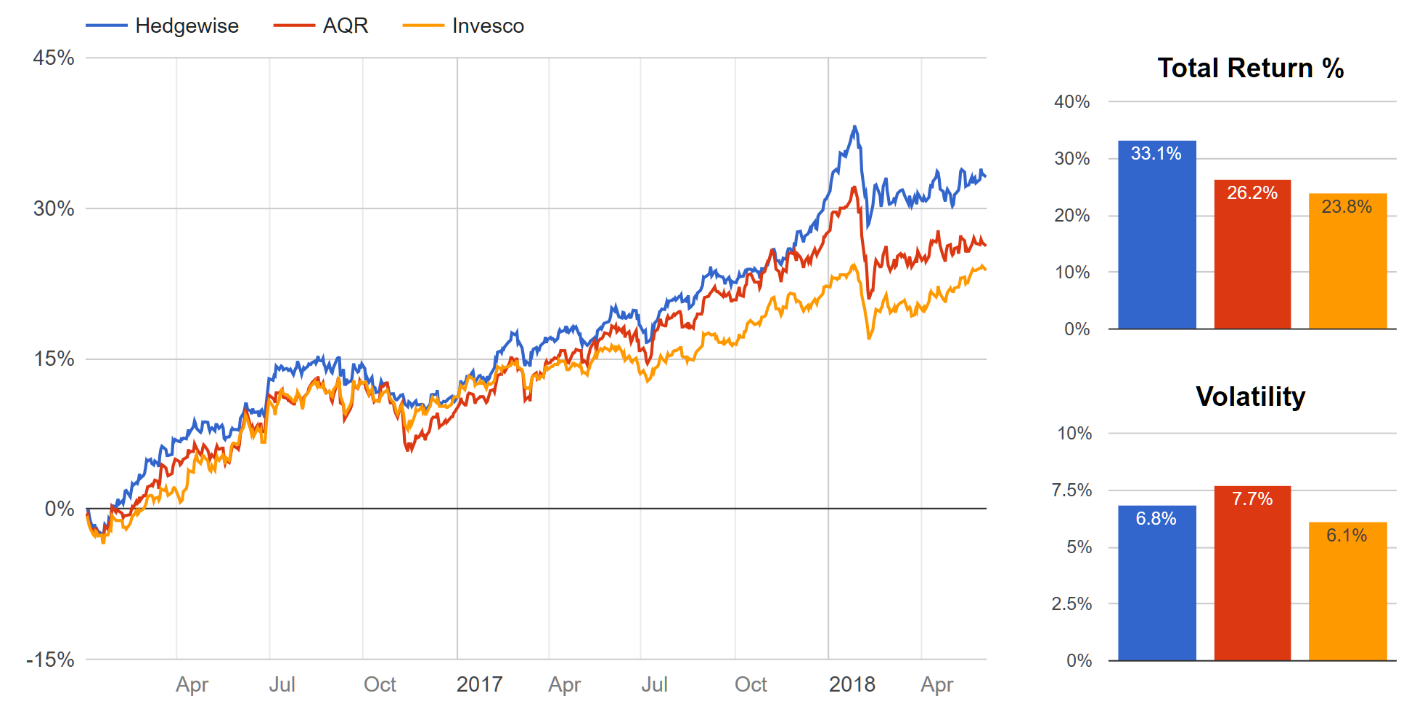
Hedgewise performance is fairly clustered against the competition over the short-term but with a clear edge that widens over the long-term. This kind of pattern is very close to ideal, as it suggests that the Hedgewise approach is successfully capturing the essence of Risk Parity in a superior way.
This is unsurprising since Hedgewise broadly charges lower fees and incurs fewer expenses on behalf of its clients. However, this approach can go quite badly if a manager oversimplifies too much or fails to invest the resources needed to properly define theoretical concepts. Finding this balance is the key to the success of any smart beta product: it must be simple enough operationally, but still conceptually robust.
The relative performance of Hedgewise over the past few years suggests that it has struck just the right balance and provides a tremendous sense of validation. Let's take a deeper look at the core elements of the approach, and how those differ from the competition.
The Difference in Approach
To minimize operational costs, Hedgewise sought to reduce any kind of complexity that would create little or no net benefit. This raised some very significant theoretical questions, like how much value might be gained from investing globally vs. domestically, or from adding more exotic asset classes to the portfolio mix. Research suggested that so long as you had a very accurate understanding of how to define risk itself, you could successfully run the strategy in one single country and with a relatively basic mix of assets. Yet before Hedgewise was founded, this had never been tested and was vastly different from the approach taken by competitive managers.
With the performance now validated, it seems obvious that these concepts are similar to what gave rise to passive investing in the first place. For example, the idea that you don't need to independently value every stock to still include it in a portfolio, or that holding 1,000 stocks instead of 100 doesn't make much difference. Hedgewise is simply refining similar kinds of concepts as they apply to Risk Parity.
However, unlike strictly passive investments such as the S&P 500, smart beta products tend to have more complex dimensions and more theoretical unknowns. For example, the definition of risk plays an enormous role in the Risk Parity framework, and there is no broad consensus on exactly what 'risk' means nor how to calculate it for different asset classes. Defining risk intelligently requires significant research and expertise, and there are many potential performance pitfalls if this is done poorly.
The new Wealthfront Risk Parity fund provides a useful case study. In its white paper, Wealthfront outlines an approach to defining risk that largely equates it with volatility, or how much an asset tends to move up or down every day. However, a key pitfall to this approach is that risky asset classes like equities often have long periods of low volatility. A volatility-driven framework might misinterpret this to mean that stocks have become 'low risk', and then become more vulnerable whenever risk returns.
This pattern would tend to result in losses especially during periods of elevated, choppy volatility - just like the year-to-date pattern in equities thus far in 2018. Though it can't be determined if this is precisely what has happened with Wealthfront since launching this year, its performance is quite consistent with the theoretical outcome. Note that the performance of AQR and Invesco was clustered closely to Hedgewise and omitted for readability.
Wealthfront vs. Hedgewise Risk Parity Daily Performance, 2018 YTD
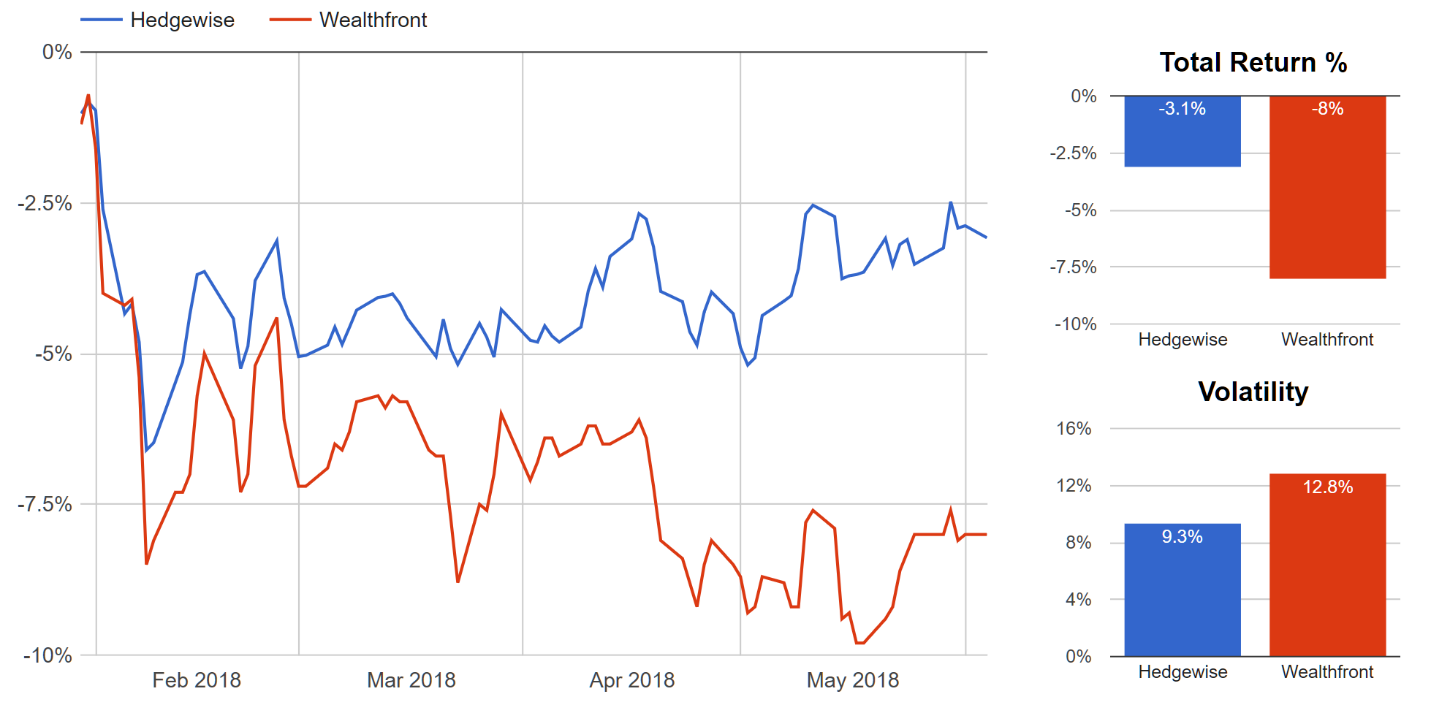
Whether this differential was driven solely by the definition of risk, or some other combination of factors, the most important takeaway is that certain assumptions can have a huge impact on what Risk Parity means and how it performs. Even if the theory itself is entirely valid, different managers will still achieve different results. This is a natural hurdle in the smart beta space, since this makes it harder to separate the strategy from the manager.
Yet these challenges have also provided Hedgewise with the opportunity to demonstrate how powerful the approach can be when it is done well. Risk Parity has tremendous theoretical possibility, but that is diminished if the portfolio is burdened with complexity, expense, or misunderstanding.
Looking Ahead: The Evolution of Smart Beta
The idea of smart beta is still in its relative infancy, but one of the clearest themes to emerge thus far is that the broad ideas can be implemented in dramatically different ways. Some of the lessons from the rise of passive management, like prioritizing simplicity and low-cost, continue to resonate and have formed the basis for much of Hedgewise's outperformance over the past few years. However, it's also obvious that the underlying strategies involve some degree of subjectivity. Over the long-run, any smart beta product will only outperform if there is a real theoretical basis for how it works and a fairly accurate understanding of how to capture the benefit.
It's incredibly exciting to be at a point where there is enough data to identify Hedgewise as a clear leader in Risk Parity, and to see its balanced approach yield exactly the kind of benefits that were predicted.
Disclosure
This information does not constitute investment advice or an offer to invest or to provide management services and is subject to correction, completion and amendment without notice. Hedgewise makes no warranties and is not responsible for your use of this information or for any errors or inaccuracies resulting from your use. Hedgewise may recommend some of the investments mentioned in this article for use in its clients' portfolios. Past performance is no indicator or guarantee of future results. Investing involves risk, including the risk of loss. All performance data shown prior to the inception of each Hedgewise framework (Risk Parity in October 2014, Momentum in November 2016) is based on a hypothetical model and there is no guarantee that such performance could have been achieved in a live portfolio, which would have been affected by material factors including market liquidity, bid-ask spreads, intraday price fluctuations, instrument availability, and interest rates. Model performance data is based on publicly available index or asset price information and all dividend or coupon payments are included and assumed to be reinvested monthly. Hedgewise products have substantially different levels of volatility and exposure to separate risk factors, such as commodity prices and the use of leverage via derivatives, compared to traditional benchmarks like the S&P 500. Any comparisons to benchmarks are provided as a generic baseline for a long-term investment portfolio and do not suggest that Hedgewise products will exhibit similar characteristics. When live client data is shown, it includes all fees, commissions, and other expenses incurred during management. Only performance figures from the earliest live client accounts available or from a composite average of all client accounts are used. Other accounts managed by Hedgewise will have performed slightly differently than the numbers shown for a variety of reasons, though all accounts are managed according to the same underlying strategy model. Hedgewise relies on sophisticated algorithms which present technological risk, including data availability, system uptime and speed, coding errors, and reliance on third party vendors.