


Summary
- Year-to-date, Hedgewise continues to outperform equities as well as most major competitive benchmarks.
- Both the Risk Parity and Momentum frameworks have exceeded the 10% return of the S&P 500 (at comparable risk levels) while maintaining the benefits of risk management.
- Many investors have missed this rally or transitioned to cash for fear of potential negative shocks, but Hedgewise client portfolios remain uniquely prepared for changing market conditions.
- Various strategies have done well in this remarkably calm environment, but few are well-prepared if volatility returns. I've examined some of the largest negative events of the last 50 years to explore how Hedgewise frameworks build in protection.
Bull or Bear Market? Doesn't Matter Much
Since the election last November, I read about one article a day discussing equity outflows, stock bubbles, bond bubbles, and every kind of warning in between. Of course, many raise valid concerns and highlight lots of indicators that suggest a downturn is right around the corner. Despite that, stocks have been on an incredible run, gaining over 10% this year and nearly 20% since November. Unfortunately, an estimated 45% of the country has missed out on it, perhaps in no small part due to the warnings around every corner.
Events like 2008 tend to leave an unforgettable mark on investors, and who can blame them? Yet the possibility of a 50% loss - and the corollary temptation to try and wait for the 'right time' to get in - results in an enormous hidden drag on most portfolios. While most investors naturally use the S&P 500 as a benchmark, that is deceptive if they would never be comfortable using a 100% stock portfolio. This is why I consider risk management techniques to be far more than some absolute return; the extra protection can fundamentally change the ability for many to invest at all.
In my last article, I discussed a few of the underlying theories that drive the construction of Hedgewise portfolios. A significant recurring theme in that research is the ability to use a combination of leverage and risk management to add protection to a portfolio without sacrificing returns. This is a departure from traditional hedging techniques, like covered calls, protective puts, or moving some of your portfolio to cash, which all have a substantial expected cost. 2017 has been a nearly picture-perfect example of this concept in action, as both the Hedgewise Risk Parity and Momentum strategies have outperformed the S&P 500 while still retaining significant downside protection.
However, what most excites me is not the absolute return itself, but rather the success of the risk management techniques underlying it and how those factors continue to provide protection that most traditional portfolios do not. For example, Hedgewise frameworks successfully avoided much of the energy correction in the first half of this year, added copper exposure to better hedge against inflation, and remained patiently overweight in equities despite the incessant political turmoil. These systematically-driven adjustments have driven better performance than major competitive funds this year, but I expect their value to become even clearer when stock volatility inevitably returns.
Year-to-Date Performance Review
Here is how Hedgewise products have performed against every major asset class. This is the composite performance across all live clients in Risk Parity or Momentum at the "Max" risk level, which uses a similar target volatility to the S&P 500. All fees and costs have been included.
2017 YTD Performance of Hedgewise Products vs. Major Asset Classes
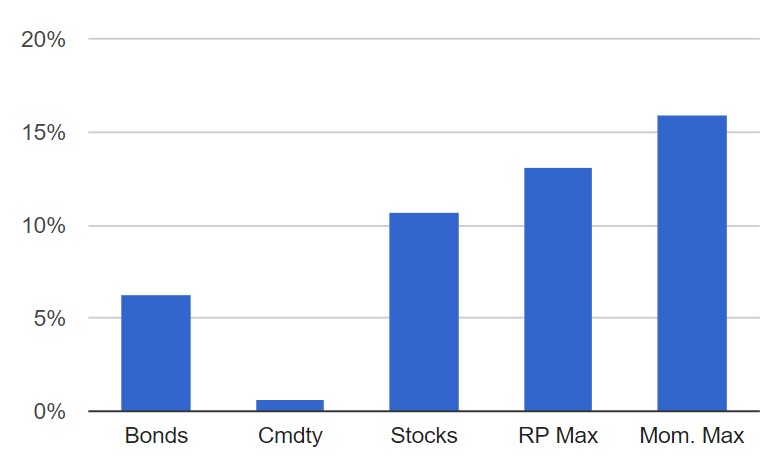
This performance is particularly notable for Risk Parity, which has beaten stocks despite a significant allocation to bonds and commodities. Momentum has remained heavily weighted to equities throughout the year, ignoring the political noise that has had little long-term impact on the trend.
Hedgewise products have also outperformed most major competitive benchmarks, such as the iShares Core Allocation Funds (AOK, AOM, AOA), the PowerShares and Cambria Momentum Funds (PDP, GMOM), and the AQR and Invesco Risk Parity Mutual Funds (AQRNX, ABRYX).
Hedgewise YTD Performance vs. Comparable Traditional Benchmarks
| Product | YTD | Benchmark (Ticker) |
|---|---|---|
| RP Med. | 7.5% | 5.5% (AOK) |
| RP High | 9.4% | 6.45% (AOM) |
| RP Max | 12.7% | 10.65% (AOA) |
| MM Max | 15.7% | 14.26% (PDP) |
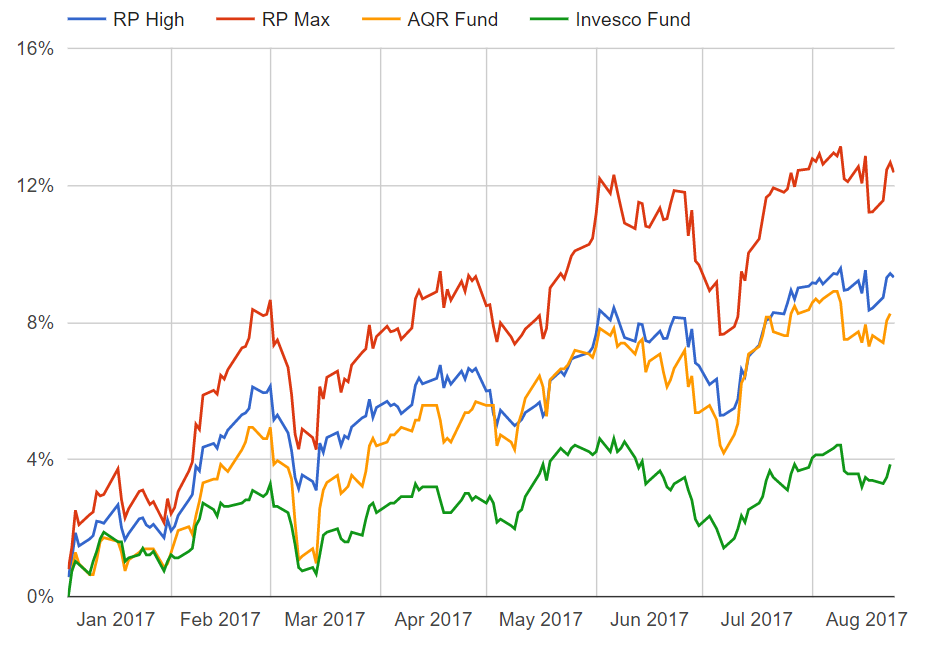
Hedgewise YTD Performance vs. Risk Parity Mutual Funds
Hedgewise YTD Performance vs. Momentum ETFs
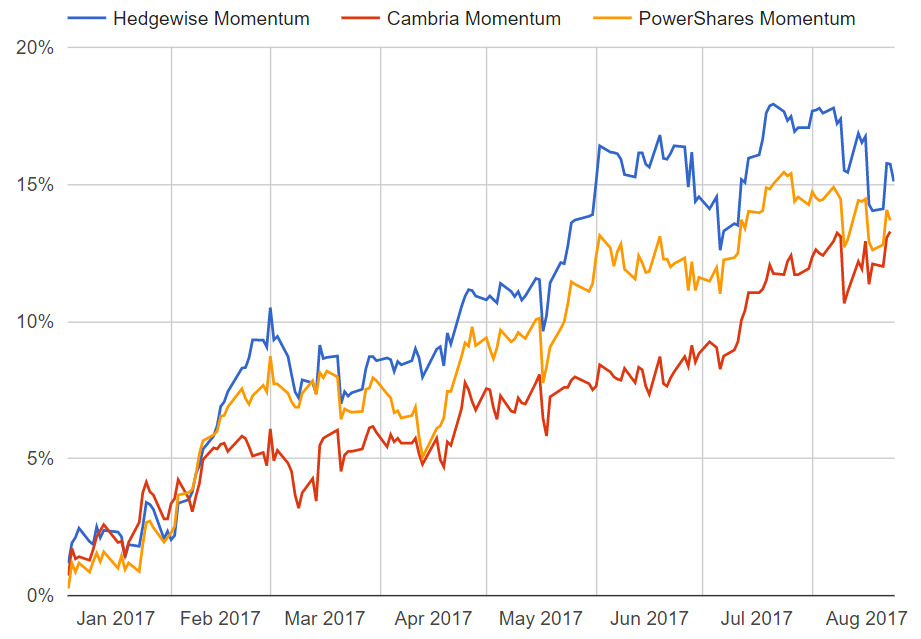
Across every dimension, Hedgewise products have consistently outperformed. While this is very exciting, many of the competitive funds - especially in the Momentum space - are not built with the same level of downside protection. The value of this protection will only become evident during a sustained, multi-month equity drawdown event. Since that hasn't happened recently, we can model history to get a better sense of what this might mean.
Preparing for Shocks: What to Expect in the Next Correction?
Quantitative frameworks like Risk Parity and Momentum can be difficult to evaluate because fund managers often run them quite differently. Above, you can see that despite a high level of correlation, the Invesco Risk Parity fund has returned about 4% this year compared to more than double that for Hedgewise. While that is relatively easy to evaluate, differences are often more muted in normal market conditions. For example, almost every variation of Momentum has had a relatively good year.
The problem with many quantitative frameworks is that they work only within an asset class rather than across multiple asset classes. In the case of Momentum, many strategies invest in the top trending equities at any point in time, but would never invest in a separate asset class like bonds. This can work very well so long as equities as a whole are trending up - a rising tide lifts all boats. In a severe market correction, though, such techniques often provide little protection.
To get a sense of this, I examined the performance of the PowerShares Momentum ETF (PDP), one of the oldest public frameworks available, during the last recession. I also compared this to the simulated model results of the Hedgewise Momentum strategy set at a similar level of risk.
PowerShares Momentum ETF (PDP) vs. Hedgewise Momentum Model, 2007 to 2009
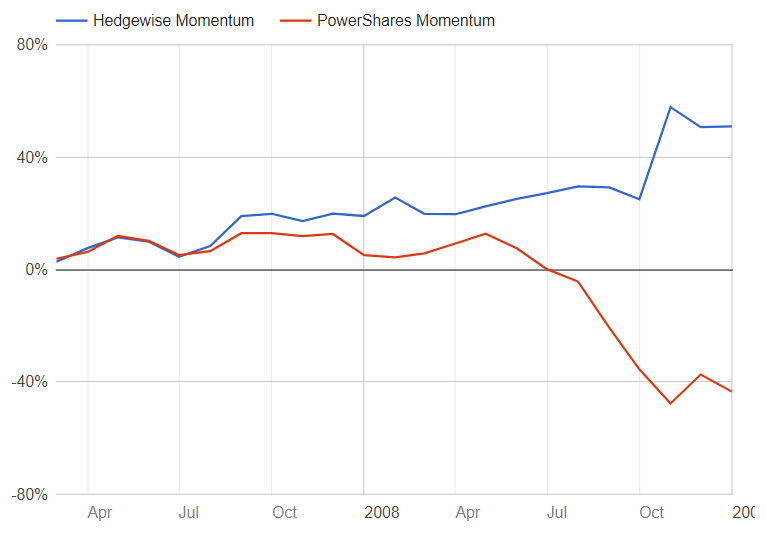
The simple explanation for this enormous difference in performance is that the Hedgewise model moved entirely into bonds prior to the recession, while PDP is limited to always being 100% equities by rule. To be clear, there is absolutely no guarantee that the Hedgewise framework will always catch such events. Yet at least it has a chance to get out of the way, while frameworks like PDP are limited by definition.
Again, there remain a wide range of events in which Hedgewise could not avoid losses, and 2008 performance is more of an exception than the rule. But the strategy frameworks are entirely built with these kinds of events in mind. To get a better sense of the range of likely outcomes, I examined the worst equity pullbacks since the 1970s to see how Risk Parity and Momentum held up (both set to the Max risk level).
Historical Performance of Hedgewise Momentum and Risk Parity Models
| Period | Stocks | Mom. | RP |
|---|---|---|---|
| Aug. 08 - Nov. 08 | -34.5% | 24.1% | 1.2% |
| Jun. 74 - Nov. 74 | -27.7% | 1.3% | -9.1% |
| Aug. 87 - Nov. 87 | -26.1% | -22.2% | -6.5% |
| Mar. 02 - Jul. 02 | -21.2% | 3.2% | 7.7% |
| Jul. 11 - Sep. 11 | -17.5% | -3.1% | 10.2% |
| Jul. 01 - Sep. 01 | -15.7% | 9% | 8.6% |
| Jun. 98 - Sep. 98 | -13.8% | -10.3% | 14.1% |
Across the board, both Hedgewise models consistently outperformed equities over the course of these "worst case" events. There will absolutely be some years, like 1987 or 1998, in which losses are inevitable. If you can successfully hedge even a few of these events, though, the impact on your long-run return will be enormous. Yet this will only be possible if you are using a quantitative framework that is focused on this type of risk.
The important hidden advantage of this approach is how it can shift your mentality as an investor outside of the raw returns. Once you know that a sophisticated quantitative approach is doing everything it can to manage timing risk for you, you can pay far less heed to the hundreds of warnings in the news every day. You won't avoid every loss, but you gain the confidence to stay patient regardless as the probabilities are engineered to be heavily tilted in your favor.
Looking Forward: Late-Cycle Environment
It would be unrealistic to expect the low volatility and stable positive returns of the past year to continue unabated. There's a good chance we will remain in a 'late-cycle' environment for the foreseeable future, which means that the economy will grow fast enough for the Fed to be concerned about inflation, but investors will stay nervous that growth is slowing down or that some geopolitical shock will throw everything into disarray. Against this backdrop, I'd expect quite a bit of chop across all asset classes, but it's unlikely that much of it will be meaningful. Both Hedgewise frameworks remain excellent choices for such an environment, regardless of short-term returns.
While I don't see any major systemic financial risks currently unfolding, I'm far less nervous about that possibility than most since Hedgewise frameworks have been so carefully constructed to account for it. In a sense, this bull market has actually been a challenging stretch because investors may fail to see the value of risk management when stocks continue to do so well. Fortunately, Hedgewise techniques are built to weather all kinds of conditions, and have consistently outperformed equities regardless. Whenever the next bear market does unfold, it will be exciting to observe what I expect to be an even bigger difference between Hedgewise and most traditional benchmarks.
Disclosure
This information does not constitute investment advice or an offer to invest or to provide management services and is subject to correction, completion and amendment without notice. Hedgewise makes no warranties and is not responsible for your use of this information or for any errors or inaccuracies resulting from your use. Hedgewise may recommend some of the investments mentioned in this article for use in its clients' portfolios. Past performance is no indicator or guarantee of future results. Investing involves risk, including the risk of loss. All performance data shown prior to the inception of each Hedgewise framework (Risk Parity in October 2014, Momentum in November 2016) is based on a hypothetical model and there is no guarantee that such performance could have been achieved in a live portfolio, which would have been affected by material factors including market liquidity, bid-ask spreads, intraday price fluctuations, instrument availability, and interest rates. Model performance data is based on publicly available index or asset price information and all dividend or coupon payments are included and assumed to be reinvested monthly. Hedgewise products have substantially different levels of volatility and exposure to separate risk factors, such as commodity prices and the use of leverage via derivatives, compared to traditional benchmarks like the S&P 500. Any comparisons to benchmarks are provided as a generic baseline for a long-term investment portfolio and do not suggest that Hedgewise products will exhibit similar characteristics. When live client data is shown, it includes all fees, commissions, and other expenses incurred during management. Only performance figures from the earliest live client accounts available or from a composite average of all client accounts are used. Other accounts managed by Hedgewise will have performed slightly differently than the numbers shown for a variety of reasons, though all accounts are managed according to the same underlying strategy model. Hedgewise relies on sophisticated algorithms which present technological risk, including data availability, system uptime and speed, coding errors, and reliance on third party vendors.