


- Many remain convinced that bonds should no longer be part of a diversified portfolio in a rising interest environment.
- To refute this, we recently showed how a portfolio mix of 60% bonds / 40% stocks outperformed a 100% equities portfolio from 1954 through 1982, even though interest rates soared from 2% to over 15%.
- However, skeptics insist that equities are still superior over a long enough time horizon, and that diversifying with bonds is too risky because it requires the use of leverage.
- We'll prove that a diversified portfolio still outperformed even in the very worst bond bear market in history, and without the use of any leverage whatsoever.
- If your portfolio is currently 100% equities or cash, you are almost guaranteed to underperform over the long run.
Introduction: Keeping Your Free Lunch
Diversification is often referred to as the single true 'free lunch' in finance, meaning it is one of the only guaranteed ways that you can boost your return and reduce your risk. No matter what. No strings attached.
Yet, the concept is persistently challenged by most of the investing public. With interest rates at historic lows and stocks near historic highs, it is easy to see the appeal of cash or a conservative 'blue chip' portfolio. Still, diversification is supposed to work regardless, and never calls for any sudden adjustments. It is supposed to sustain major crashes without sacrificing your return.
But how can it be better to hold a crashing asset rather than to avoid it?
It is a good question, and the answer is both simple and counterintuitive. A crash doesn't hurt you if you have something to offset it. Some things go up, others go down, and you make money either way.
Could you make even more money if you avoided what went down? Yes, but this also requires that you are always right and that you are timing the market. Make one wrong call, and you will quickly be in bad shape. Diversification will tend to beat you without any effort at all.
In our last article, we studied how a portfolio of 60% bonds / 40% stocks still outperformed from 1954 to 1982, despite many major crashes in the bond market. However, such a portfolio assumed that you could use leverage, which is unrealistic for many people.
By more deeply understanding diversification, though, you can adjust the portfolio mix to no longer require leverage while maintaining all of the benefits. We'll break all of this down in the rest of this article, but for the impatient among you, it only requires one simple adjustment.
Just add 10% commodities to your mix. Preferably inflation-sensitive commodities, like gold or oil. Rather than 60% bonds / 40% stocks, you would have 60% bonds / 30% stocks / 10% commodities.
This simple mix has managed to nearly match the performance of the stock market at half the risk in nearly every decade that data is available. This includes the 1970s, which we will study in detail since bonds were performing so badly during this period. We'll also examine how it performed through the decades following to better dispel the notion that 'equities are always better if you wait long enough'.
It's not magic. It's just your free lunch.
Diversification: What It Is and What It Isn't
Diversification helps passive investors achieve a more stable return with a lower chance of losing money in any given year.
Let's unpack this a bit. Passive means that you do not have to predict the future, and that it does not require any active decision-making to manage the portfolio. It places value on stability, with the assumption that an investor would prefer a guaranteed return to a riskier one. It also assumes the future is uncertain, and that any asset has the potential to lose money over even a very long timeframe.
There are two common arguments that attempt to discredit the value of diversification which we'd like to address upfront: first, that active management will consistently outperform any passive strategy, and second, that there is no need to worry about 'risk' if you just wait long enough.
Active management only has the ability to reduce risk and increase returns if you are very consistently right about what the markets are going to do. Even if you are one of the few that is able to do this well, it takes an extraordinary amount of time and effort, and it only takes one bad run to ruin years of good ones. If you do not have the certainty, knowledge, time, and energy to be actively managing your portfolio, then a passive approach obviously makes sense.
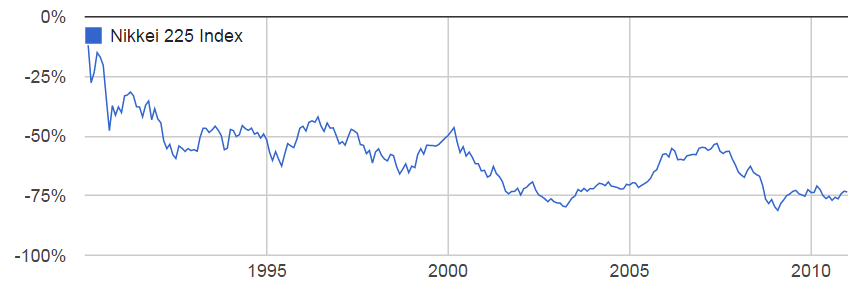
The second argument is usually applied to stocks, with the idea that there is no risk of losing money so long as you can wait twenty or thirty years and you do not realize losses in between. The simple fact is that many people cannot afford waiting so long, and often need access to their money in the interim. There is also the emotional toll of seeing a huge loss in your portfolio, which often causes people to become more risk-averse. Finally, and most importantly, there are many very long stretches of time in all kinds of different markets where investors have still lost money. The Japanese stock market provides one of the most notable examples.
Performance of the Japanese Stock Market, 1990 through 2010
The key point here is that uncertainty always exists. It isn't certain that bonds are going to lose money over the next decade, or that stocks are going to boom. If you are already assuming one or the other, you have to accept that this is a form of active management and there is the possibility that you are wrong.
Applying Diversification: Why 60% Bonds/30% Stocks/10% Gold?
If you accept this uncertainty, the focus becomes on creating a portfolio that has the best chance to make money no matter what happens next.
The effect of diversification is maximized when the assets in your portfolio have a good chance of offsetting one another. Ideally, they'd tend to move in opposite directions (i.e., negative correlation), and in roughly similar amounts.
Since correlations can change, though, it is difficult to identify the exact right mix at any point in time. The good news is that you don't need to be exactly right to still get a huge benefit; you can use a couple of basic rules of thumb and still see a dramatic improvement in performance.
To prove this, we're keeping our assumptions incredibly simple and unchanging. We will use three different asset classes that generally tend to be uncorrelated - bonds, stocks, and commodities. We will then fix their weights roughly based on their relative historical volatilities (to increase the chance they will offset one another).
The S&P 500 index will be our benchmark for stocks. We will use 20yr nominal Treasury bonds to show that even long maturity bonds - which do horribly when interest rates rise - have a place in your portfolio regardless. Finally, we will use gold to represent commodities, primarily due to data availability (Note that oil, food, and other assets also experienced a spike in price during this timeframe, so this is somewhat interchangeable).
To get to our final mix of 60% bonds / 30% stocks / 10% gold, we assume that gold is about 3x volatile as stocks, which are about 2x as volatile as bonds. Really basic stuff. (for readers of our past work, note that adding gold is a way of increasing the 'risk' of the portfolio as an alternative to using leverage)
Now we'll study how this mix did - without ever changing - from 1970 onward, which is the earliest point that gold pricing data was available.
Comparing Performance: Diversification Still Wins
As a quick refresher, the interest rates on 20yr bonds started around 7% in 1970 and reached a peak over 15% in 1981. As you'd expect, 20yr bonds performed quite poorly over this period, frequently experiencing large losses.
So a portfolio of 60% bonds did horribly, right? Guess again.
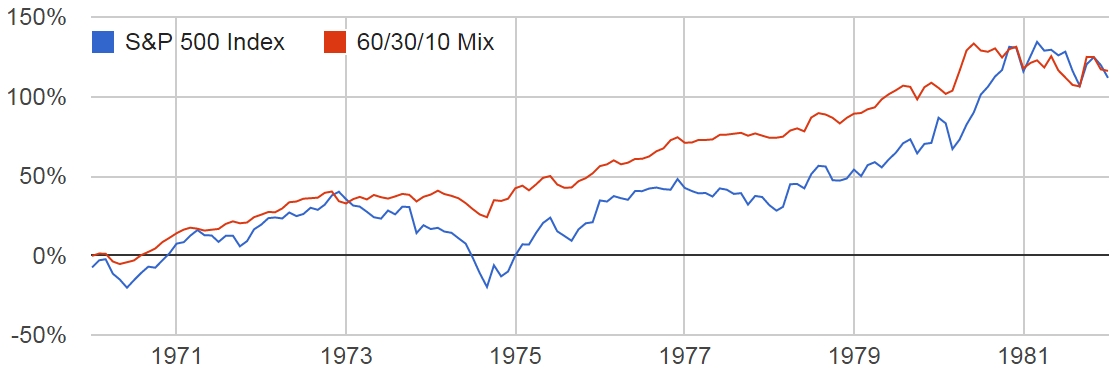
Performance of S&P 500 vs. 60/30/10 Mix, January 1970 through January 1982
Here's another view showing the relative return vs. risk of the portfolios (a.k.a the Sharpe Ratios).
Relative Return Versus Risk
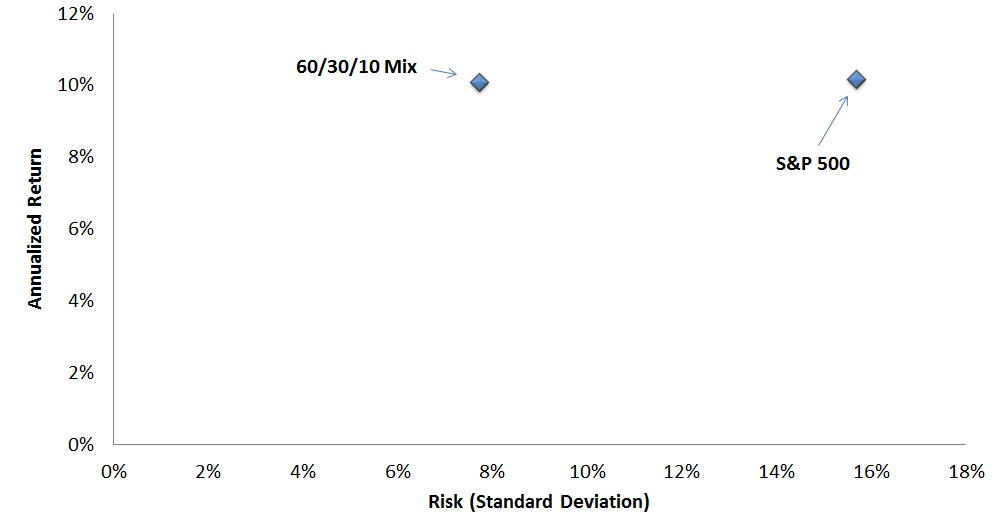
The diversified mix didn't just keep up with stocks - it did it at half the risk.
How could this be?
The answer brings us back to the very fundamentals of the theory. When interest rates are rising this quickly, and bonds are doing this badly, it can only be because of rapid inflation, which will depreciate the dollar and cause hard assets, like gold, to rally. If you diversify correctly, you don't need to worry about something crashing because you own something else that will offset it.
Still, wouldn't you have done better if you had just owned gold and stocks, or even just gold alone?
While the answer is 'of course', consider recommending a portfolio of 50% or even 100% gold right now. You would need some extreme conviction. By just using gold to diversify instead, you were able to achieve great performance without needing to make any bets at all.
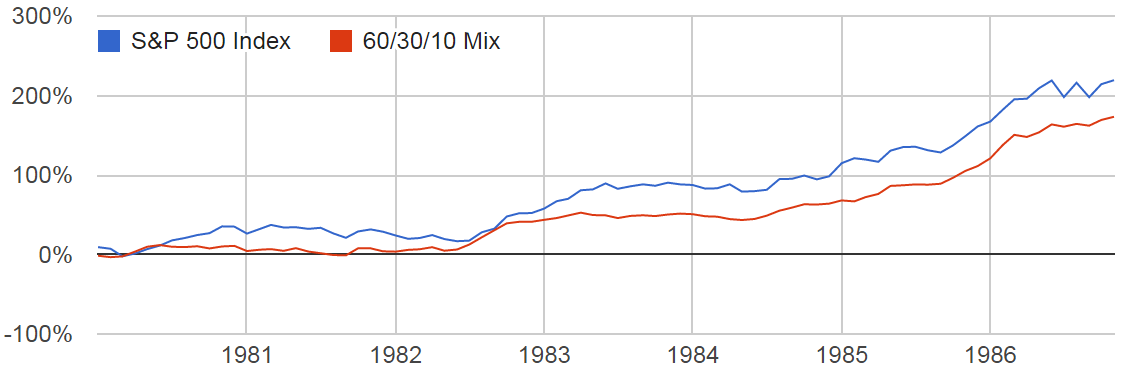
You also would have needed to time when to exit gold, which very promptly collapsed and returned almost nothing for the next 20 years. Our diversified mix, however, continued to hold up through the decades (Note that 20yr bond data is unavailable from 1986 through 1994, so we have left that period out).
Performance of S&P 500 vs. 60/30/10 Mix, January 1982 through January 1986
Performance of S&P 500 vs. 60/30/10 Mix, January 1994 through January 2015
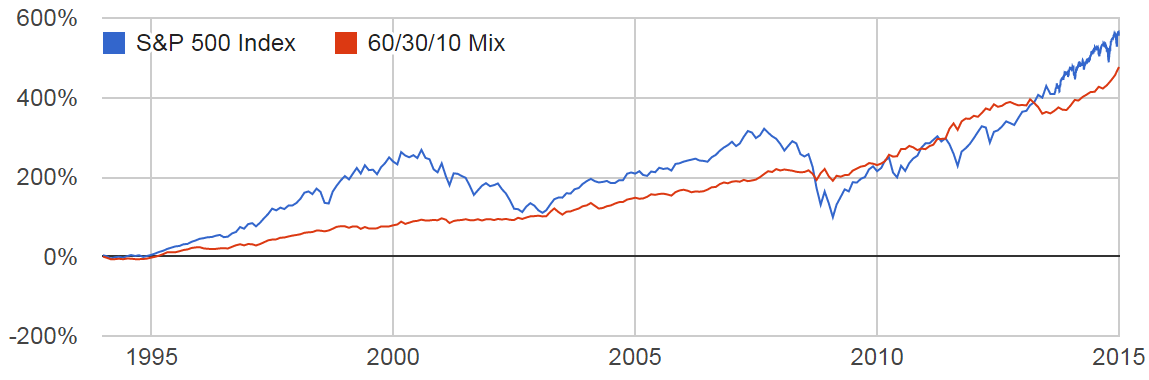
The mix has proven amazingly resilient for being such a simple portfolio. It is nearly the textbook model of what you'd want out of diversification - slow and steady upward returns with little risk of loss over nearly 40 years.
Has the stock market outperformed over stretches? Absolutely. It also had two major crashes in 2001 and 2008, and is now in 8th year of a bull market. Are you sure you wouldn't prefer a similar return with much less risk?
Other Caveats: Should You Use This Exact Portfolio?
There are a few significant limitations to this analysis, many of which have already been highlighted, that make it unlikely this will be the exact 'optimal' mix. However, if you are comparing it to a 100% equity alternative, it is absolutely a good starting place.
We purposefully kept it simple and did not take advantage of several readily available tactics that we use in our own client accounts. There are only three assets. There is no leverage being used. There are no advanced analytics. There is no shifting of weights over time. All of these elements could make it even smarter - but you don't need them to still do better than a non-diversified portfolio.
If you are looking for an immediately accessible recommendation, it is extremely likely that a more even mix of stocks and bonds will continue to provide the same benefits shown here. However, if you are uncomfortable with this, consider layering on a smaller amount anyway. For example, 70% stocks / 20% bonds / 10% gold is still much better than no diversification at all - just realize that you are making an 'active' bet by shifting your assets towards stocks.
Conclusion: Diversification Works
We've now demonstrated two different, diversified, bond-heavy portfolios that have matched the performance of the stock market even when interest rates were rising rapidly. Moreover, they have matched this performance with significantly less risk.
The first was 60% bonds / 40% stocks, and used leverage to adjust the performance upward. The second was 60% bonds / 30% stocks/ 10% gold, and didn't need any leverage at all. Both portfolios exhibited a dramatically improved return-to-risk ratio compared to stocks alone, and the ability to maintain this performance across multiple decades.
These portfolios achieved this despite being quite handicapped with an unchanging portfolio mix and only two or three asset classes.
Hopefully, that's enough to make you second guess the recommendations of 'all stock' or 'all cash', and continue diversifying no matter the economic environment. If it isn't, though, we'd love to know what else is holding you back.
Disclosure
This information does not constitute investment advice or an offer to invest or to provide management services and is subject to correction, completion and amendment without notice. Hedgewise makes no warranties and is not responsible for your use of this information or for any errors or inaccuracies resulting from your use. Hedgewise may recommend some of the investments mentioned in this article for use in its clients' portfolios. Past performance is no indicator or guarantee of future results. Investing involves risk, including the risk of loss. All performance data shown prior to the inception of each Hedgewise framework (Risk Parity in October 2014, Momentum in November 2016) is based on a hypothetical model and there is no guarantee that such performance could have been achieved in a live portfolio, which would have been affected by material factors including market liquidity, bid-ask spreads, intraday price fluctuations, instrument availability, and interest rates. Model performance data is based on publicly available index or asset price information and all dividend or coupon payments are included and assumed to be reinvested monthly. Hedgewise products have substantially different levels of volatility and exposure to separate risk factors, such as commodity prices and the use of leverage via derivatives, compared to traditional benchmarks like the S&P 500. Any comparisons to benchmarks are provided as a generic baseline for a long-term investment portfolio and do not suggest that Hedgewise products will exhibit similar characteristics. When live client data is shown, it includes all fees, commissions, and other expenses incurred during management. Only performance figures from the earliest live client accounts available or from a composite average of all client accounts are used. Other accounts managed by Hedgewise will have performed slightly differently than the numbers shown for a variety of reasons, though all accounts are managed according to the same underlying strategy model. Hedgewise relies on sophisticated algorithms which present technological risk, including data availability, system uptime and speed, coding errors, and reliance on third party vendors.