


Summary
- Hedgewise has significantly rebounded from the losses of last year, with gains of nearly 20% since the bottom reached last Christmas Eve (for products at the Max risk level).
- Unlike most traditional investment strategies, Hedgewise gains have not been driven by stocks, which remain extremely volatile. This provides a significantly safer outlook for clients moving forward, which has been clearly displayed during recent equity pullbacks.
- It's useful to step back and evaluate the broad effectiveness of the Hedgewise approach over the past few years, as performance during 2018 and 2019 has often "felt" unsteady. However, Hedgewise has effectively kept up with stocks and significantly outperformed bonds since 2016 despite the recent challenges.
- With the events of last year behind us, there's a very high chance that relative performance will be even more impressive moving forward.
Introduction
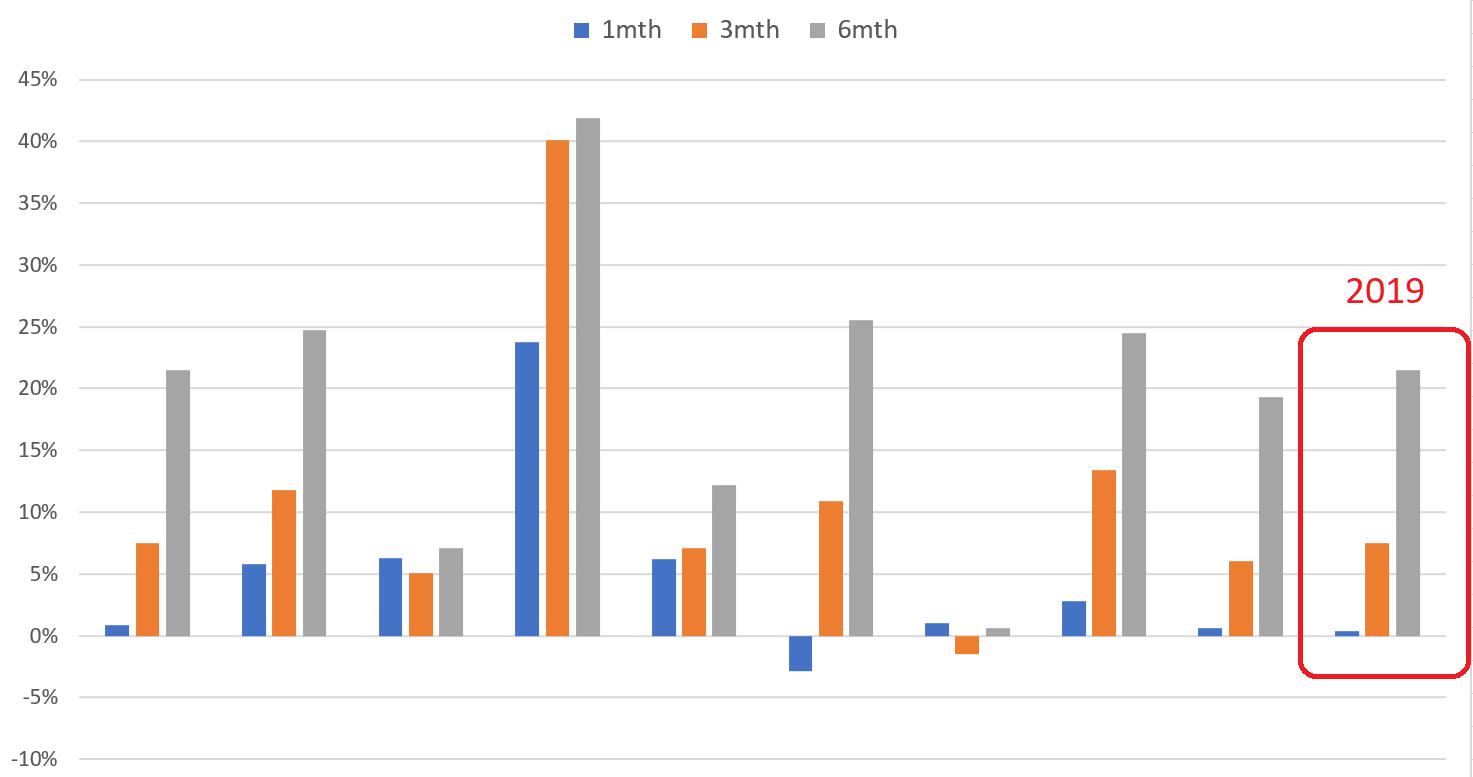
Amidst the turmoil at the end of last year, Hedgewise advised clients to remain patient and await the inevitable recovery, as the cross-asset drawdown could not fundamentally persist. Fast forward to today, and all Hedgewise products have rebounded substantially from their lows. At the Max risk level, both Risk Parity and Momentum have gained close to 20% since their bottoms on Christmas Eve last year. This is right in line with expectations after periods of similar drawdowns caused by Fed uncertainty, which can be seen in the following graph which exhibits all 1 month, 3 month, and 6 month realized forward returns after every comparable stretch since 1972. The outcome from this year is circled in red, with the "6mth" data point representing January to July 2019.
Risk Parity Subsequent Returns After Fed-Induced Drawdowns (1972 Onward)
Momentum Subsequent Returns After Fed-Induced Drawdowns (1972 Onward)
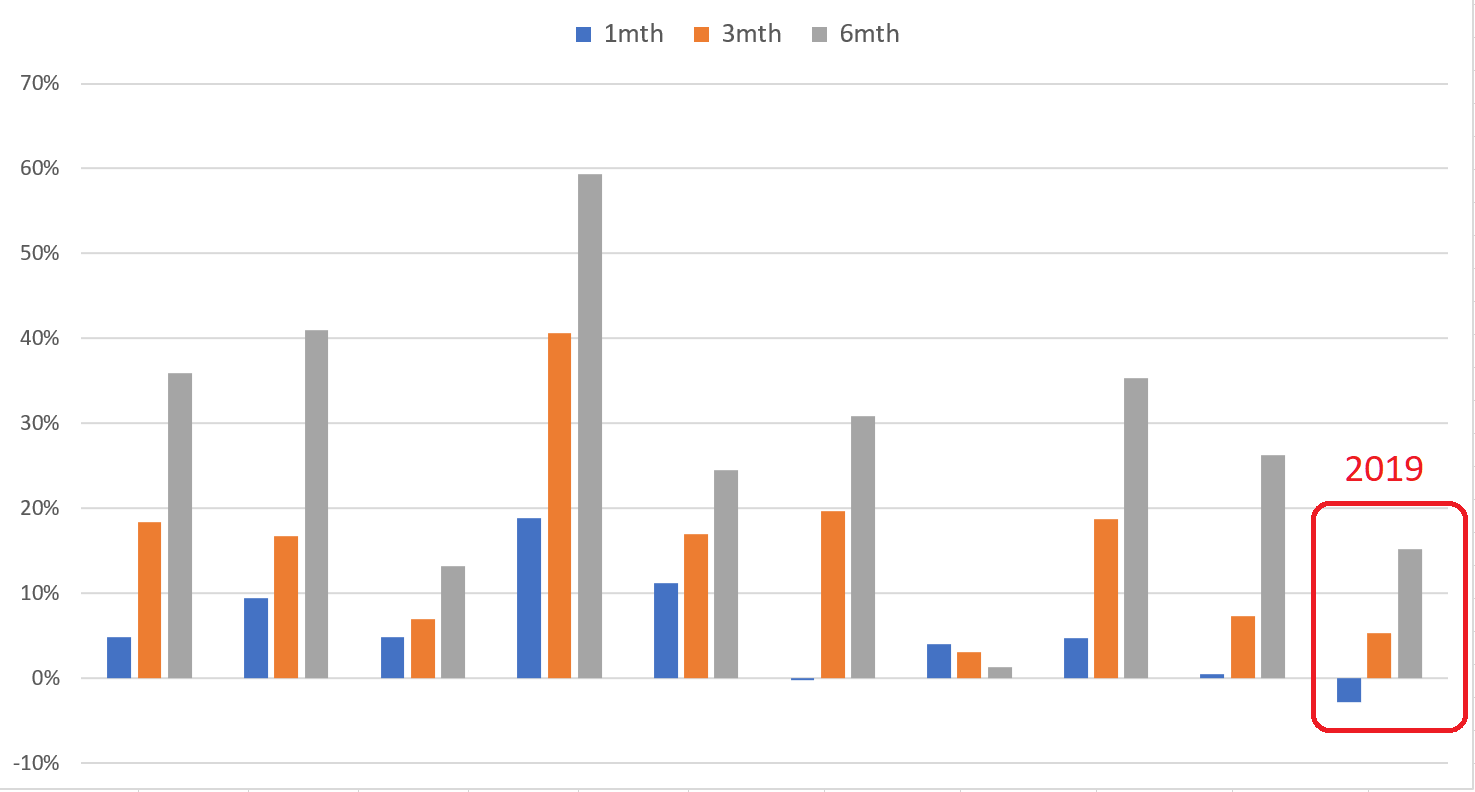
This outcome highlights the resilience of the Hedgewise strategy, and emphasizes the importance of holding steady during drawdowns. While these results are impressive, they are also rather average historically; there were plenty of times where you had even higher returns after a year like 2018. Before we dive into that further, it's important to emphasize the implication: a 20% recovery in 6 months still represents a relatively middling result. That's certainly comforting in the broader scheme!
Of course, it would be nice if returns were even higher, and there have been a couple of limiting factors this year. First, Hedgewise has had limited exposure to equities because they remained extremely volatile. Second, especially in the last two months, risk has spiked across all asset types, leading Hedgewise to adopt a relatively conservative overall portfolio mix. While this is consistent with how these frameworks are supposed to function, it is easy to feel disappointed whenever you miss a short-term rally. It can be helpful to step back and evaluate the longer-term trade-offs that are constantly in play.
Risk Isn't a Problem, Until It Is
A common adage in risk management is that you purposefully forego potential upside to protect from downside. While this may seem intuitive in theory and over the long run, 2019 has highlighted how challenging this can be over the short run. For example, in the first quarter of this year, equity markets were flashing a reasonably high risk of recession; as a result, Hedgewise limited its exposure. By March, it became clear that the economy was stabilizing, and equities staged a historic recovery. This sequence may create the sense that risk-managed frameworks are doing a pretty terrible job timing the markets (Note that Momentum moves entirely out of stocks in times of elevated risk, while Risk Parity shifts exposure but always holds a mix of all asset classes).
Hedgewise Performance Comparison, January to March 2018
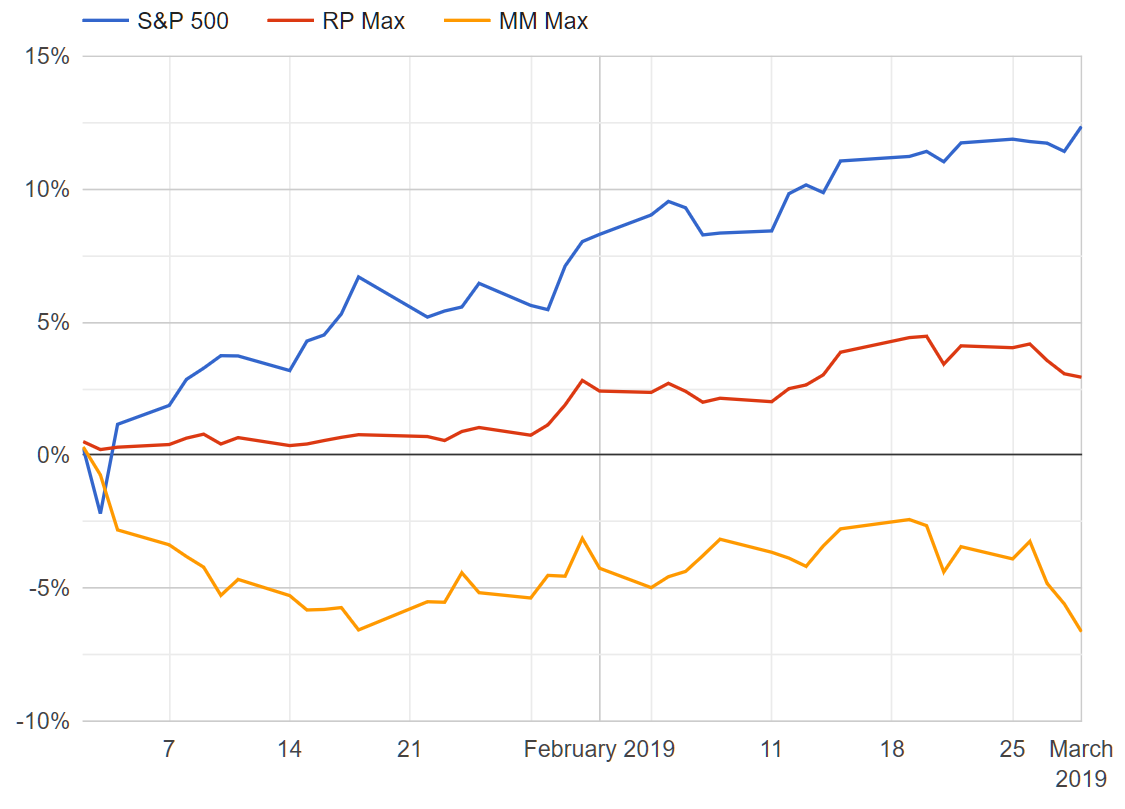
Of course, Hedgewise employs no market timing; the system simply evaluates relative risk across asset classes and re-balances accordingly. The fact that equities gained 10% in under 3 months suggests that the Hedgewise risk signals were accurate. While the economy did stabilize and equities gained, there was a significant chance that it would not and equities could have fallen by the same amount or more.
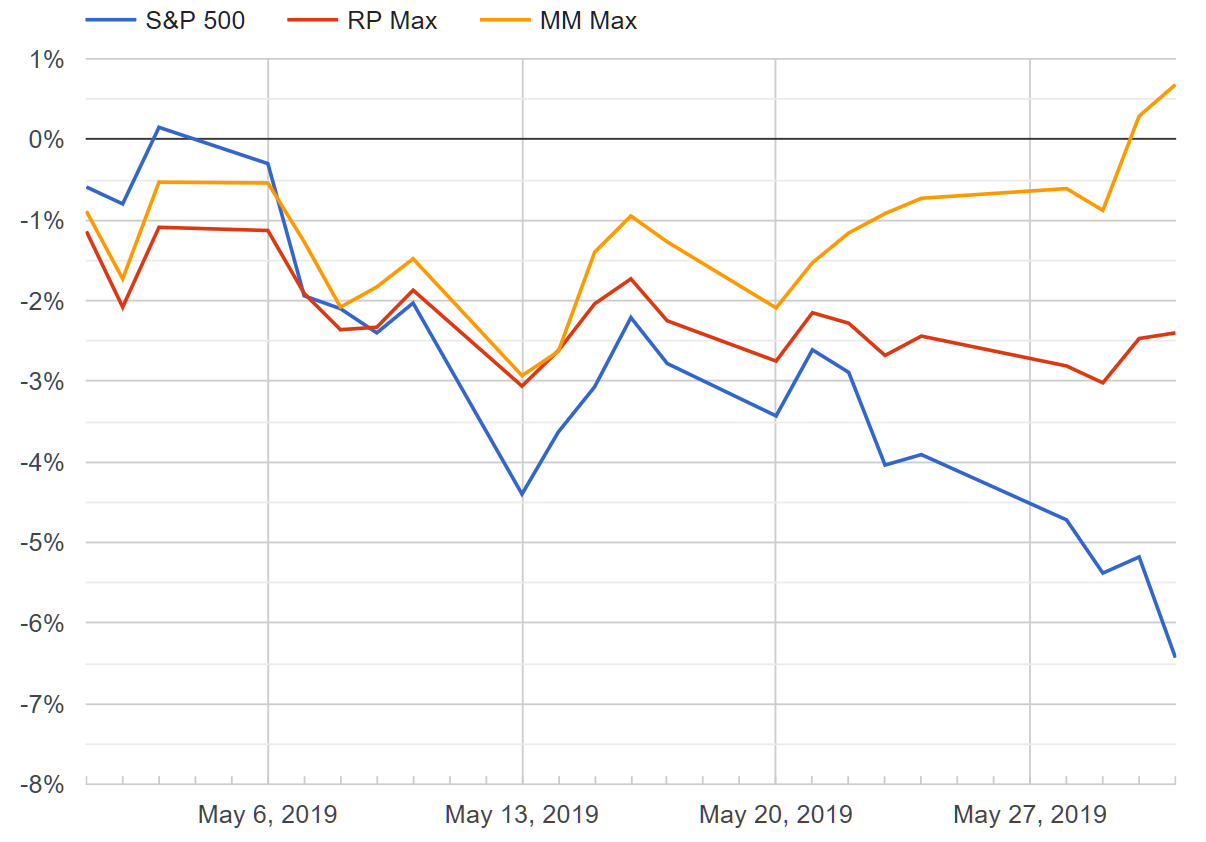
The challenge of this trade-off is that you can only see the long-term benefit with the passage of time, and it can be difficult to keep the right perspective along the way. It's far easier to judge each event in isolation. Fortunately, 2019 has presented a nice case study as stocks have subsequently pulled back in May and August of this year.
Hedgewise Strategies vs. the S&P 500, May 2019
Hedgewise Strategies vs. the S&P 500, July 26 to August 16, 2019
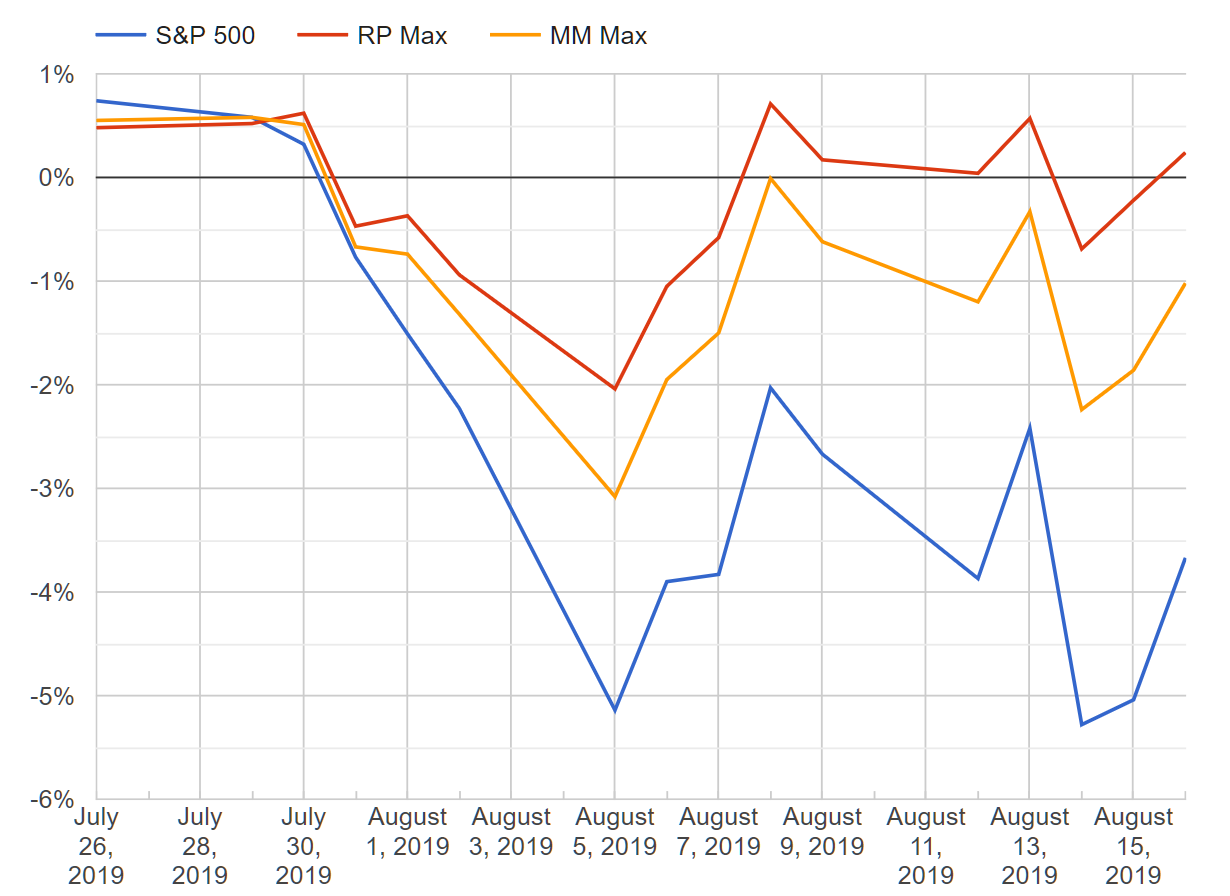
Again, no timing at work here! It's two sides of the same coin, and the year-to-date view of 2019 helps to demonstrate how the cumulative effect balances out over time.
Hedgewise Strategies vs. the S&P 500, 2019 YTD
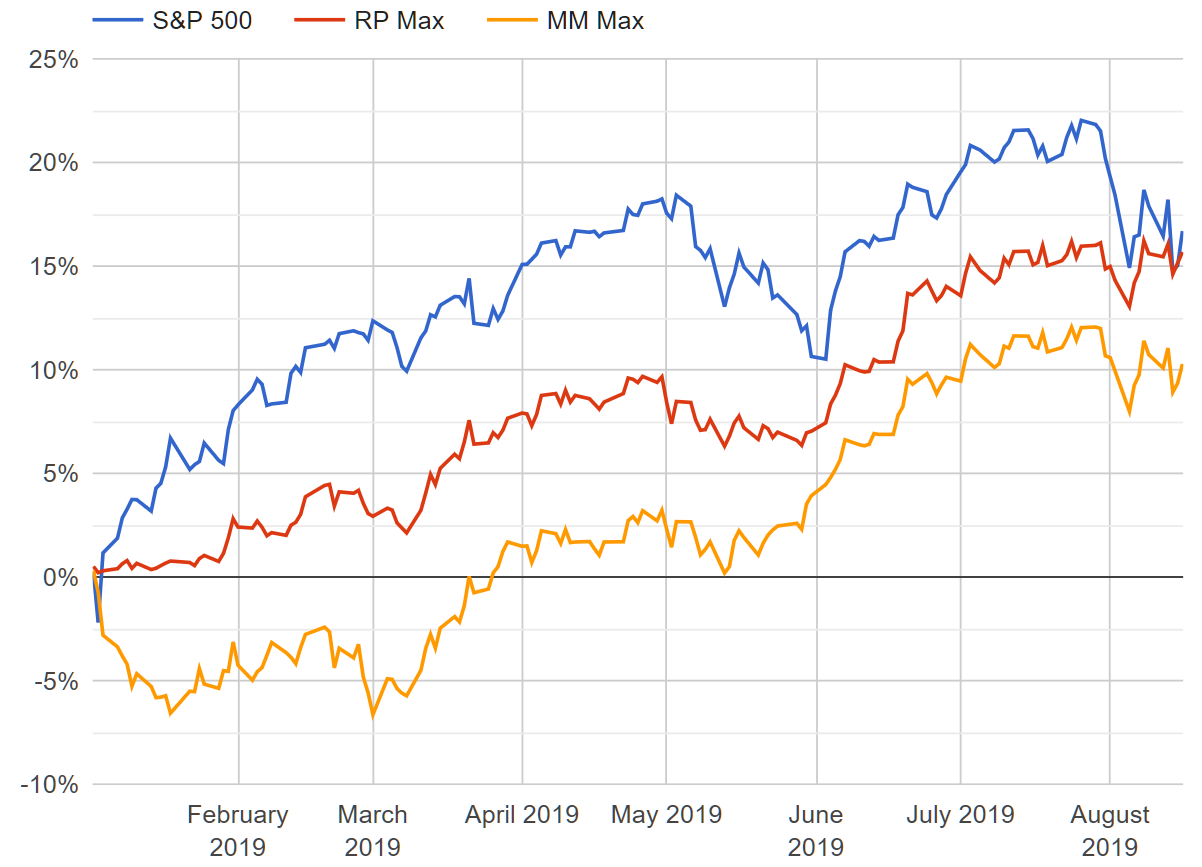
Both frameworks have slowly but surely closed the gap with the S&P 500, but that doesn't tell the full story. A majority of the Hedgewise gains this year can be attributed to bonds and gold, since equities have remained quite risky throughout. This highlights the strategies' versatility, as these other assets were positioned to do well even if equities had not. Risk management constantly builds in this tolerance for multiple outcomes so that gains are less vulnerable to sharp corrections like we saw in May and August. While it may be hard to differentiate your absolute returns until the S&P suffers a prolonged crash, there is also no need to worry whether that is right around the corner.
Hopefully, this provides some peace of mind in light of recent market turmoil, but it may still feel hard to make sense of the period since January 2018. After all, last year we dealt with a significant drawdown when so many assets fell together, and this year we have this story of missing some upside. Though this sequence of market conditions is historically uncommon, it is not unexpected. The key assumption is that the relative cost and frequency of such periods is outweighed by the benefits you accrue the rest of the time. Let's take a deeper look at whether this has been the case.
Stepping Back: Evaluating Longer-Term Performance
We'll begin with the initial challenge: performance from January 2018 to today feels somewhat underwhelming.
Hedgewise Relative Performance Since January 2018
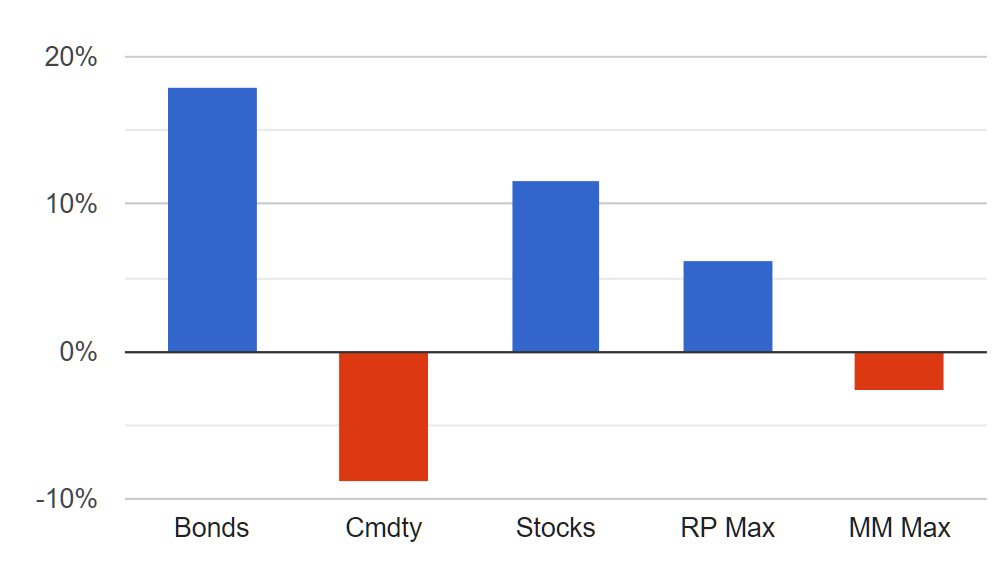
There are two parts to giving context to these results. The first is that this has been a very particular - and fundamentally unlikely - sequence of events. An overaggressive Fed is one of the few causes of cross-asset declines, such as those in 2018. If you examine every other similar case, there's only a single comparable period (in 1999) when stocks and bonds then reversed their losses with similar speed and volatility to this year. While I'll examine this other instance in a moment, the initial point is that these events are a natural outlier for very logical reasons: the Fed is rarely at the end of a tightening cycle, and it's rarer still for it to unfold with this degree of confusion and market whipsaw.
Given that, it's proper to treat this event as a risk management "correction", much like you'd view 2008 for the S&P 500. With that parallel in mind, recent performance is fairly impressive. Consider the case when the S&P 500 crashes: you've lost as much as 50%, and you've needed as long as a decade to claw back to breakeven (e.g., 2000-2010). With Hedgewise, you lose less than half of that and recover most or all of it within a year.
This outcome looks even better once you extend your timeframe. Here's a look at the same performance profile since November 2016 (note that this date was chosen as it was the month that the Momentum framework was initially launched, but the results are similar beginning in any other month of 2016).
Hedgewise Relative Performance Since November 2016
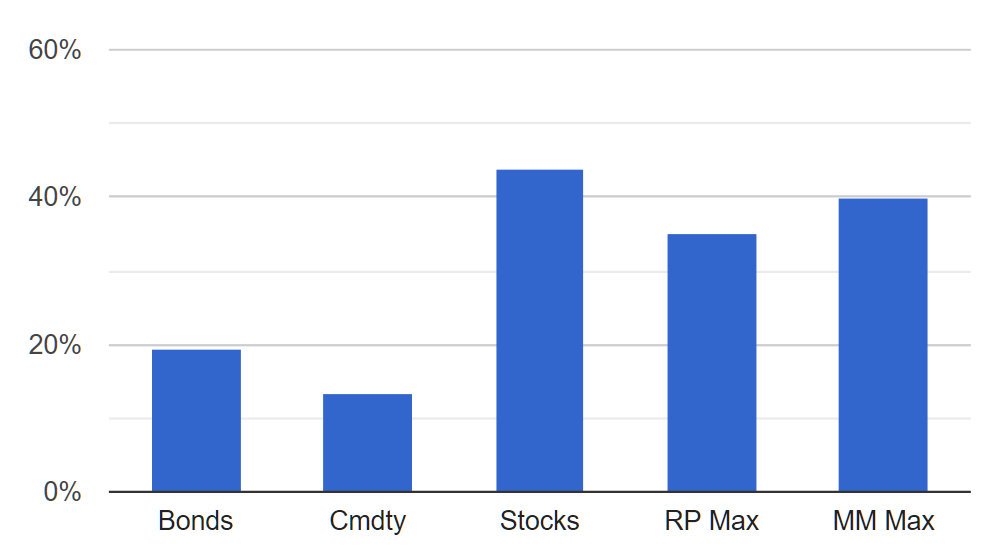
These results demonstrate just how quickly the benefits that you accrue in normal market conditions, like during 2016 and 2017, essentially offset even a worst-case series of events for these frameworks. Again, this is still an example of a relatively bad period of performance. If you extend this timeframe further, or choose any stretch that includes an actual bear market for an individual asset class, the benefits of the Hedgewise approach will be even more obvious.
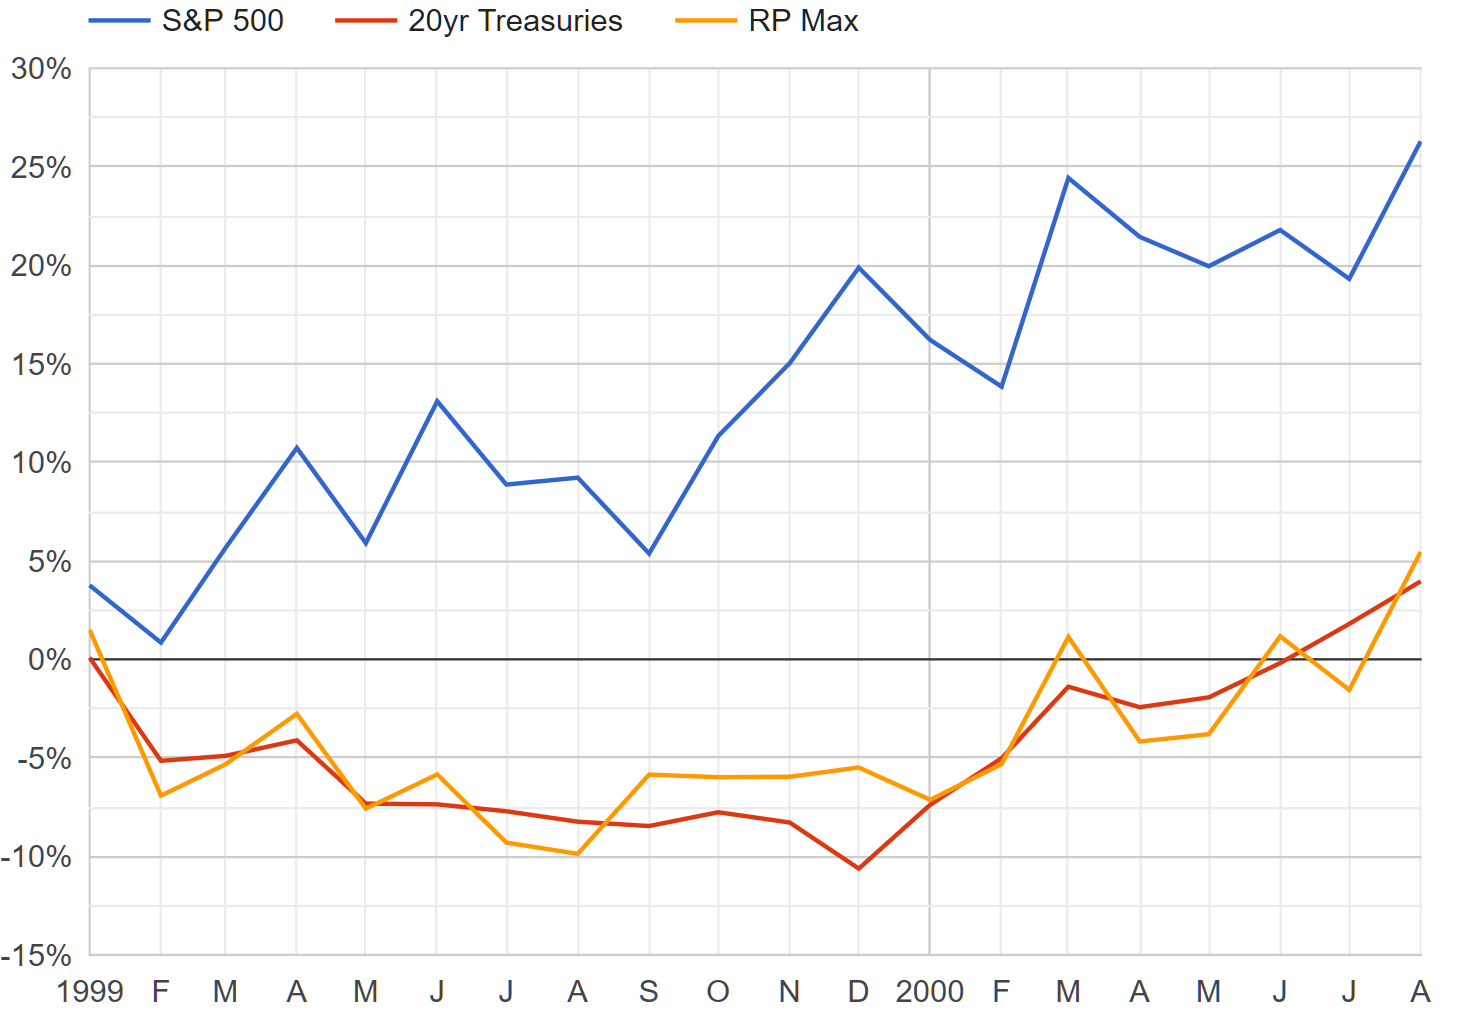
For example, returning to the last time we saw anything like recent events, the stretch from January 1999 to August 2000 had some eerie similarities to the past 18 months. Interest rates peaked in December, and while stocks weren't quite as tumultuous as we saw last year, performance was fairly choppy. As soon as the Fed backed off, stocks and bonds rallied by 20% amidst volatile conditions. The story for Risk Parity was similar to this year, though it lagged further behind equities and less behind bonds.
Performance Comparison, January 1999 to August 2000
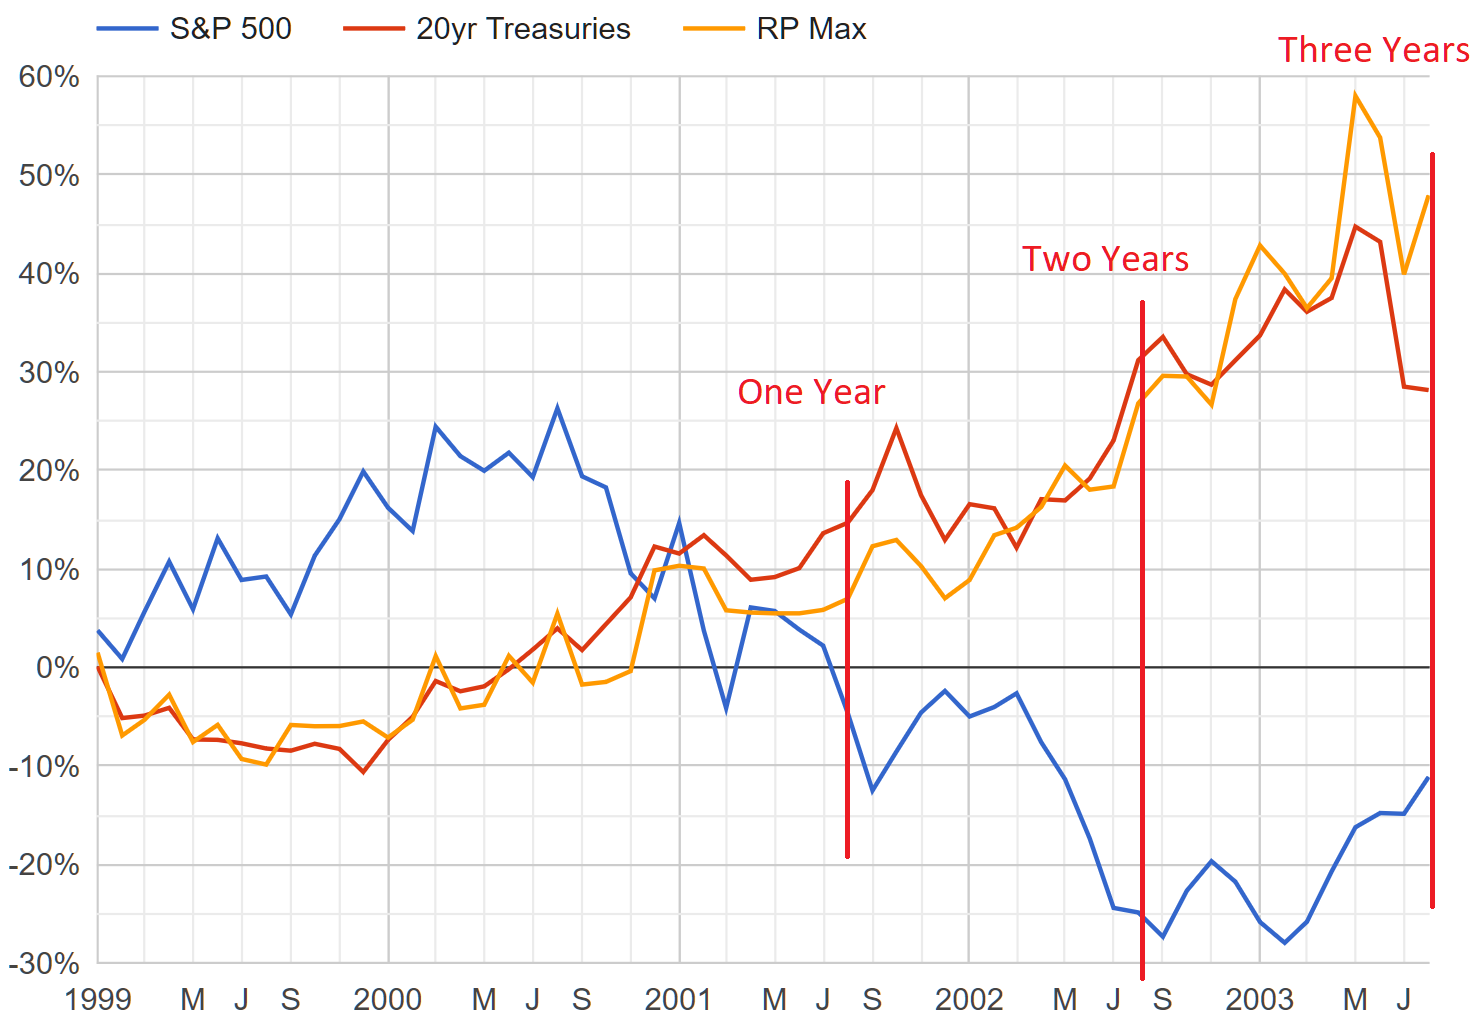
Risk Parity Max wound up with a 20% performance gap to the S&P 500. Let's see how long it took to subsequently recover from this "correction". The following expands the prior graph through August 2003, with markers for when you hit one, two, and three years after the original dates.
Performance Comparison, January 1999 to August 2003
It turns out that August 2000 was the peak of the dot-com bubble, but this isn't meant to be a prognostication. A soft landing may still be possible, and I'd actually venture that bonds appear even scarier than stocks at this particular moment in time. The point is that it doesn't really matter; even the worst stretches for risk management eventually pale in comparison to the benefits you go on to accrue, especially relative to whatever asset happens to crash next.
Speaking of crashes, I want to provide one final perspective to tie this all together. The S&P 500 is an inevitable benchmark, and it has had a really tremendous decade. Using that as a sole point of comparison can make it seem as if we "need" a recession to prove that risk management is worth it, and that is not true. A better metric is how well the strategies hold up against whichever asset happens to be performing poorly right now, since that should reasonably extend to whatever crashes next (and eventually they all do).
Despite the recent rally in Treasury bonds, interest rates have only just this month returned to the all-time lows that they hit in mid-2016. Since then, it's mostly been awful for fixed income investors, which provides an excellent test for Risk Parity (especially considering the common fear that Risk Parity won't hold up in periods of rising rates).
Hedgewise Risk Parity Performance vs. 30yr Treasuries, July 2016 to Present
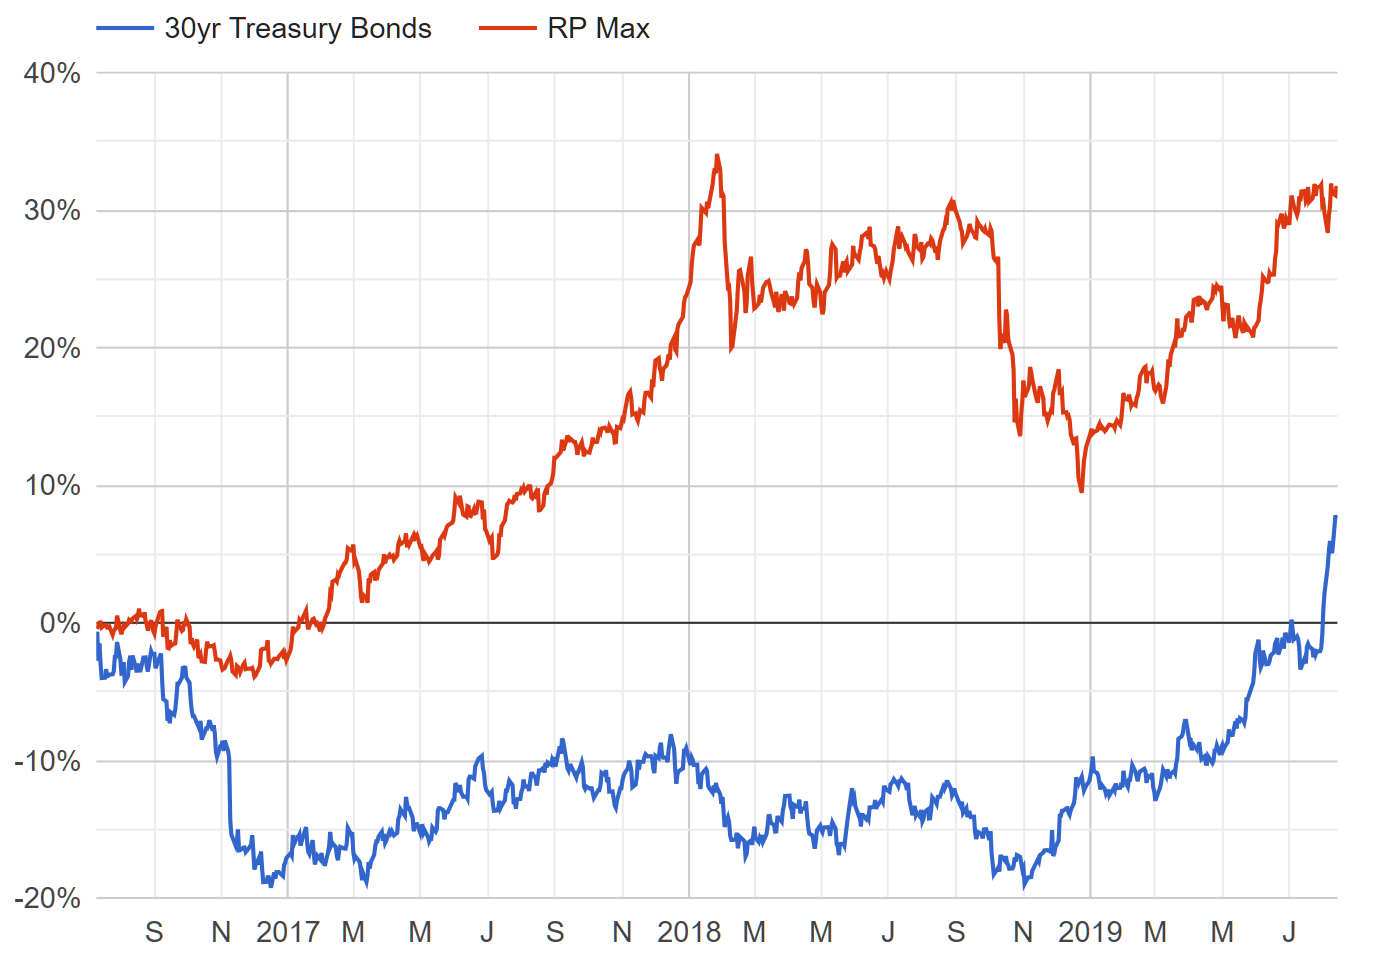
This image demonstrates so many of the relevant themes. Most of the time, Hedgewise is really great at generating steady positive returns regardless of individual asset crashes. Even significant "corrections" like the period since last January look pretty reasonable in comparison and do little to dent longer-term outperformance. This is all true over just a few years, and even when those years include a historic combination of bad outcomes.
Conclusion: Perspective and Probabilities
I have no idea what's coming next, and the current dislocation between stock and bond markets makes it a very scary time for traditional passive investors. Traders are pricing in four interest rate cuts over the next year, which has basically never happened without significant economic turmoil. There's now over 16 trillion dollars in negative yielding debt across the globe, along with yield curve inversions nearly everywhere. Against this backdrop, it's really nice to know that my investment strategy has a plan for most of the possibilities.
In exchange for this comfort, I have to deal with mostly random, infrequent stretches where hedging gets caught by cross-asset drawdowns, or market whipsaws limit some upside. The fact that we just had both those things happens certainly lends weight to the probability that even better times are ahead. For all the recent challenges, though, returns over the past three and a half years have been excellent, and we've basically matched equity performance while maintaining a persistently safer outlook. If this includes a pretty bad part, I think we're doing pretty good.
Disclosure
This information does not constitute investment advice or an offer to invest or to provide management services and is subject to correction, completion and amendment without notice. Hedgewise makes no warranties and is not responsible for your use of this information or for any errors or inaccuracies resulting from your use. Hedgewise may recommend some of the investments mentioned in this article for use in its clients' portfolios. Past performance is no indicator or guarantee of future results. Investing involves risk, including the risk of loss. All performance data shown prior to the inception of each Hedgewise framework (Risk Parity in October 2014, Momentum in November 2016) is based on a hypothetical model and there is no guarantee that such performance could have been achieved in a live portfolio, which would have been affected by material factors including market liquidity, bid-ask spreads, intraday price fluctuations, instrument availability, and interest rates. Model performance data is based on publicly available index or asset price information and all dividend or coupon payments are included and assumed to be reinvested monthly. Hedgewise products have substantially different levels of volatility and exposure to separate risk factors, such as commodity prices and the use of leverage via derivatives, compared to traditional benchmarks like the S&P 500. Any comparisons to benchmarks are provided as a generic baseline for a long-term investment portfolio and do not suggest that Hedgewise products will exhibit similar characteristics. When live client data is shown, it includes all fees, commissions, and other expenses incurred during management. Only performance figures from the earliest live client accounts available or from a composite average of all client accounts are used. Other accounts managed by Hedgewise will have performed slightly differently than the numbers shown for a variety of reasons, though all accounts are managed according to the same underlying strategy model. Hedgewise relies on sophisticated algorithms which present technological risk, including data availability, system uptime and speed, coding errors, and reliance on third party vendors.