


Summary
- In terms of loss avoidance, 2022 was one of the best years ever for Hedgewise. Moving into 2023, the focus is how to optimally translate that success into gains.
- From the October bottom, a 40% recovery is a relatively moderate expectation over the medium term (at the "Max" risk level). Clients have already recovered 7% as of March 1, and had gained as much as 13% at an earlier point in February.
- Ironically, such fast gains are not the preferred path, and the drawdown last month was welcome. From a risk management perspective, a slower and choppier recovery is more likely to amplify the available upside.
- We'll dive into the logic behind this and look in detail at how the various risk management mechanisms have been functioning thus far in 2023.
Overview: A Good Spot or a Better One
From a big picture view, Hedgewise is in an excellent position for 2023, and there is less of a question of 'if' there will be a recovery, and more of a question of how big it will be. This is true despite tumultuous macroeconomic conditions and multiple errors by the Fed that have increased the risk of stagflation and dislocated the 'real world' economy (e.g., a frozen housing market, excessively tight labor markets, continued supply chain snarls) True to form from a hedging perspective, Hedgewise stands to benefit from increased turmoil (and short-term losses!), though it will also do just fine if it all resolves calmly.
The reason for this is because of the relative success of last year. As highlighted in the last newsletter, Hedgewise was at or near minimum exposures in most asset classes throughout the drawdown of 2022. This significantly limited losses, which can be seen by comparing live client performance to a portfolio in which each asset class is fixed at its historical average weight (labeled "RP Max, Historical Avg. Weights below).
Hedgewise vs. Historical Average Risk Parity Portfolio in 2022
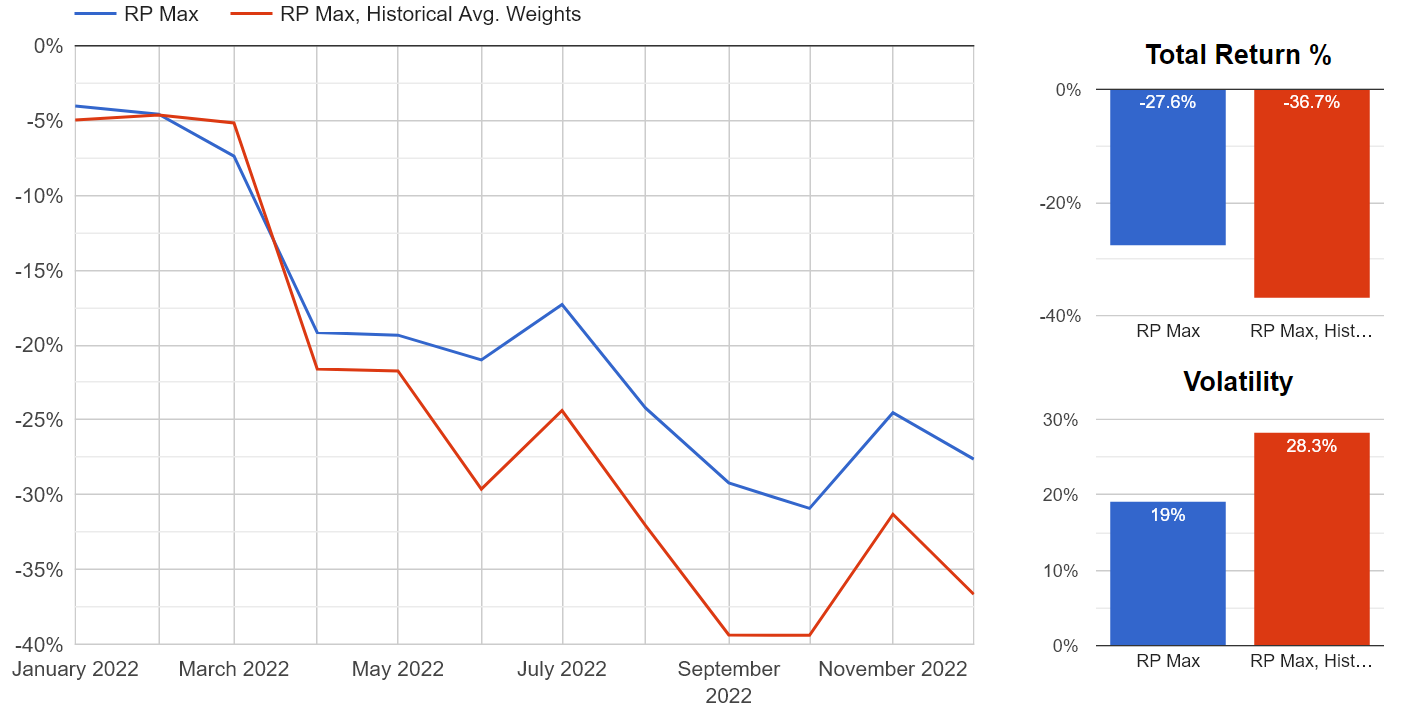
The larger the gap between the blue and red line, the greater the opportunity for net new gains over the long run. At any point during the drawdown, the portfolio could be set back to its historical average weights and be guaranteed to pocket the difference as the recovery unfolds. The tricky part is exactly when to do that, and with which asset classes (since additional losses could also accrue).
That said, let's oversimplify. Imagine you could have magically identified October as the bottom in real-time, and you shifted all exposures back to their historical averages at that precise moment. Let's also fast forward to some point in the future when stocks and commodities have recovered to the prices of January 2022 and bond yields have returned to neutral (which the Fed estimates at 2.7%). At that point, this hypothetical portfolio would gain about 40% from the bottom.
Now switch to a worst-case scenario where you remain stuck at the weights immediately prior to October with no opportunity to re-weight. That portfolio would still gain 30% upon the same point of recovery because bond exposure had already normalized before October, locking in much of the potential benefit.
This is why a 30-40% gain represents a conservative expectation over the medium term. Risk assets will almost certainly return to their January 2022 levels within the next few years, though it could also happen within six months. Either way, there will be a significant gain, it is just a matter of how much.
With such a strong outlook, it is ironic yet understandable that many clients remain hesitant to deploy their cash. Worry remains that the worst is yet to come, and Treasury bills yield a hefty 5%. Yet it is vital to differentiate the Hedgewise portfolio from equities in isolation and other passive benchmarks. Hedgewise utilizes risk management techniques that benefit from a choppier recovery and additional drawdowns, the impact of which can already be measured in live performance. "Bad" outcomes like stagflation or a severe recession would only add to net expected returns.
Fortunately, there is now enough data over the past year to examine and better understand this in real-time.
Evaluating the Recovery Since October
Let's return to the baseline assumption that all asset prices bottomed last October. At that point, Hedgewise had succeeded in limiting its drawdown because exposures were lower than average throughout 2022. To most effectively translate this into net new gains, Hedgewise has two available paths. The most obvious is to increase asset weights prior to a recovery. The second is to take advantage of market volatility through monthly exposure adjustments (i.e., selling a little as prices go up, and buying a little as prices go back down).
For both options, a slower and choppier recovery is preferred. This is simple probability: the longer that prices remain low, the higher the chance that asset weights will normalize (and that risk levels will return to average). Similarly, there is no chance of benefitting from market volatility if prices only go in one direction.
The 'historical average' Risk Parity portfolio from earlier is useful to track as a benchmark. While it is not realistic to achieve its performance from the onset of a recovery, since that assumes foreknowledge of the precise bottom, it helps to evaluate how much 'potential' gain Hedgewise has successfully captured. The closer the blue line is to the red line, the more ideal the recovery, and vice versa.
Hedgewise vs. Historical Average Risk Parity Portfolio, October 2022 to March 2023
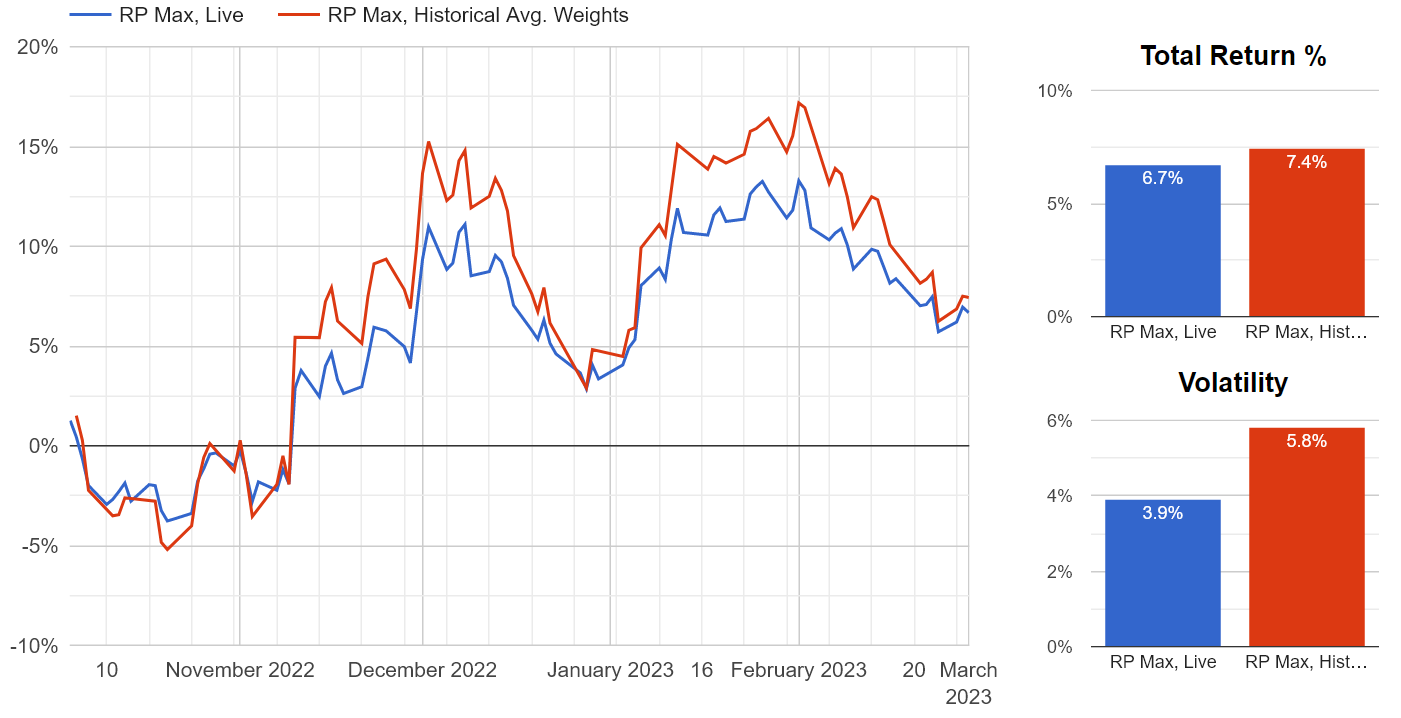
As of March 1, the Hedgewise recovery has been close to perfect. However, it was much 'worse' at the peaks in December and February, during which Hedgewise had foregone approximately 4% of potential gain. Likewise, the 6.7% gain at the beginning of March is much 'better' than the same gain near the beginning of December. The precise reason varies over time and isn't particularly important; the main takeaway is that gains may be bad and losses may be good in the context of total opportunity.
This is not a matter of market timing, but rather systematic probability. As prices fall, Hedgewise is more likely to add exposure. Risk management techniques take further advantage of the volatility. This dynamic would remain true even if prices fell back to the October bottom or below.
The intuition behind this can be challenging, but it can be more easily understood in the bond market, in which risk is the most obvious to measure and manage.
Live Proof in the Bond Market
Risk in US Treasuries is more definitional than other asset classes because interest rates can only go so high or so low, and you eventually get your money back either way so long as the government pays its bills. As a result, it is easy to categorize a Treasury bond paying 6% as less risky than one paying 2% (since you pay less for it upfront and get higher coupon payments to boot).
Hedgewise adjusts its risk estimates to account for interest rate changes month-to-month, and often shifts its bond weights 3-5% as a result. The more that rates bounce around, the more opportunity there is to benefit.
The following chart shows how recommended bond exposure for the RP Max portfolio has shifted each month since last September alongside realized monthly bond returns. The dotted red line is added for emphasis on the divide between a positive or negative monthly return.
Hedgewise Recommended Bond Exposure vs. Monthly Return, RP Max, September 2022 to Present
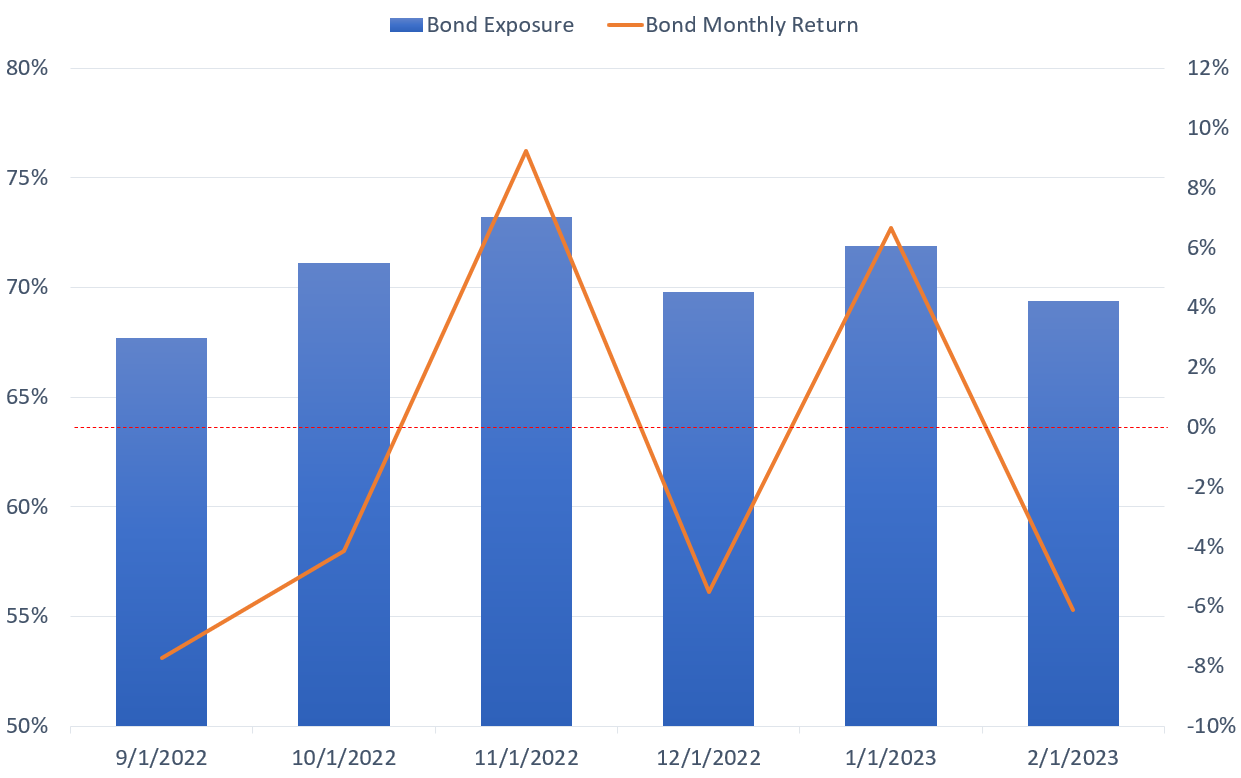
Between September and February, 30yr bond yields were little changed overall: they moved from approximately 3.4% to 3.5%. However, significant volatility in the interim provided an opportunity to slightly reduce exposure as prices went up and vice versa. The net result from exposure changes over this six-month period was a net gain of 0.7%. This amount is independent and permanent, in that it depends only on volatility and has already been fully realized.
While this is straightforward, it can be easy to lose track of day-to-day. For example, between last September and November, bonds suffered a loss of 9% before subsequently recovering, which contributed to a drawdown in the Hedgewise portfolio at the time. Yet this was necessary to unlock an extra 0.7% gain that would not have been available if rates had remained steady.
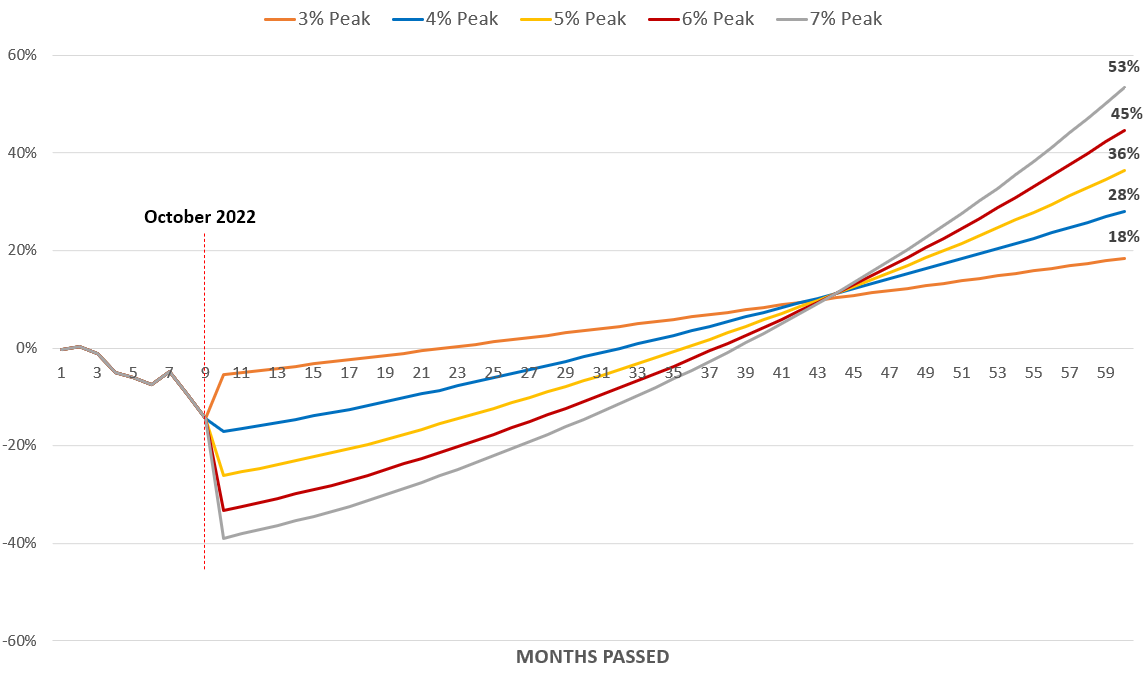
To expand on this idea, it is worth revisiting a model shared in the last newsletter. The following was a simulation for how bonds would be expected to impact the RP Max portfolio over a five-year timeframe. The first part of the chart uses live performance data from last January to October, and then splits into different assumptions for where interest rates will finally peak (the 3% peak assumed that rates fell quickly from their level in October to 3%). At the end of five years, it is assumed that rates had returned to neutral at 2.7%.
Comparing Expected Bond Performance Across Various Interest Rate Peaks From October 2022
This graph represented an 'ideal recovery' as it assumed a high level of bond volatility, and that bond exposure eventually surpassed its historical average after rates peaked. Let's check in on how this has gone with live performance data since October (represented by the green line below).
Interest Rate Model vs. Live Bond Performance in RP Max Portfolio
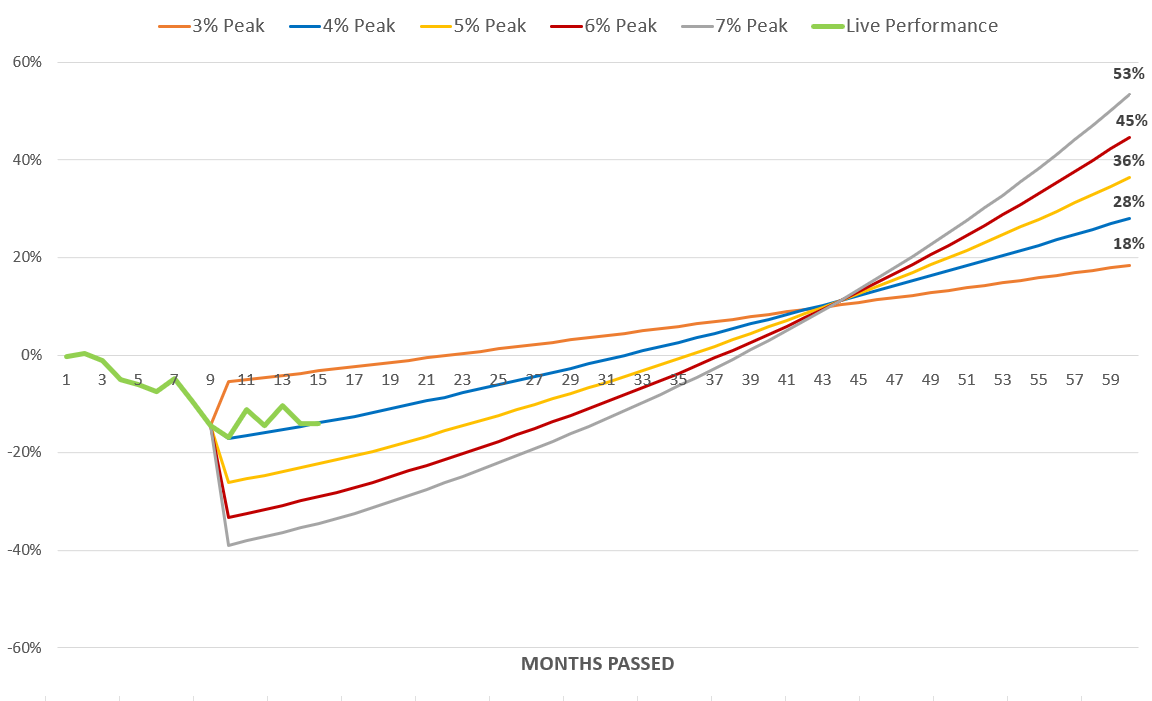
Rates peaked at about 4.14% in November, and live performance has hewn extremely close to the ideal recovery at a 4% peak. This was enabled by a combination of the volatility benefits discussed earlier and increased bond exposure as rates rose. Nothing surprising, but seeing the live data align so closely with the theoretical concepts helps to build confidence in the model and to unpack some of its counterintuitive elements.
For example, the top orange line represents the fastest potential recovery and worst long-term outcome. Though Hedgewise realized quick gains in November and January, it was better to give them back and return closer to the blue line. What if rates keep going up to 5%? Great, we shift down the graph to the yellow line. What if rates stay higher for longer? Also great, higher coupon payments boost your total returns by the end.
The concepts are simple, but the outcomes are very different than traditional passive approaches. The worst case is a moderate return amidst a fast recovery. It only gets better with higher rates and bigger near-term losses. True to a proper hedge, it doesn’t really matter what happens - all the results are positive to different degrees.
The single core assumption is that rates eventually fall to neutral. The prior figures use a five-year timeframe, but the logic holds for any other length. The exception would be if rates never fall and remain at 4% or above. This would require the Fed to remain permanently restrictive, to fail in meeting its 2% inflation target, or some combination of the two. The economic scenarios get a little weird in trying to imagine this, but the most plausible would be a kind of forever stagflation where inflation sticks at 4%+, and no amount of rate hikes can ever bring it down. The Fed kind of keeps trying by keeping rates higher than 4%, but kind of gives up by not doing anything more radical, and that is the new status quo.
While this is an edge case, we can still model how Hedgewise would be affected just for fun. Over five years, the bond impact on the RP Max portfolio would be expected to remain breakeven all the way up to a terminal 5.5% interest rate. In other words, the effect of the rate increases would likely be offset by a mixture of coupon payments and volatility management until they exceeded 5.5%. This represents a useful strawman for what you'd need to believe to be worried about how Hedgewise will fare with its bond exposure over the next few years. The rate on 30yr Treasuries would need to settle north of 5.5%, then never fall below that point again.
These bond concepts are so useful because they are mathematic, specific to real-world scenarios, and already in motion. It builds confidence to know precisely how these risk management techniques are operating and why they will be effective across such a broad range of outcomes. It is not a matter of believing in Hedgewise or Risk Parity more broadly, but of understanding what makes this specific framework successful, how the benefits have manifested over the past year, and why that is expected to continue.
Wrapping Up: Scenario Planning
Let's return to the earlier base case recovery scenario where stocks and commodities return to their January 2022 levels, and interest rates fall back to 2.7%. This is how the 30-40% gain was estimated from the October bottom, but it assumed a one-year timeline and a smooth recovery across all assets. The prior analysis uncovers why that is among the least preferred outcomes. For example, that kind of bond recovery would be consistent with the top orange line from the interest rate model which had the lowest total expected return. We'll call this the 'soft landing', and then consider other rockier scenarios to see how they compare.
The first might be a 'hard landing': a severe recession akin to the Volcker shock of the early 1980s. The Fed would push rates higher and announce its intention to cause a recession. Assume a 5% bond peak, a retracement in the S&P 500, and that inflation eventually gets under control. Even if stocks fell back to their October bottom and never rose from there, a 30% gain would still be expected in the RP Max portfolio (the increase in bond performance at the 5% peak offsets the lack of recovery in equities). If the S&P 500 eventually returned to its January 2022 level, expected gains would rise to 50-65%.
Next let's consider 'prolonged stagflation': more like the mid-70s, when inflation stayed high, rates stayed elevated, equities did horribly, but commodities at least retained their real value. Assume rates rise to 5% and stay there, equities retrace to the October bottom, but commodities keep track with inflation. Initially, this would be painful. The RP Max recovery would be expected in the 10-15% range so long as inflation remained stuck (coupon payments, vol management, and commodity gains would offset the higher rates, but not by much). Then a binary assumption is required about what happens next. Either the Fed finally does its job, or the world accepts high inflation forever.
If the Fed eventually succeeds, it’s the same Volcker shock with a higher terminal rate, say 6-7% instead of 5%. Inflation is slain, but it takes 5+ years to happen. This would be an amazing outcome for Hedgewise, with expected total gains of 80-90% (these are the best scenarios from the prior interest rate graph), but it would take longer to happen and be scarier in the middle.
If the world accepts 4-5% inflation in perpetuity, inflation hedges would eventually do well (e.g., gold, TIPS, copper), but nominal bonds and equities would do poorly. The net outcome would still be expected in the 35-45% range for RP Max as the hedges kick in, but it would be very volatile as the world would be reckoning with a complete failure and re-orientation of the Fed. Assuming equities eventually recovered to their January 22 level, the expected range increases to 50-60%.
Finally, let's do one rosier economic outcome and call it 'radical expansion'. Some hidden source of real growth is unlocked (artificial intelligence or the like), and rates stay high alongside a humming real economy. Assume equities jump to 20% above their January 2022 level, and rates stick at 4% in perpetuity. Growth commodities like copper and energy do well, but gold does terribly. This generates a 25-40% expected return range for RP Max.
You may have noticed by now that the outcomes are clustered. The soft landing and radical expansion scenarios land in the 25-40% range. The hard landing and stagflation scenarios land in the 50-65% range despite a volatile expected interim period that includes additional short-term losses. The highest potential gain of 80-90% is reserved for a 1970s redux where the Fed fails to reign in inflation for another five years before initiating a shock recession. Across all the scenarios, the upper end of the range is more likely with a slower and choppier recovery, and vice versa.
The main takeaway is that every outcome is relatively good. After last year, the portfolio is already set-up for success. We don't know exactly how much of a gain it will be, or how long it will take, but it will not rely on any single asset class or economic reality. On net, if you are evaluating a specific short-term stretch, it is safer to assume that losses and volatility are beneficial. But it is not about trying to isolate the highest absolute gain, but rather maintaining confidence that the upside is there across many scenarios and only improves when markets seem scarier.
If I were to urge one single piece of advice, it would be to put your cash to work. The current pocket of opportunity is incredibly rare and hasn't really happened since the early 1980s. Back then, you could have gotten a 15% yield on a one-year Treasury bill, and that would have been the mistake of a lifetime compared to buying 30yr bonds (which tripled in value from 1982 to 1987). This is as similar as an environment as we are likely to see in at least a generation. It may be a slow and steady recovery that takes years, but it could just as easily happen in two months. With such a positive outlook whichever way it goes, it is very hard to justify any risk of missing out.
Disclosure
This information does not constitute investment advice or an offer to invest or to provide management services and is subject to correction, completion and amendment without notice. Hedgewise makes no warranties and is not responsible for your use of this information or for any errors or inaccuracies resulting from your use. Hedgewise may recommend some of the investments mentioned in this article for use in its clients' portfolios. Past performance is no indicator or guarantee of future results. Investing involves risk, including the risk of loss. All performance data shown prior to the inception of each Hedgewise framework (Risk Parity in October 2014, Momentum in November 2016) is based on a hypothetical model and there is no guarantee that such performance could have been achieved in a live portfolio, which would have been affected by material factors including market liquidity, bid-ask spreads, intraday price fluctuations, instrument availability, and interest rates. Model performance data is based on publicly available index or asset price information and all dividend or coupon payments are included and assumed to be reinvested monthly. Hedgewise products have substantially different levels of volatility and exposure to separate risk factors, such as commodity prices and the use of leverage via derivatives, compared to traditional benchmarks like the S&P 500. Any comparisons to benchmarks are provided as a generic baseline for a long-term investment portfolio and do not suggest that Hedgewise products will exhibit similar characteristics. When live client data is shown, it includes all fees, commissions, and other expenses incurred during management. Only performance figures from the earliest live client accounts available or from a composite average of all client accounts are used. Other accounts managed by Hedgewise will have performed slightly differently than the numbers shown for a variety of reasons, though all accounts are managed according to the same underlying strategy model. Hedgewise relies on sophisticated algorithms which present technological risk, including data availability, system uptime and speed, coding errors, and reliance on third party vendors.