


Hedgewise can intelligently manage your oil investments for you at a low fee and with zero commissions.
Introduction: We're Nearing the Bottom
While it's been an atrocious couple of years for the energy industry, many signs are indicating that we are approaching the bottom. Oil prices have already dipped below the total median cost of production in many countries, which will inevitably cause many firms to stop new exploration projects if they haven't already. We break down the numbers to develop a case for the 'absolute lowest' price, at which point oil will basically turn into a little-to-no downside investment play.
Taking a Look at the Cost of Production
Rystad Energy recently released estimates for the total, all-in production cost for one barrel of oil across each of the major oil-producing countries. Note that this includes the cost of discovery, extraction, transportation, overhead, etc.
Median Total Cost of Oil Production per Barrel
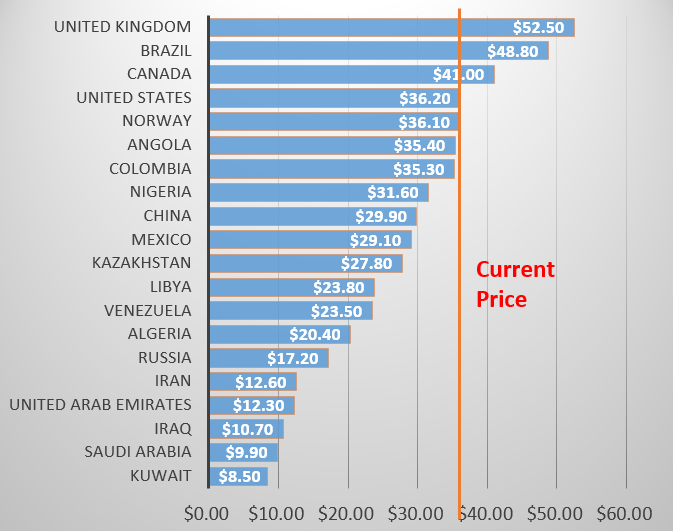
The median producer in a number of countries is already at a point where new exploration projects have become unprofitable, including the U.S.
Of course, the median total cost of production doesn't tell the whole story. There's a big difference between the cost of discovering and producing brand new oil and simply extracting current known reserves. For example, Moody's estimates that it costs an average of $13.68 in the U.S. to bring one barrel to the surface at an existing oil field, or about 38% of the total. As such, firms can continue to profitably produce from current reserves even if they stop exploration. There is also a dramatic spread in these costs across different firms and different countries.
With these facts in mind, the median total cost of production is not an obvious lower bound on the price of oil in the short-term. However, it's a great place to start the analysis.
So What Does the Total Median Production Cost Tell Us?
These numbers are most useful in the longer-term (i.e., 3 to 5 years), once enough time has lapsed to feel the supply shock of reduced exploration. Because the U.S. is now the world's top producer of oil, its median production cost of $36.20 is an excellent proxy for an oil floor in this time horizon.
If the U.S. could no longer profitably produce oil, it would eventually lead to about a 15% dip in global supply. To compensate for this, the other major oil producing countries would need to continue to meet world demand at prices below this level. According to the IMF, that's not going to happen, especially not for 5 years:
The International Monetary Fund warned last month that most countries in the Middle East -- including Saudi Arabia, Oman and Bahrain --- will run out of cash within five years if oil prices don't rise above roughly $50 per barrel. -- CNN
If you buy this argument, oil is already a bit below the bare minimum long-term price. In fact, for patient investors equipped with an appropriate strategy (more on this below), there's a good case to buy anywhere below $35/bbl. However, prices could certainly fall further in the short-term.
How Low Could It Go?
At a bare minimum, the price of oil will never fall below the cheapest cost of production in the world, which is $8.50 per barrel in Kuwait, for obvious reasons.
It's also quite impossible that the price would ever fall below the cost of extracting current reserves in the U.S., or the previously mentioned $13.68. If it did, it would lead to a shutdown of operations in most U.S. refineries and an enormous corresponding supply shock.
The next support level depends mainly on how low Saudi Arabia needs oil prices to stay in order to put U.S. shale producers out of business. After all, this is the main reason that the price war was instigated in the first place, and most of the Middle East has enough of a capital cushion to tolerate rock bottom prices until its goal is accomplished. According to CNBC:
Shale muscled into the middle of the cost curve in the $30 to $70 cost level, but the price of producing a barrel of oil is still heading downward... the break-even cost has fallen into the $20s in some counties. -- CNBC
Assuming that Saudi Arabia wants to be as aggressive as possible in bankrupting the future prospects of US shale companies, this means it would be willing to accept a price as low as $20/bbl. However, it would have no reason to let it fall further than that, nor would prices remain there for any more than a few months. This would just be used as a temporary measure until enough companies go bankrupt and loans for new exploration have sufficiently dried up.
Supporting this logic is the recent report from Goldman Sachs quoting a similar number.
Meanwhile, Michele Della Vigna from Goldman Sachs told the "Today" program on BBC's Radio 4 that oil could fall to as little as $20 a barrel. He added, however, that there was only about a "15% probability that this might happen" and that if oil were to fall to this level, it would only be temporary "shock to the system" before the market stabilized again. -- Business Insider
So there you have it: prices could feasibly reach a bottom of $20, but will more likely stabilize around a minimum of $40 within a few years.
What's the right investment strategy?
If prices do approach the low-to-mid $20s this year, it will be a fantastic time to buy. However, it is notoriously difficult to time the bottom, so it may be smarter to consider dollar-cost averaging in anywhere below $35, and incrementally adding to your position if prices continue to fall.
However, it is crucial that you utilize an appropriate long-term investment strategy that doesn't suffer from drag (such as contango). One expert energy investment advisor, Hedgewise, recommends a dynamic portfolio of oil companies with solid balance sheets and a high correlation to the price of oil. Such a portfolio allows you to benefit when the price war ends even if it takes a year or two, and recent performance has proven this approach to be quite effective so far in 2016.
Investments like the United States Oil Fund (NYSEARCA:USO) or the iPath S&P GSCI Crude Oil TR ETN (NYSEARCA:OIL) are not sensible choices for a holding period of any more than a month or two. Broader energy funds like the Energy Select Sector SPDR ETF (NYSEARCA:XLE), the Vanguard Energy ETF (NYSEARCA:VDE), or the SPDR S&P Oil & Gas Explore & Production ETF (NYSEARCA:XOP) are quite a bit more reasonable, but will still suffer from a great deal of tracking error for various reasons.
Disclosure
This information does not constitute investment advice or an offer to invest or to provide management services and is subject to correction, completion and amendment without notice. Hedgewise makes no warranties and is not responsible for your use of this information or for any errors or inaccuracies resulting from your use. Hedgewise may recommend some of the investments mentioned in this article for use in its clients' portfolios. Past performance is no indicator or guarantee of future results. Investing involves risk, including the risk of loss. All performance data shown prior to the inception of each Hedgewise framework (Risk Parity in October 2014, Momentum in November 2016) is based on a hypothetical model and there is no guarantee that such performance could have been achieved in a live portfolio, which would have been affected by material factors including market liquidity, bid-ask spreads, intraday price fluctuations, instrument availability, and interest rates. Model performance data is based on publicly available index or asset price information and all dividend or coupon payments are included and assumed to be reinvested monthly. Hedgewise products have substantially different levels of volatility and exposure to separate risk factors, such as commodity prices and the use of leverage via derivatives, compared to traditional benchmarks like the S&P 500. Any comparisons to benchmarks are provided as a generic baseline for a long-term investment portfolio and do not suggest that Hedgewise products will exhibit similar characteristics. When live client data is shown, it includes all fees, commissions, and other expenses incurred during management. Only performance figures from the earliest live client accounts available or from a composite average of all client accounts are used. Other accounts managed by Hedgewise will have performed slightly differently than the numbers shown for a variety of reasons, though all accounts are managed according to the same underlying strategy model. Hedgewise relies on sophisticated algorithms which present technological risk, including data availability, system uptime and speed, coding errors, and reliance on third party vendors.