


Summary
- The oil futures curve recently shifted from downward sloping to upward sloping
- This is an indicator that speculators and hedgers are no longer expecting prices to drop in the near term
- However, this cannot be relied on as a strong signal that oil prices have bottomed
- If the curve remains upward sloping, the costs of trading oil will increase significantly regardless of how oil performs
The shifting oil futures curve
As a quick refresher, the oil futures market provides a way of locking in oil prices now for some point in the future. It has become one of the most liquid markets in the world, and is heavily influenced by speculators betting on the direction of the price of oil. In the past two weeks, the futures market has experienced a major shift that deserves attention.
Since fall of 2013, the futures curve has been primarily "downward sloping", which means that the market is expecting prices to decline. For example, in August 2013, you could have locked in a 4% discount on the price of oil if you agreed to buy it four months later. This downward curve has persisted for the majority of 2014, and in hindsight, has proven to be an excellent predictor of the recent major oil correction.
You can more easily visualize the changing shape of the curve with the following data, which estimates the shape of the futures curve by comparing the price of the 4 month futures contract (you buy oil 4 months from now) to the price of the nearest oil futures contract (you buy oil within the next month). When the 4 month price is higher, the curve is upward sloping, and vice versa when it is lower. Data points have been collected monthly since 2000.
Historical shape of the oil futures curve
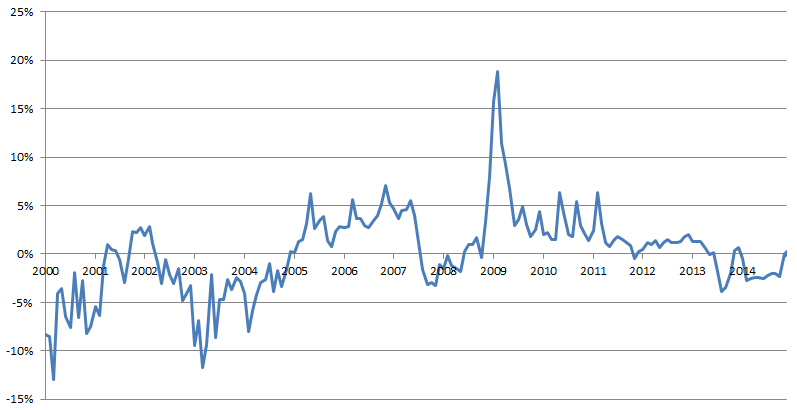
In the past two weeks, the shape of the curve shifted for the first time in over 10 months. Futures prices are now slightly more expensive than the spot price across the board. Many will point to this as a sign that the oil market is bottoming - but can this be considered a reliable indicator?
How good are the speculators at predicting the market?
The shape of the oil futures curve at any point is basically the summation of all the bets on the market. However, this 'net bet' is only the outcome of an extremely complex set of factors, and like any bet on the market, there are always people on both sides. Still, if the majority is betting in one direction, it is worth analyzing how often it has been correct.
To get a sense of this, we have compared the shape of the futures curve (shown above) to the following 12 month performance of the price of oil.
Shape of the futures curve (X-Axis) vs. 12 month oil price performance (Y-Axis)
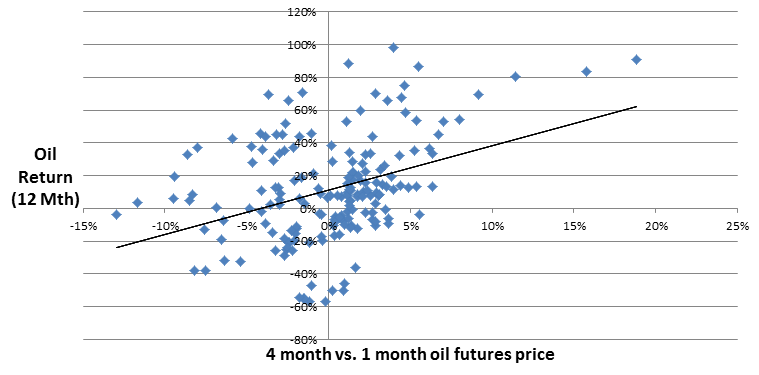
The futures curve has basically been 'correct' whenever both the X and Y values are directionally the same. A trendline has been added to show that there is indeed some predictive power here. As the futures curve gets more positive, oil tends to perform better over the next year. However, this trendline is not particularly strong, which you can see by the massive scattering of data points. In fact, the futures curve has been 'incorrect' about 40% of the time (i.e., the data points in the top-left and bottom-right of the scatterplot).
Another observation worth noting is how much more random the data points become when the futures curve is roughly flat (i.e., the X-values around 0%). The most likely explanation for this is that a flat futures curve means the market is basically split down the middle, and there is no consensus for what oil will do over the next year. Unfortunately, that is right around where we are today.
While it may be true that the market consensus is 'less bearish' now than it was over the past year, there is little reason to consider this a sign of an imminent recovery.
When will the futures curve matter?
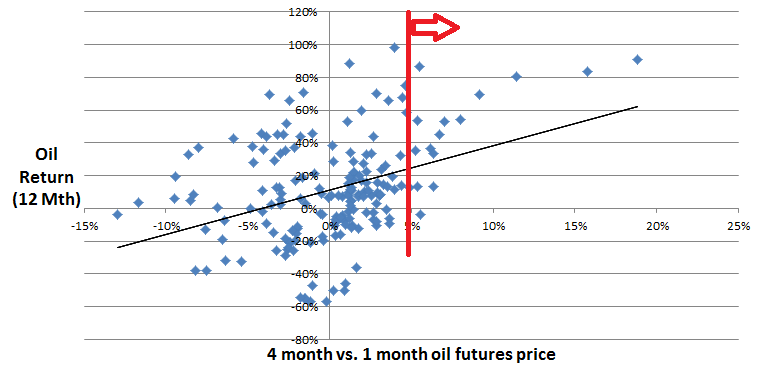
While the current state of the futures curve provides little indication on the direction of oil prices, it is worth observing carefully over the next few months. The key is to track whether the 'net bet' becomes heavily bullish again, at which point its predictive power would increase significantly. This becomes more obvious if we highlight only the areas of the previous graph where the futures curve has been upward sloping by 5% or more.
If you'd like to keep track of this on an ongoing basis, you can find updated information on the current state of the futures curve here.
Oil trading strategies may become much more expensive
Regardless of the future direction of oil prices, the shape of the oil futures curve has immediate implications for your trading strategy. If the curve remains upward sloping, any oil ETF holding futures contracts will begin paying a premium every month, since it has to buy contracts that are more expensive than the spot price of oil. This will be especially impactful for the popular United States Oil ETF (USO) and iPath S&P GSCI Crude Oil ETN (OIL), but will also impact others, such as the PowerShares DB Oil ETF (DBO) and United States 12 Month Oil ETF (USL).
This is a particularly difficult situation because trading oil is becoming more expensive just as the market is becoming more bullish. However, there are alternative trading strategies to help mitigate this issue, which are discussed more in-depth here.
Conclusion
While the oil futures curve has been shifting radically the past few weeks, it provides little information as to the future of oil prices. However, you may need to reconsider your trading strategies if you plan on continuing to get exposure to oil, or the futures curve will start costing you a hefty premium.
Disclosure
This information does not constitute investment advice or an offer to invest or to provide management services and is subject to correction, completion and amendment without notice. Hedgewise makes no warranties and is not responsible for your use of this information or for any errors or inaccuracies resulting from your use. Hedgewise may recommend some of the investments mentioned in this article for use in its clients' portfolios. Past performance is no indicator or guarantee of future results. Investing involves risk, including the risk of loss. All performance data shown prior to the inception of each Hedgewise framework (Risk Parity in October 2014, Momentum in November 2016) is based on a hypothetical model and there is no guarantee that such performance could have been achieved in a live portfolio, which would have been affected by material factors including market liquidity, bid-ask spreads, intraday price fluctuations, instrument availability, and interest rates. Model performance data is based on publicly available index or asset price information and all dividend or coupon payments are included and assumed to be reinvested monthly. Hedgewise products have substantially different levels of volatility and exposure to separate risk factors, such as commodity prices and the use of leverage via derivatives, compared to traditional benchmarks like the S&P 500. Any comparisons to benchmarks are provided as a generic baseline for a long-term investment portfolio and do not suggest that Hedgewise products will exhibit similar characteristics. When live client data is shown, it includes all fees, commissions, and other expenses incurred during management. Only performance figures from the earliest live client accounts available or from a composite average of all client accounts are used. Other accounts managed by Hedgewise will have performed slightly differently than the numbers shown for a variety of reasons, though all accounts are managed according to the same underlying strategy model. Hedgewise relies on sophisticated algorithms which present technological risk, including data availability, system uptime and speed, coding errors, and reliance on third party vendors.