


Summary
- The drawdown of 2022 has been close to ideal from a risk management perspective.
- Hedgewise has had historically low asset exposure levels since January, which has both limited the size of the drawdown and created opportunity to invest at cheaper prices.
- In the most likely scenario of a moderate-to-severe recession, Hedgewise expects the Risk Parity "Max" strategy to gain 30% to 40% over the next 12 to 24 months.
Introduction: Deconstructing "Good" Losses
The last Hedgewise newsletter discussed why this year’s losses were "good" because they were relatively moderate and created opportunity for additional future gain. Counterintuitively, greater subsequent loss would be welcome for the same reason. Fast forward to today, and we've experienced just that. This is positive, but it can be very challenging to grasp how in real-time. We'll analyze this in practical, granular detail to better understand the dynamic and to specifically visualize how the next 12 to 24 months are likely to play out.
At the simplest level, a loss is good if you can subsequently buy-in at a cheaper price. The key question is how your exposure level at the beginning of any drawdown compares to your total potential exposure. For example, an ideal scenario would be moving from 0% exposure at a peak to 100% at a bottom, but this would require perfect timing and foresight. The Hedgewise Risk Parity strategy is built to achieve a similar dynamic systematically, and its success can be measured by how its asset weights compare to historical averages during periods of loss.
Hedgewise 2022 Average Exposure by Asset Class vs. Historical Average, Risk Parity "Max"
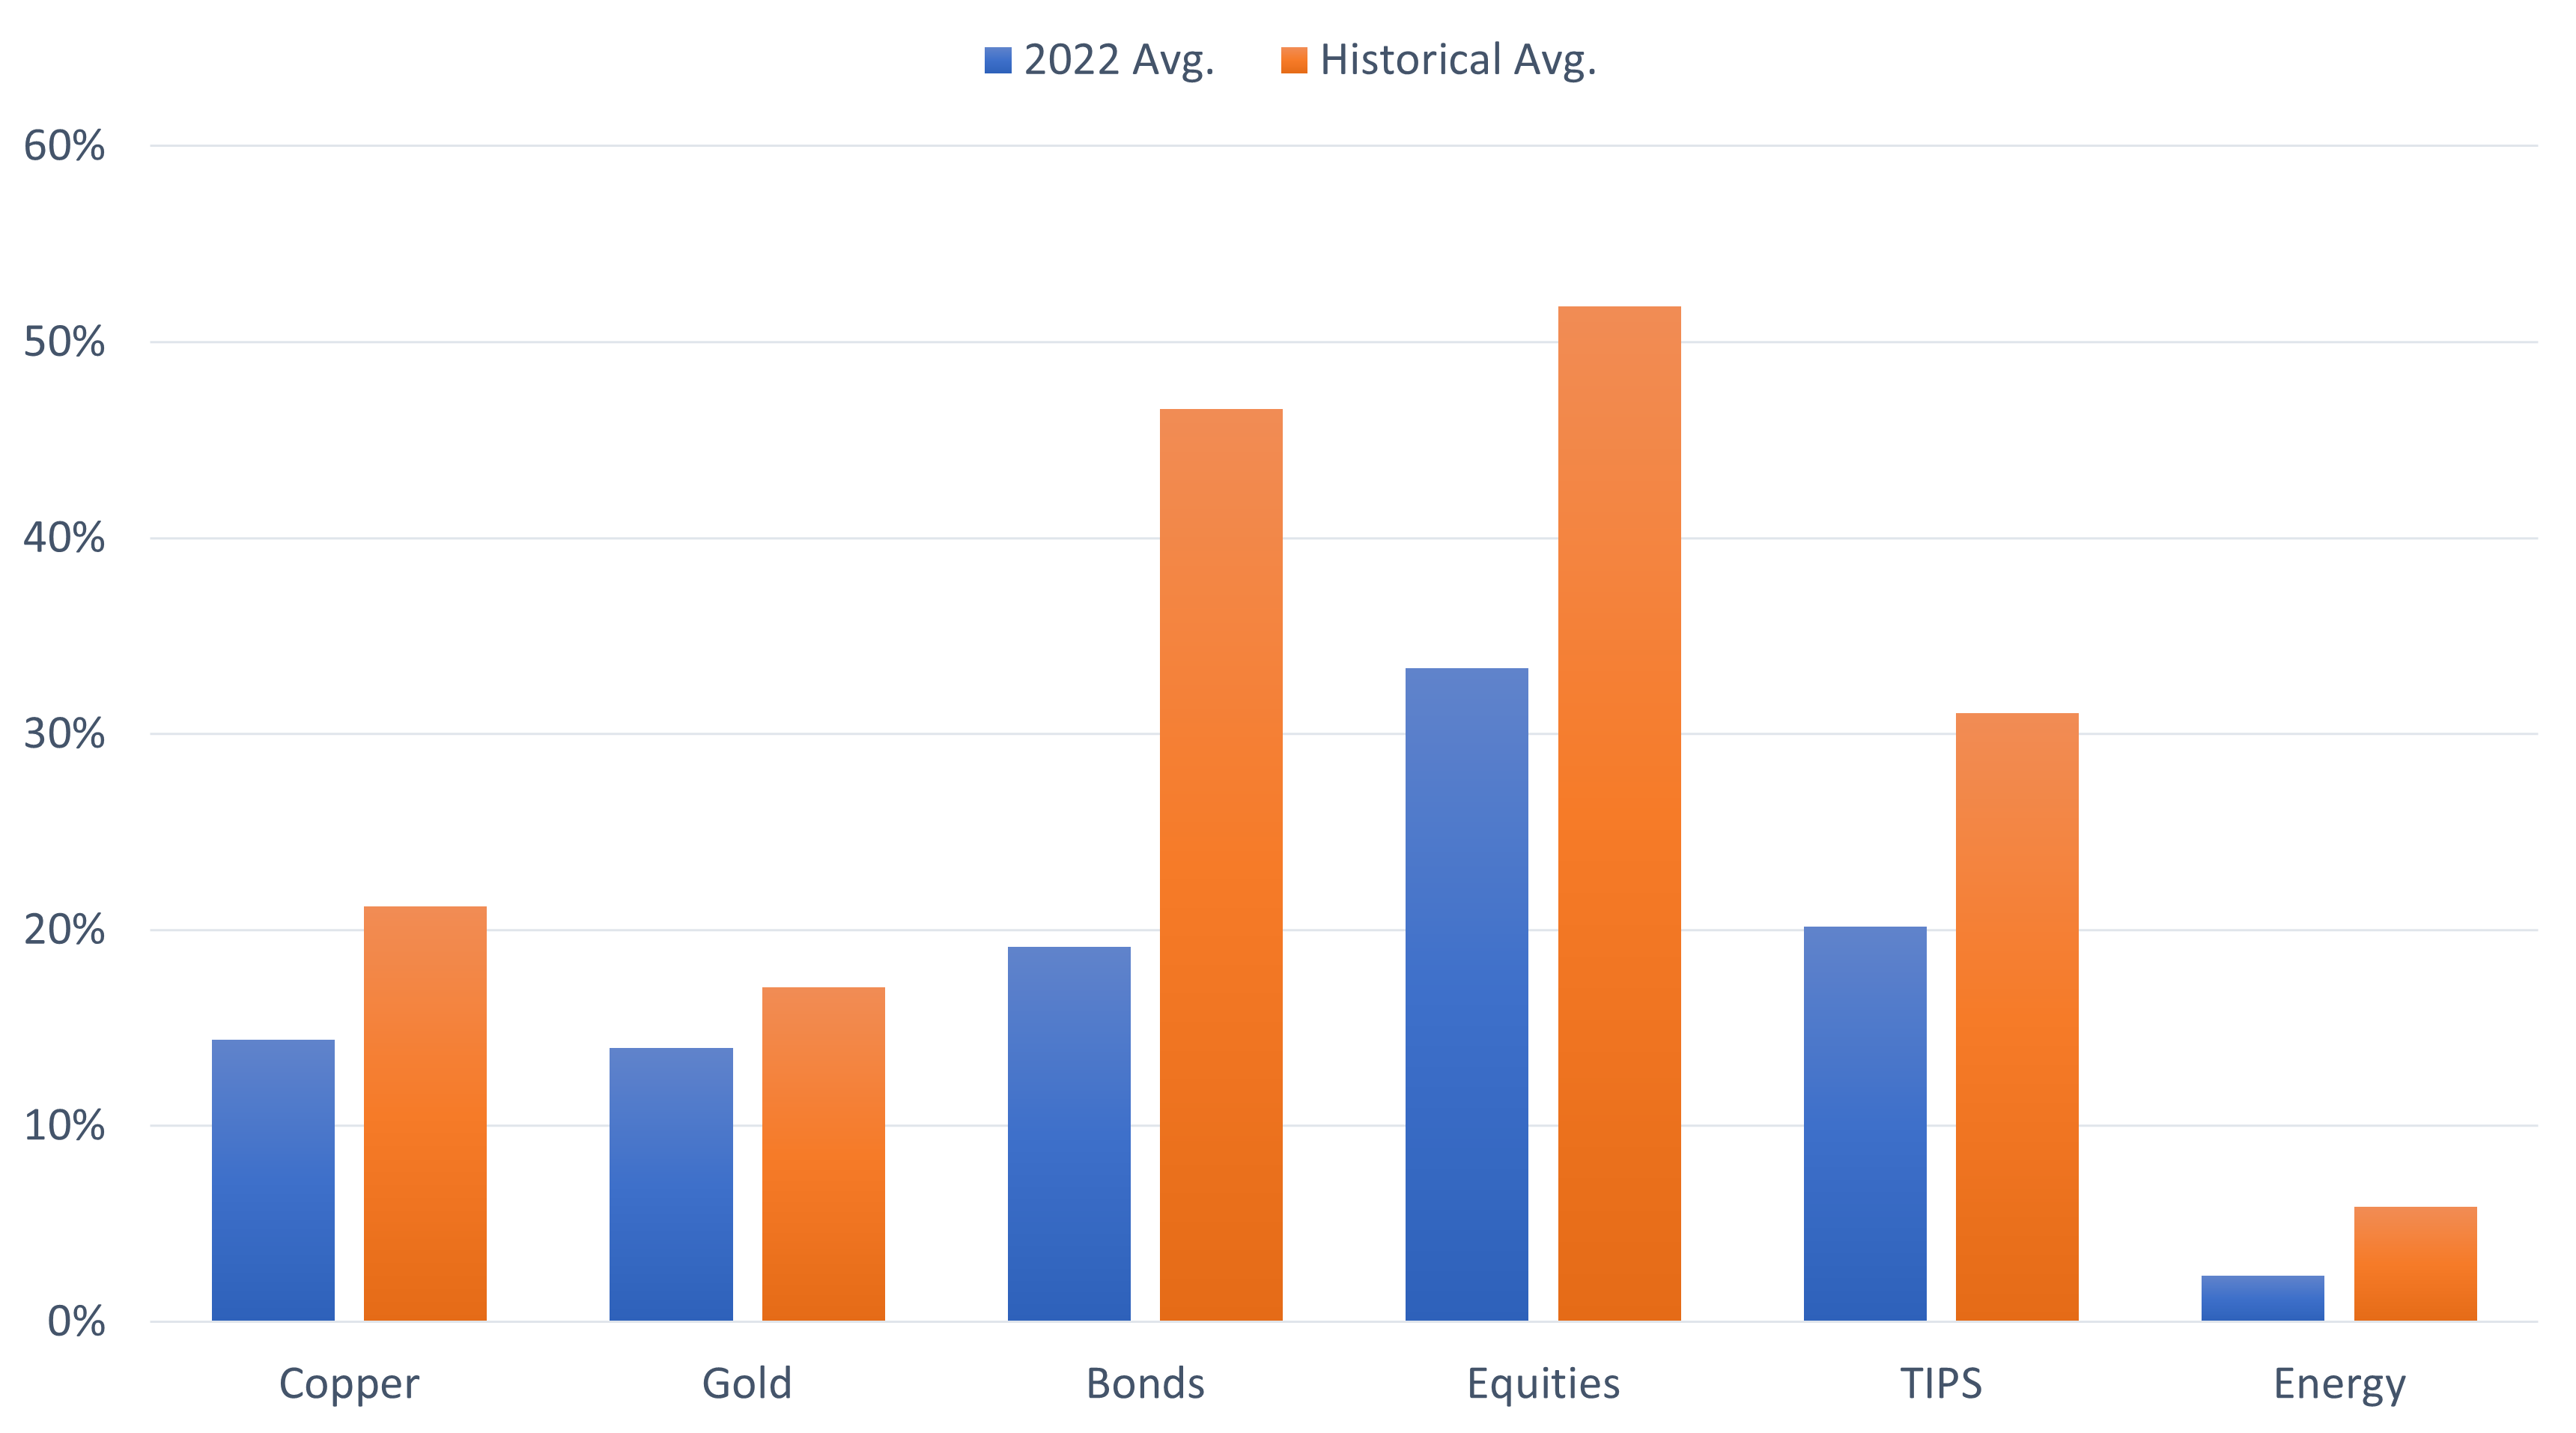
Across the board, Hedgewise exposure throughout 2022 has been significantly lower than historical averages. This simultaneously moderates the drawdown as it occurs, while presenting the opportunity to increase exposure once asset prices have fallen.
To better visualize this, the following graph shows how this year's performance in the RP Max strategy compares to the hypothetical "historical average" portfolio from above.
2022 RP Max Live Performance vs. "Historical Average" RP Max Portfolio
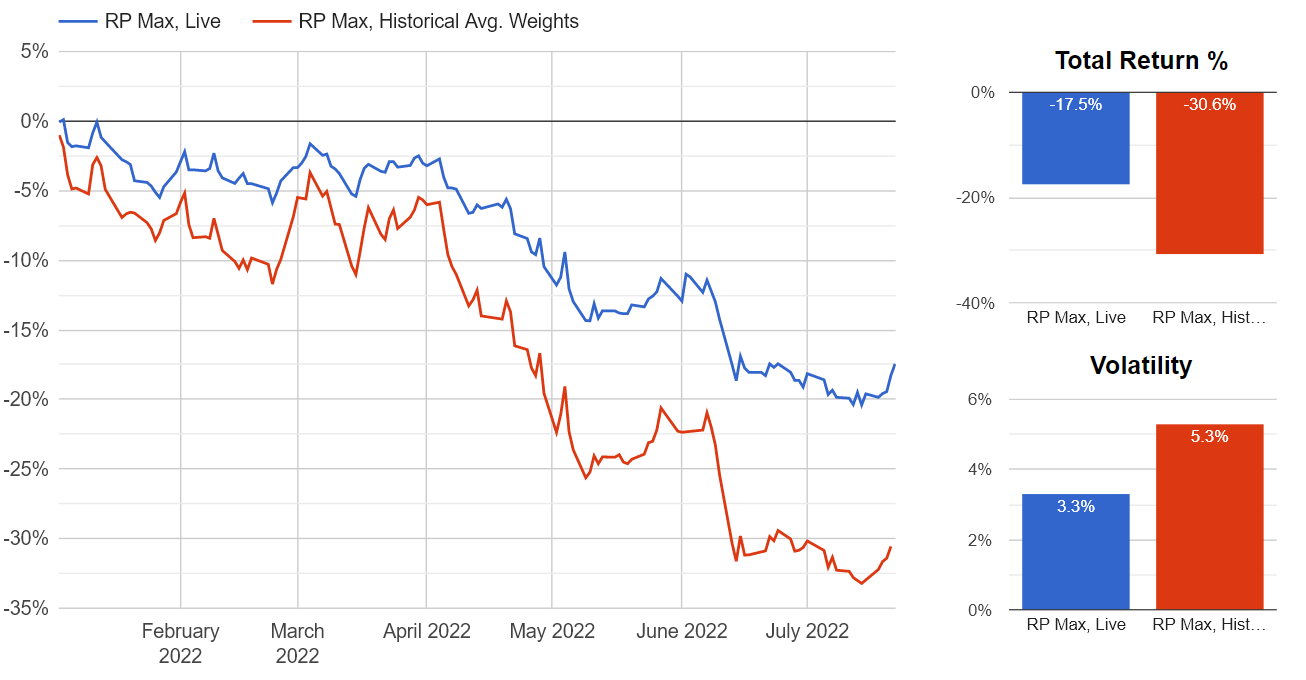
Hedgewise has nearly halved the drawdown of this year compared to a more passive approach, but this does not fully capture the potential positive impact. Now that asset prices are so much cheaper, Hedgewise has an opportunity to increase exposure back in line (or even above) its historical averages. This would drive future gains that outsize the initial drawdown, and this potential increases the more that the red and blue lines above diverge.
For example, the "historical average" portfolio has a current YTD loss of 30.6%. It would require a subsequent gain of 44% to return to breakeven (the percentage gains required to offset any loss are always higher mathematically since you are starting from a lower base). If Hedgewise participated in this gain from today forward, it would wind up with a +19% total return, even though asset prices had only returned to the same levels as the start of 2022 (mathematically, this is the -17.5% loss in the live portfolio multiplied by a 44% gain). These potential gains are only "created" because of the initial loss.
To illustrate this further, here is the same math run at various dates this year. In each case, it shows the potential "created" gain for the Hedgewise portfolio given the loss for the "historical average" portfolio.
Potential Future Gain Created by Equalizing Exposure After Losses
| "Historical Avg." Loss | Live Portfolio Loss | Potential "Created" Gain" | |
|---|---|---|---|
| Feb 22 | -5% | -2% | 4% |
| May 22 | -22% | -12% | 14% |
| Current | -31% | -18% | 19% |
Potential return for the strategy is higher now than it was in January, prior to any drawdown. The additional losses in May and June have only increased it further.
To be clear, this is being discussed from a probabilistic perspective, and these gains are not guaranteed. To capture them, the portfolio must first return to the historical average weights at or near the bottom, and then a full recovery must ensue. But it is still accurate to say that potential opportunity has increased throughout the course of this year, and that it would not exist if these losses had not occurred.
The remaining question is whether Hedgewise will succeed in taking advantage of this. If the portfolio returns to historical average weights but asset prices decline further, additional opportunity will be missed. The same is true if the portfolio fails to increase weights before asset prices recover.
The good news is that there is a systematic way to approach this problem, and it is why so much time has been spent discussing the Fed and interest rates over the past two years. Unlike other assets, bonds have a more specific range of outcomes which allows Hedgewise to greatly increase its odds of success.
Bonds, the Big Picture, and 2022
Stepping back to a bigger macroeconomic picture, bonds are unique compared to riskier assets like stocks or commodities because interest rates are controlled by the Fed and generally operate within a band of stimulative, neutral, or restrictive. The "neutral" rate is continuously predicted and published by the Fed, and everyone expects rates to spend most of their time around this level (because stimulative/restrictive rates are reserved for periods of recession/overheating, which should be infrequent).
The current estimate of the neutral rate is 2.4%. Here is a look at how the interest rates on 30yr Treasury bonds have moved in 2022 compared to this.
30yr Treasury Bond Interest Rates vs. Neutral Rate, 2022 YTD
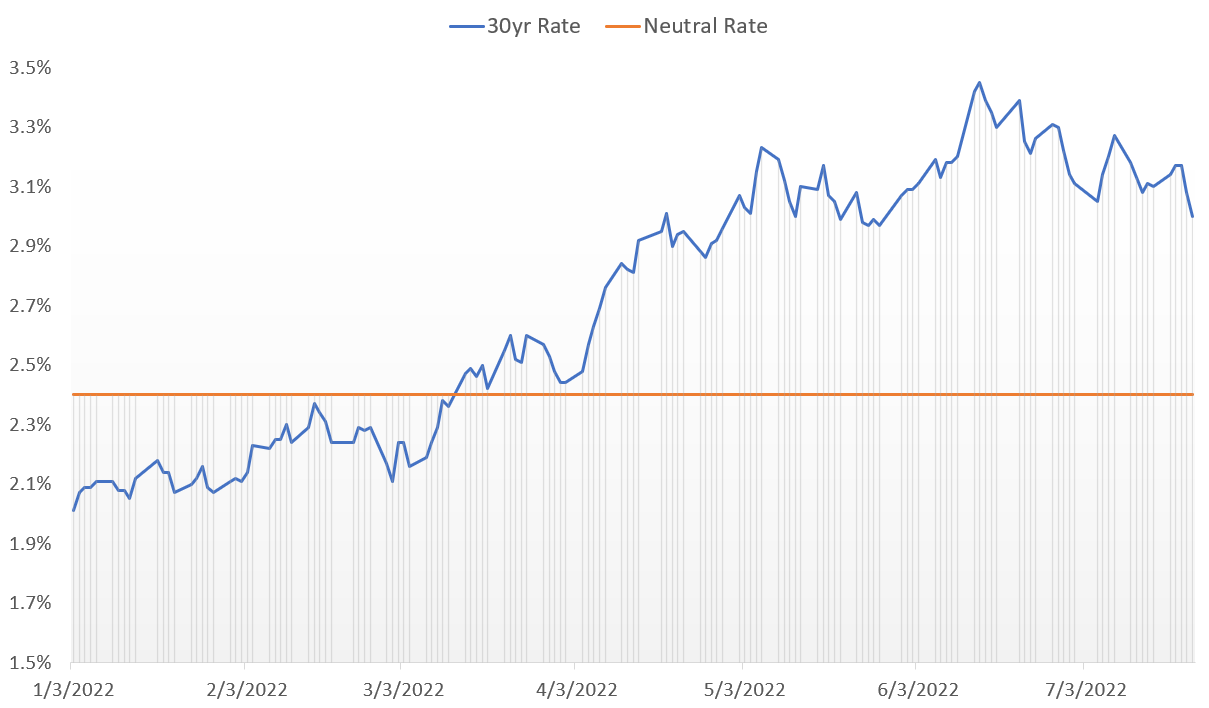
The Fed has moved from stimulating the economy at the start of this year to restricting it to fight inflation. So long as you believe that the neutral rate is correct and that the Fed will eventually succeed in bringing down prices, this means 30yr interest rates should eventually fall closer to the orange line. If that happens, bond prices would rise by about 18% in addition to the 3%+ coupon paid out in the interim.
While these assumptions could be wrong - maybe the neutral rate is higher, or rates will have to become much more restrictive to beat inflation - bonds are without question a much less risky investment now than they were at the beginning of 2022. With this in mind, here are the monthly bond exposure levels of the Hedgewise RP Max portfolio this year.
Hedgewise Total Bond Exposure in the Live RP Max Portfolio, 2022 YTD
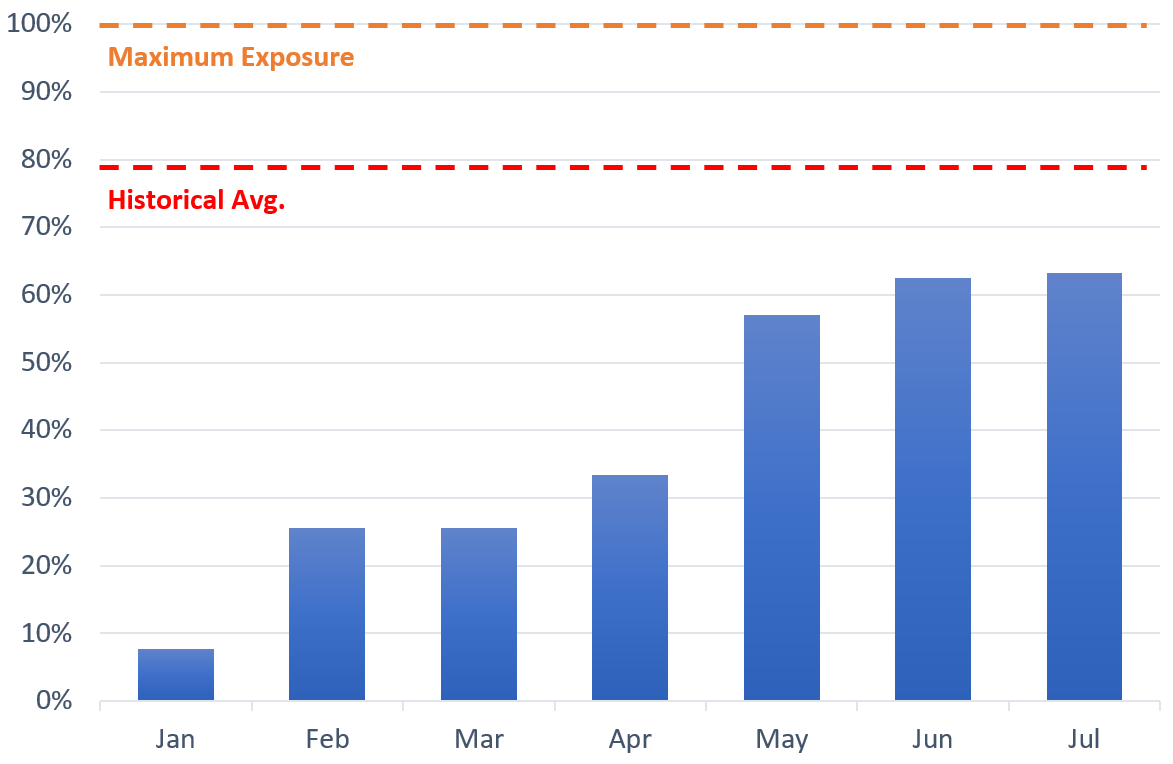
Bond exposure in the Hedgewise portfolio automatically adjusts as rates move from stimulative to restrictive, ensuring that it can capture much of the "potential" gain discussed earlier. However, note how there is significant room to add exposure. If rates continue higher, this would be viewed positively until the "maximum" exposure level is reached. Ironically, this would drive both near-term loss and longer-term expected gain in parallel.
To be fair, this would no longer function if rates rose and stayed high indefinitely, e.g., if the neutral rate were 4% or higher. I believe that is unlikely because it would imply long-term inflation expectations higher than 3%, which is in direct conflict with the Fed's mandate of targeting inflation of 2%. If inflation expectations were that high, the Fed would maintain a restrictive stance to continue to drive down demand until inflation was also subdued. In other words, it is much more likely that the Fed destroys growth than that it permits inflation to exceed 3%, which means a prolonged recession is a much higher likelihood than a neutral rate over 4% (and Chairman Powell has essentially said this outright).
Perspective on the Past and Future
In January 2022, the RP Max portfolio had historically low exposure to both equities and long-term bonds. If you had asked me at the time for the ideal scenario in six months, it would have been for both asset classes to lose 20-30% as quickly as possible. This would enable higher long-term returns for the portfolio and increase the ability of stocks and bonds to properly hedge each other across different economic environments.
Fast forward to today, and we have come close to a perfect landing. On the margins, it would have been nice if it happened a little bit faster and if both asset classes lost a little bit more (they still might, which would be good!). In theory, commodities should have held up more strongly in such an inflationary environment, but their weights have also been below historical averages, so this presents additional opportunity. Overall, this has gone well, but it takes some perspective to understand how this sentiment logically applies to a 20% drawdown.
This is easier to conceptualize when you look ahead. The portfolio is already well-positioned to gain 30-40% whenever the underlying asset classes breakeven with January 2022 (This equates to a net gain of 10-15% if you were measuring from the beginning of this year). My best estimate is that this happens between mid-2023 and early 2024, depending on the specific asset. The outcome has the potential to be even better depending on how market risk evolves and whether prices continue to fall. These gains will have been "created" by the losses of this year, and no timing or judgment is required.
It can be difficult to embrace this process because these concepts do not exist for purely passive investors. If you invest in 100% stocks, you can only make back what you lose, and any drawdown is unwelcome. For Hedgewise, drawdowns can take many different forms, and the present one is already "good" with the potential to be "great", depending on the shape of the recovery.
Some Final Counterintuitive Thoughts
I've frequently advised clients this year that it is a great opportunity to put money to work, and it is only getting better and better along the way. That was as true in January 2022 as it is today, despite the 20% drawdown (at the RP Max risk level) that has occurred since. How can this be?
The simple reason is that return expectations have been consistently positive. In perfect hindsight, if we returned to January 2022, your expected return by mid-to-late 2023 would be 10-15%. Not only does this account for the present drawdown, but those gains are dependent upon it!
In every subsequent month since then, the expected return has only improved, and if you happen to be sitting on cash presently, there is a high likelihood of gaining 30-40% by the end of next year. It is easy to get hung up on predicting the exact bottom, but realistically, these are all good entry points, especially when Hedgewise is systematically taking advantage of additional losses along the way. If you happen to call it perfectly, whether through luck or skill, that is like an extra "active management" bonus. But realizing a slightly lower gain without any judgment or timing is also a great outcome.
The losses incurred this year have been close to ideal. The portfolio has held near-minimum exposures in most asset classes since January and now has an opportunity to take advantage of lower prices, which is already happening systematically in the bond market. A hard landing would be a great outcome and more losses would be welcome. Worst case, the economy recovers too quickly, and you make back your money without as much "extra" gain. This is exactly how a good hedge should work, and all that it requires is the patience and time to see it through.
Disclosure
This information does not constitute investment advice or an offer to invest or to provide management services and is subject to correction, completion and amendment without notice. Hedgewise makes no warranties and is not responsible for your use of this information or for any errors or inaccuracies resulting from your use. Hedgewise may recommend some of the investments mentioned in this article for use in its clients' portfolios. Past performance is no indicator or guarantee of future results. Investing involves risk, including the risk of loss. All performance data shown prior to the inception of each Hedgewise framework (Risk Parity in October 2014, Momentum in November 2016) is based on a hypothetical model and there is no guarantee that such performance could have been achieved in a live portfolio, which would have been affected by material factors including market liquidity, bid-ask spreads, intraday price fluctuations, instrument availability, and interest rates. Model performance data is based on publicly available index or asset price information and all dividend or coupon payments are included and assumed to be reinvested monthly. Hedgewise products have substantially different levels of volatility and exposure to separate risk factors, such as commodity prices and the use of leverage via derivatives, compared to traditional benchmarks like the S&P 500. Any comparisons to benchmarks are provided as a generic baseline for a long-term investment portfolio and do not suggest that Hedgewise products will exhibit similar characteristics. When live client data is shown, it includes all fees, commissions, and other expenses incurred during management. Only performance figures from the earliest live client accounts available or from a composite average of all client accounts are used. Other accounts managed by Hedgewise will have performed slightly differently than the numbers shown for a variety of reasons, though all accounts are managed according to the same underlying strategy model. Hedgewise relies on sophisticated algorithms which present technological risk, including data availability, system uptime and speed, coding errors, and reliance on third party vendors.