


Summary
- Risk signals have rocketed in every asset class over the past few weeks, as markets are now pricing in a great deal of uncertainty related to the election.
- Hedgewise strategies continue to strongly outperform YTD despite losses in October.
- Client portfolios are well-prepared for any outcome on Tuesday.
Election Nerves Rattling Markets, But Some Assets Look Worse Than Others
Markets hate uncertainty. This is probably why until mid-October, election news was not having much impact. However, as the race has tightened, the general perception of risk has increased in every asset class, resulting in a sell-off across the board.
October Performance: Investors Selling Everything as Risk Increases
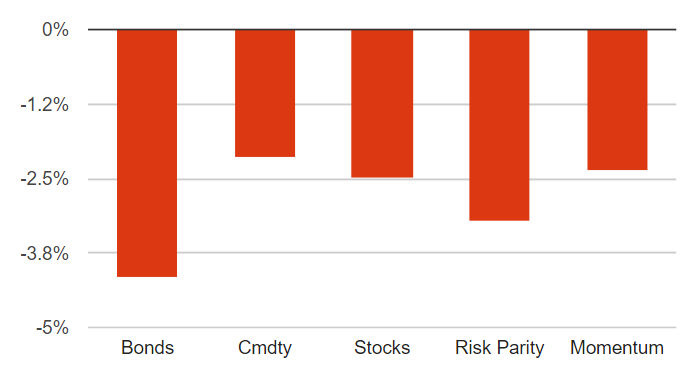
In this kind of environment, losses are inevitable. However, some assets continue to look far riskier than others. Long-term bonds, in particular, are pricing in a greater possibility of continued losses than equities, and Hedgewise models have been adjusting accordingly. This kind of dynamic, asset class-specific risk management is key to long-term outperformance, which has been easy to see so far this year.
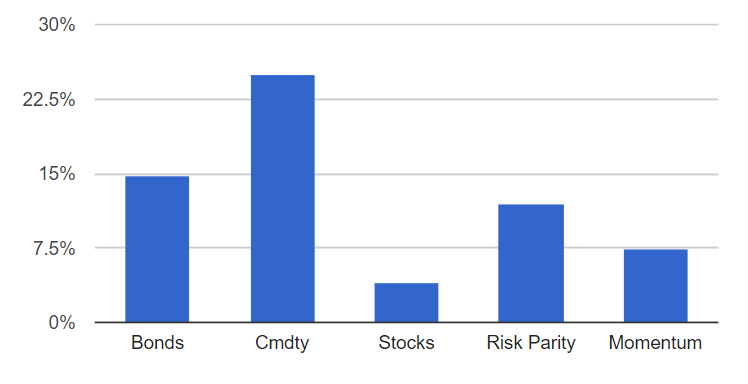
YTD Performance: Hedgewise Portfolios Continue to Significantly Outperform Equities
While there will still be months of losses like October, all Hedgewise portfolios remain quite resilient against sustained drawdowns. It is impossible to say whether one will happen due to the election, but by systematically accounting for the possibility, your outlook is better regardless.
Avoiding the Biggest Losses is Hugely Meaningful and Very Possible
It is entirely possible to build a more stable, positive return stream by spreading risk across multiple asset classes and accounting for the possibility of extreme losses.
To help demonstrate this, I took a few different cuts of data going back to the 1970s. First, I examined the distribution of monthly returns of the S&P 500 compared to Hedgewise model portfolios (which use the same algorithms being used today, but a more limited set of asset classes and risk data).
Single month returns are a useful measure because they help show how months of poor performance, like October, are rare events. While they will still occur, they happen far less frequently in Hedgewise portfolios and have a far lower chance of repeating.
Distribution of Monthly Returns, 1972 to Present
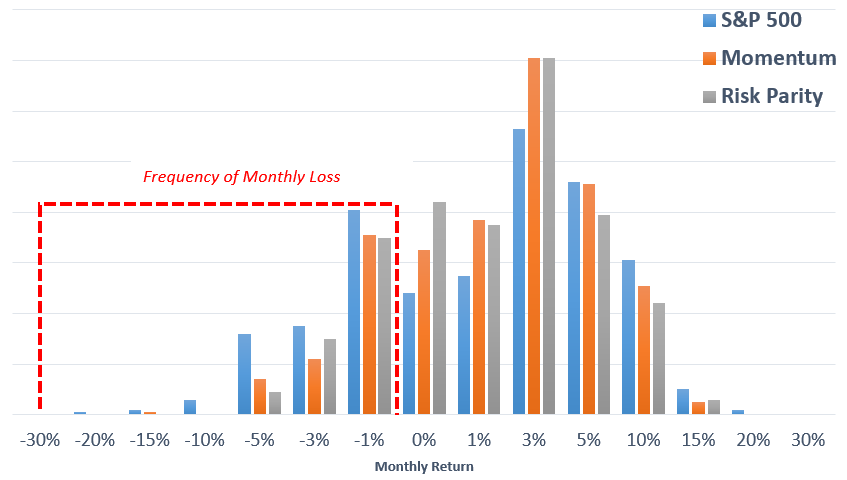
The bars in the graph show the frequency of one-month returns within each strategy. I've highlighted the portion of the graph which shows monthly losses. The S&P 500 has both higher and more frequent losses than either Hedgewise framework, meaning you experience many more months of small losses (3 to 5%) as well as a few which are catastrophic (10% or more). Also notice how much more effectively the Hedgewise portfolios cluster positive returns. This is consistent with the theory: we are optimizing for a stable portfolio with more consistent gains.
This remains true if you expand your time horizon to annual returns, which help to better highlight cumulative performance over time.
Distribution of Annual Returns, 1972 to Present
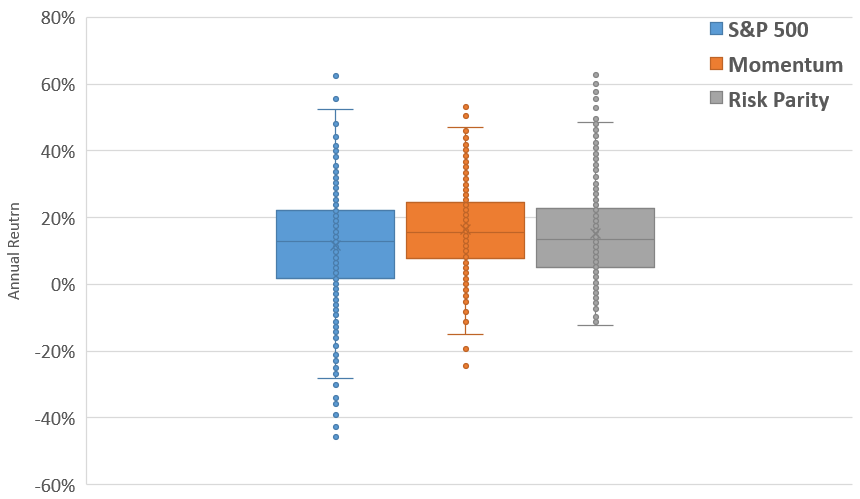
Again, the S&P 500 has a far greater likelihood of loss than either Hedgewise strategy. Risk management helps to eliminate significant drawdowns without decreasing overall returns or limiting gains. Importantly, this also demonstrates how equities often experience many consecutive months of poor returns, resulting in annual drawdowns of 40% or more. Hedgewise strategies show the opposite: poor monthly returns usually reverse, thus limiting your maximum annual drawdowns.
As an aside, notice that Momentum is a slightly more aggressive framework, and thus has a higher average return than Risk Parity but also a higher risk of loss. As such, it is generally only recommended to clients with a longer time horizon and higher risk tolerance.
Finally, I thought it would be a bit more intuitive to look at the realized return in each strategy by calendar year.
Return by Calendar Year, 1972 to 2015
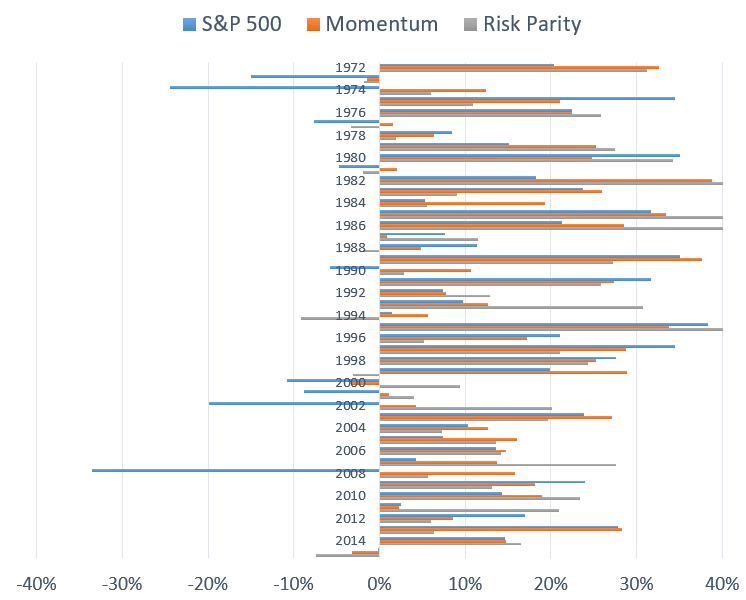
I am particularly fond of this graph for a few reasons. It highlights both the consistency and severity of equity pullbacks, which have historically happened 1-2x per decade. It shows how the Hedgewise frameworks, while not immune to loss, have far fewer bad years and with relatively moderate drawdowns. Finally, it emphasizes one of the most important keys to successful investing regardless of where you have your money: if you just had a bad year (or month, or day), be patient. Historically, you have always been rewarded so long as you stay steady.
Wrapping Up: The Election Is Just Another Day
Markets could very well be surprised this Tuesday, but Hedgewise portfolios are already constructed to help mitigate any losses and to adapt as market conditions change. The reality is that risk is a constant force across all assets, and events like Election Day simply make it more obvious. In a way, such events help to shine a light on why financial risk management continues to gain prominence. While I certainly hope the outcome on Tuesday leads to more stability and economic growth in this country, I'm grateful to have my own money invested in strategies built on the foundation that anything might happen.
Disclosure
This information does not constitute investment advice or an offer to invest or to provide management services and is subject to correction, completion and amendment without notice. Hedgewise makes no warranties and is not responsible for your use of this information or for any errors or inaccuracies resulting from your use. Hedgewise may recommend some of the investments mentioned in this article for use in its clients' portfolios. Past performance is no indicator or guarantee of future results. Investing involves risk, including the risk of loss. All performance data shown prior to the inception of each Hedgewise framework (Risk Parity in October 2014, Momentum in November 2016) is based on a hypothetical model and there is no guarantee that such performance could have been achieved in a live portfolio, which would have been affected by material factors including market liquidity, bid-ask spreads, intraday price fluctuations, instrument availability, and interest rates. Model performance data is based on publicly available index or asset price information and all dividend or coupon payments are included and assumed to be reinvested monthly. Hedgewise products have substantially different levels of volatility and exposure to separate risk factors, such as commodity prices and the use of leverage via derivatives, compared to traditional benchmarks like the S&P 500. Any comparisons to benchmarks are provided as a generic baseline for a long-term investment portfolio and do not suggest that Hedgewise products will exhibit similar characteristics. When live client data is shown, it includes all fees, commissions, and other expenses incurred during management. Only performance figures from the earliest live client accounts available or from a composite average of all client accounts are used. Other accounts managed by Hedgewise will have performed slightly differently than the numbers shown for a variety of reasons, though all accounts are managed according to the same underlying strategy model. Hedgewise relies on sophisticated algorithms which present technological risk, including data availability, system uptime and speed, coding errors, and reliance on third party vendors.