


Summary
- This year, global markets have experienced the worst and fastest cross-asset drawdown in modern history due to a mix of uncertainty about the war in Ukraine, "Zero Covid" in China, and runaway inflation.
- While painful in the short-term, these losses are surprisingly a positive development. With a fuller understanding of how Hedgewise functions in the current environment, we can see why bigger short-term losses are preferred.
- The Hedgewise algorithm is built to systematically "convert" every 1% loss into a larger expected long-term gain. We will examine this in-depth in the bond market, where the dynamic can be most easily understood.
- The current Hedgewise drawdown is much smaller compared to similar historical periods as well as major Risk Parity competitors, which further improves future potential upside.
- The prevailing environment of panic alongside Fed tightening is one of the most accurate historical signals that a bottom is close, but any additional loss will only add to total expected returns in time.
Overview: We Knew It Was Coming, But It Happened Fast
For the past two and a half years, Hedgewise has been analyzing how markets would behave against a backdrop of a "Fed-induced bubble" and cautioning against getting involved in its many strange distortions (i.e., meme stocks, negative yields, SPACs, crypto). A culmination of events in March and April has swiftly unwound most of the bubble, and while its speed and depth has been historically unprecedented, global markets – and Hedgewise in particular – will be better off for it.
As a quick, and hopefully final, refresher of how the Fed created a bubble, here is the familiar visualization of how near-zero interest rates affect expected asset returns over time. It literally "pulls" returns from the future into today, and at the extremes, it can create negative future return expectations (for example, negative real yields mean you are guaranteed a negative real loss on your money)
How Passive Expected Total Returns Change Over Time with Zero Interest Rates
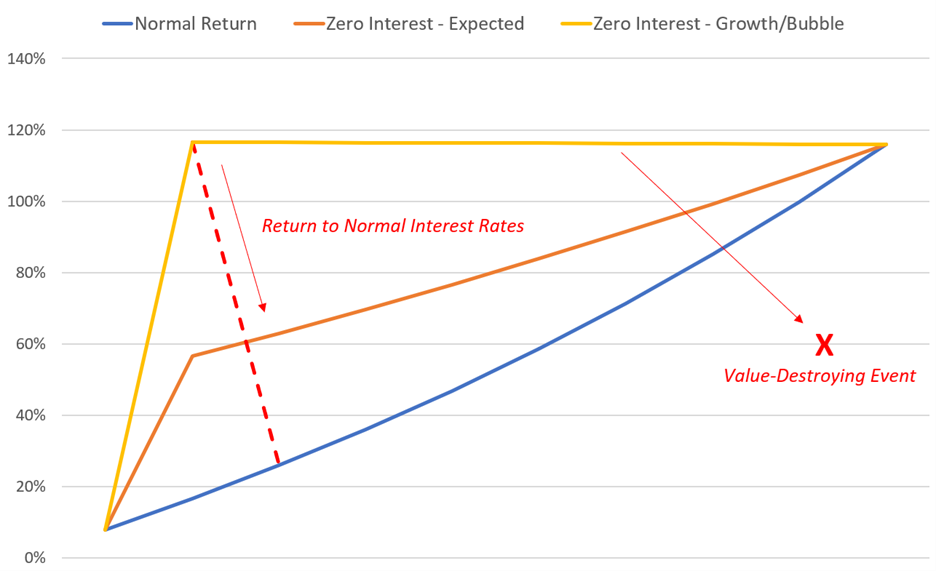
The Fed got itself in a mess by pushing the bond market towards the yellow line with its overaggressive stimulus, and then lots of other assets followed suit. They were crossing their fingers that they could leave these policies in place for long enough for the 'real' world to catch-up. This would have looked like a few years going by with moderate inflation, and asset prices would have been mostly flat while they slowly raised rates along the way (i.e., the horizontal yellow line remains flat until it eventually intersects with normal returns).
The trouble is that this required inflation to stay relatively low, and for nothing "bad" – like a war, for example – to happen to the world in the meantime. In 2022, we experienced all of that at once, and markets are moving down the red lines accordingly.
For passive investors this is bad news, as many asset prices are completing a round trip to zero (or worse) compared to before the pandemic began. This is the problem with a Fed-controlled environment: they are moving money around in time, but not increasing the fundamental pie.
For Hedgewise, on the other hand, the potential return that was just pushed to the future will be larger than its near-term losses. This is possible because of specific Hedgewise algorithms that take advantage of this environment and because the portfolio has positioned cautiously throughout this era to account for its likely reversal. In short, Hedgewise will systematically own more of these assets when they recover than it does when they are falling, and this can be shown both in theory and in practice.
Still, this can be a hard pill to swallow, and it can feel wrong to accept another 5% loss now even if it leads to an extra 5% net gain in the future. Why not just avoid the drawdown altogether and re-enter at the bottom? It is crucial to maintain perspective that there is a better chance that markets have already bottomed than that they have not, and that becomes more and more likely as prices fall further. The Hedgewise methodology takes advantage of those losses without having to time them and avoids missing the recovery once we reach the bottom.
As it relates to the present, there is a good case that markets have already overreacted to transitory events like the war in Ukraine and the Covid situation in China. Periods of Fed tightening are also classically volatile because investors tend to fear the worst whenever there is heightened uncertainty, and that effect is being amplified by the Fed's pandemic mistakes. Everyone goes "risk-off" at once, and many assets trade at a discount to fair value simultaneously. These periods have historically predicted some of the best near-term returns for Hedgewise regardless of the final economic outcome.
There is no doubt that this will go down as a historic market event, but it is shaping up to be a good one for Hedgewise so long as you know where to look.
The Big Picture: Measuring "Good" Losses
Periods of loss are fully expected in the Hedgewise framework because it is systematic and involves no judgment or timing. Its long-term success does not come from avoiding loss, but from mitigating the short-term damage through risk management and subsequently taking advantage of cheaper asset prices. From this perspective, the proper way to evaluate any drawdown is its size relative to broader market conditions.
For context, here is year-to-date performance across each asset class.
Performance by Asset Class, 2022 YTD
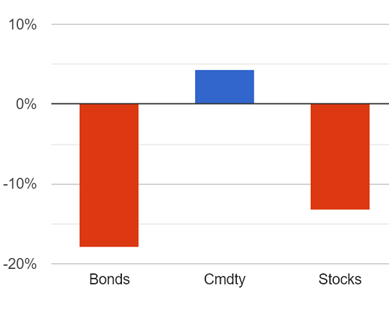
In 2022, bonds are down 18% and stocks are down 13%, while commodities outside of energy have barely moved the needle. Incredibly, if you look back all the way back to 1950 for any similar period of performance, you will not find one. In fact, bonds have only lost 15% or more one time ever in modern history, and that was when Paul Volcker was breaking the back of stagflation in 1980-1981 and raising short-term interest rates to nearly 20%. Back then, gold doubled in price alongside this as investors sought inflation hedges aggressively, but gold is only up about 3% this year.
To emphasize, cross-asset performance over the past four months has been substantially worse than 1980, when inflation had been raging for a decade alongside multiple recessions and energy crises.
While no other episode has been as bad as this one, there have been a handful of other similar cases which all occurred during periods of aggressive Fed tightening (keep in mind that these are purposefully some of the worst data points in history and very rarely occur) The following table shows comparable asset performance during these times alongside model performance of Risk Parity "Max".
Comparison of Asset Performance During Similar Economic Environments vs. RP Max
| Bonds | Equities | RP Max | |
|---|---|---|---|
| Feb-Mar 1980 | -7% | -11% | -24% |
| Jan-Sept 1981 | -12% | -10% | -23% |
| Feb-Jun 1984 | -9% | -4% | -18% |
| Feb-Nov 1994 | -14% | -4% | -18% |
| Current | -18% | -13% | -10% |
In every other similar event, RP Max had nearly twice the drawdown as it does currently against less severe backdrops. 2022 will likely go down as one of most successful periods of loss mitigation for Hedgewise ever.
This relative success can also be measured compared to other major benchmarks. For example, here is how Hedgewise has performed against the two largest passive Risk Parity funds (note that the closest historical benchmark to these funds is the RP "High" risk level).
Performance of Hedgewise vs. Passive Risk Parity Funds
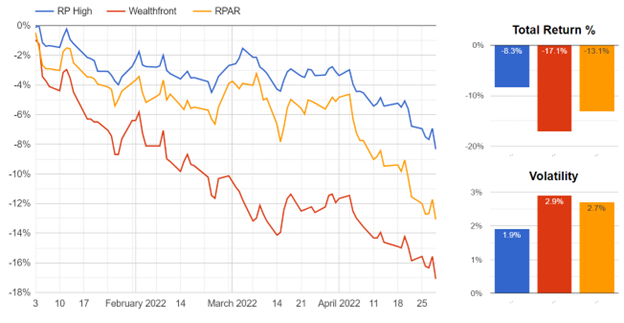
We'll dive into greater detail about the mechanics behind this relative outperformance in a bit, but first it is important to step back to the bigger economic picture. Losses driven by Fed tightening are moving gains back to the future. The deeper the cross-asset drawdown, the more "built-in" rebound accrues. For example, here is how each asset class performed in the 12 months following each of the prior similar periods.
Subsequent 1yr Returns by Asset Class During Similar Economic Environments vs. RP Max
| 30yr Bonds | Equities | RP Max | |
|---|---|---|---|
| March 1980 | 9% | 40% | 44% |
| September 1981 | 47% | 10% | 81% |
| June 1984 | 45% | 31% | 78% |
| November 1994 | 36% | 38% | 99% |
While these numbers might seem challenging to imagine in the present environment, consider a few interesting facts. TIPS bonds will be paying between a 7-10% annualized coupon for the next year to cover inflation. If long-duration bonds eventually return to the long-term "neutral" rate currently estimated by the Fed, they will rally another 12-15%. Equity returns tend to at least match inflation over time because prices and profits eventually move up alongside one another. For stocks to simply match expected CPI of 6% for 2022 (which would mean a 0% real return), the S&P 500 would have to rally over 20% by December.
This highlights the natural duality of an inflationary environment. It is par for the course to have large drawdowns due to persistent uncertainty and price shocks, followed by large rebounds as all assets catch up with prevailing price levels and uncertainty falls. Knowing this pattern, bigger losses are preferred if you can mitigate their impact since they will tend to precipitate a larger relative recovery.
In this sense, current Hedgewise losses are some of the "best" on record. To see these mechanics more clearly, let's do a deep dive into how the Hedgewise algorithm manages its bond exposure in a near-zero interest rate environment.
Fun With Zero Interest Rates: When More Losses Are Better
The way that Hedgewise manages its bond exposure is intuitive: it decreases its exposure as rates approach zero and increases it as they approach more normal levels. This systematically creates a dynamic where bigger losses are better because you keep on increasing exposure along the way (i.e., you are automatically selling higher and buying lower).
As an example, 30yr bonds began 2022 with an interest rate of 2%, and the Fed currently estimates that the "neutral" long-term rate (which is basically its long-term projected level) is 2.4%. Imagine one scenario – let's call it "Inflation Problem" – where rates first rise to 4% before falling back down to 2.4% at the end of three years. In a second scenario ("No Problem"), rates sleepily go from 2 to 2.4% without much volatility in between. The following graph simulates how the Hedgewise algorithm would be expected to perform in each scenario alongside a purely passive bond investment.
Simulated Bond Performance Scenarios, Rates Rise From 2% to 2.4%, 36 Months
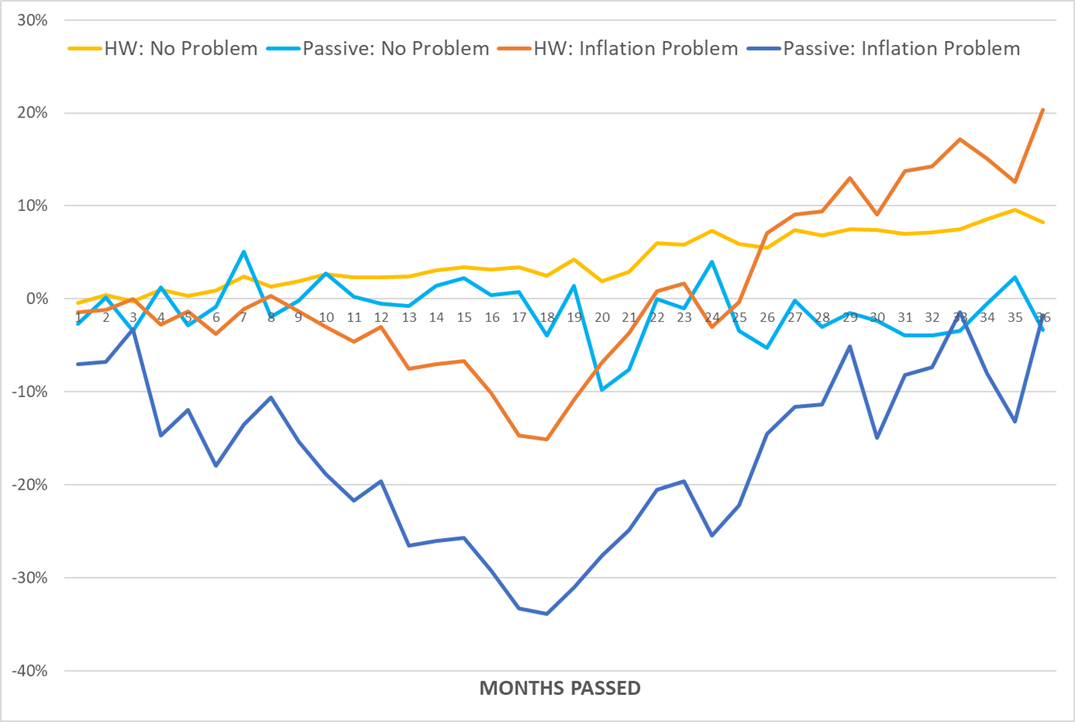
This nicely highlights the various trade-offs. In the "Inflation Problem" scenario, Hedgewise eventually improves its total return by over 10%, but it first must grapple with a 15% drawdown when rates peak at 4%. These two outcomes are inextricably related: you can only get the extra return because of the circumstances created during the drawdown (i.e., you can increase your bond exposure more heavily while receiving a higher coupon payment)
It is interesting to examine this behaviorally. From a financial perspective, this is a solid trade-off, and bigger drawdowns are merely indicators of higher eventual returns. You would not seek to limit it or stop yields from rising even higher. Yet there is a strong human impulse to limit losses however possible, and a common reaction is to ask, "but why not just wait to invest until after the drawdown happened?"
The trouble is that would require knowing precisely when rates had peaked, while Hedgewise benefits no matter where and how that happens. For example, the following graph shows two more scenarios where rates peak at 3% and 3.5% compared to the original 4% we used in the "Inflation Problem". Rates are still assumed to end at the neutral rate of 2.4%.
Simulated Bond Performance Scenarios, Various Rate Peaks, 36 Months
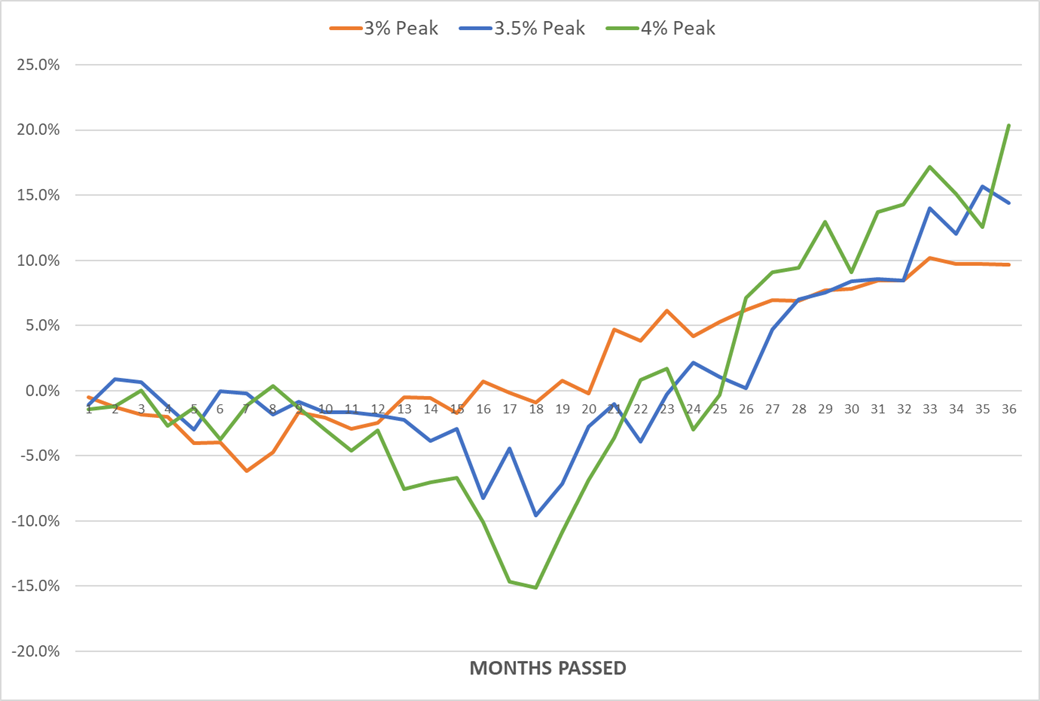
As a reminder, rates are already near 3% right now, and this may well be the peak of this cycle (especially if we hit a recession, which will almost certainly quash inflation and send long-term yields back down). If not, any additional drawdown eventually converts into higher final returns. It is a win-win with no timing required, so long as you can "look past" the necessary drawdown in the middle.
These simulations depend on a terminal rate of 2.4%, but positive total returns would still be expected even if the terminal rate was as high as 4%. If you were intent on making a "bear" case, it would be for rates to reach 4.5%+ perpetually, but it is very difficult to project that realistically given longer-term demographic and technological trends.
This algorithmic approach is unique to bonds in a near-zero interest rate environment, which is why it is such a big deal to understand right now. The current Hedgewise drawdown attributable to bonds falls within this framework, which means the strategy is having a great year in terms of total expected net return.
This dynamic was not available in the similar historical periods highlighted earlier, which explains the much more severe drawdowns that were incurred. However, it is not as if those were "failures" either. At the Max risk level, occasional drawdowns of 20-30% are expected, and do not detract from long-term expected returns. These scenarios are almost always driven by Fed-induced uncertainty, and it is only a matter of time until one or many assets rebound. The same is expected in 2022, but with a significant bonus from the zero-interest rate bond framework.
A Refresher on Fed Tightening
Back in 2018, the Fed underwent a year-long tightening that sent markets tumbling, and Hedgewise published a
This environment tends to happen suddenly and chaotically. It is very difficult to time, but it implies a rapid recovery whenever greater certainty returns. Investors should generally expect deep and quick drawdowns followed by equally rapid recoveries regardless of the actual economic outcome.
To get a better sense of this, the following chart captures every period of disruptive Fed tightening since 1972. The first bar on the graph shows the sum of equity and bond losses over each period to highlight the degree of cross-asset damage. The second bar shows the drawdown in the Risk Parity Max strategy during the same period (note that model data is used prior to 2015, and live data is used since then).
Stock and Bond Performance vs. RP Max Drawdown, Major Fed Tightenings Since 1972
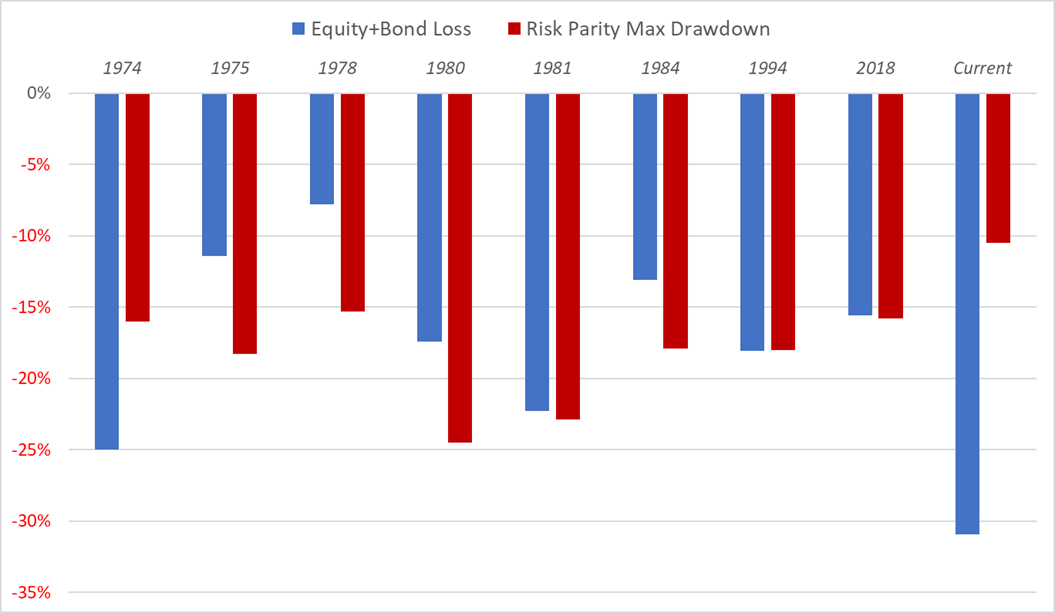
Before this year, stocks and bonds had an average combined 16% loss during these events, and the Risk Parity "Max" strategy had an average drawdown of 19%. In 2022, stocks and bonds have already exceeded the combined loss of all prior events, but the Risk Parity drawdown is the minimum observed.
It is expected that one or many assets will rally sharply following any of these periods, even though it is difficult to predict which one. Bonds will usually rally in a recession, gold will rally if inflation persists, and equities will rally in a soft landing. The following graph shows the subsequent 3 month return across various assets after all the prior events (current datapoint excluded).
Subsequent 3 Month Asset Returns After Prior Events
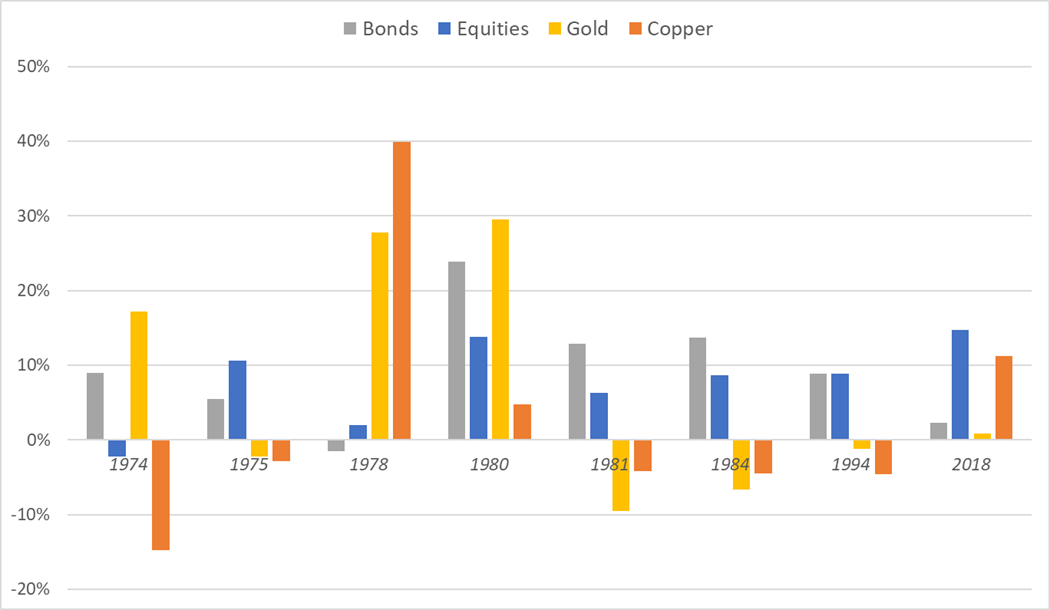
There has been a major rally in one or more asset classes within 3 months of every event, though it is often different depending on the outcome. In 1974, bonds and gold rallied during an ensuing recession. Commodities did well in 1978 when inflation failed to come under control. Bonds and equities rallied together in the soft landing of 1994. From a Hedgewise perspective, this is all fine! You can see this in how the Risk Parity Max strategy fared alongside these recoveries.
Subsequent Risk Parity Max Returns After Prior Events, Various Timeframes
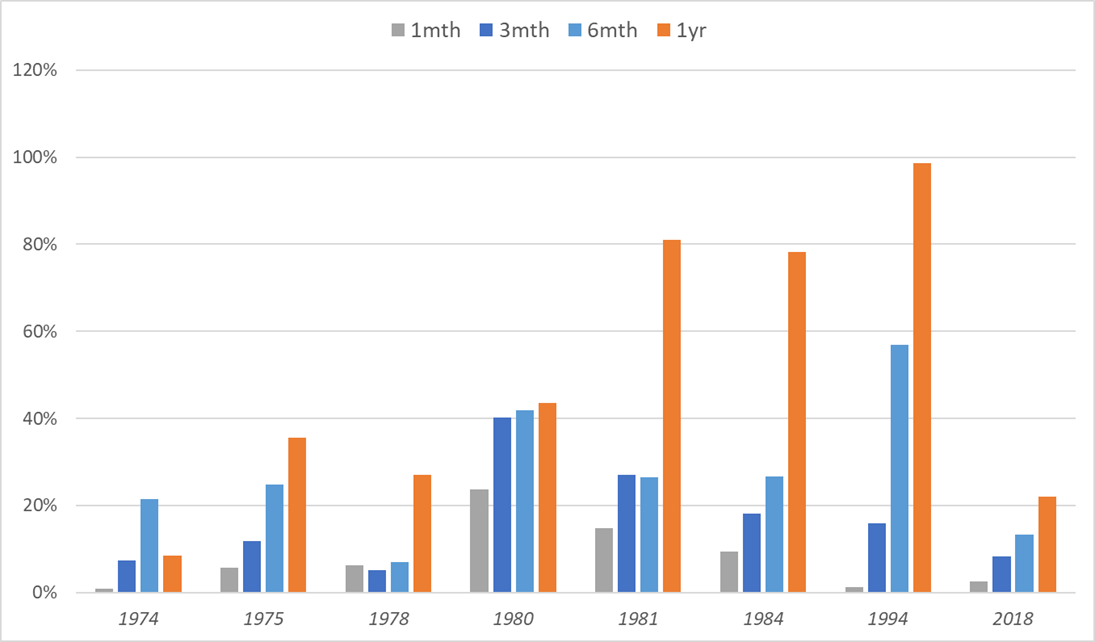
Whatever the outcome, Hedgewise recovered strongly and quickly, and I expect that to eventually be the case this time as well. The only tricky question is whether we have reached the bottom yet in 2022. We are already well outside historical precedent. 1974 and 1981 were much worse years for the real economy, in many ways, yet we have already surpassed those in terms of cross-asset drawdowns. You could argue that the pandemic bubble helps explain this, but there was a similar level of financial repression in the late 60s and early 70s as well. My guess is that the confluence of the war, the China Covid situation, and inflation have contributed to an unprecedented level of uncertainty, and I doubt that can get much higher than it already is.
Fortunately, Hedgewise can fall back on a few silver linings no matter what happens next. Any additional losses, especially within bonds, will only add to the size of the expected recovery. The current drawdown is much smaller than it could have been, and this will further buffer future upside whenever it comes.
Conclusion: 2022 Is The New 1981
The focus of this article has been to provide perspective on performance as it relates to Hedgewise, but from a human angle, this has been an incredibly tough month. It has been 40 years since America has grappled with this kind of inflation, and it is mind boggling that it could even exist in this way again. That would be earth-shattering enough on its own, but we have a new war on top of it, and somehow China is still implementing lockdowns worse than Wuhan in 2020. This will go down as an incredibly rare, incredibly hard moment in history, and it really has no modern parallel for the financial chaos it has already caused.
We have all been affected by this and losing money alongside it only adds to that stress. It is natural to see markets melting down and second-guess whether you could have handled it differently. It can also feel like some of these threats are existential. Will China ever move on from Covid? Will the war in Ukraine go nuclear? Will the Fed have to raise rates to 5, or 7, or 10% before its done? These are reasonable questions and understandable fears, and they are part of the reason that markets have been so chaotic. The things we feel as individuals are affecting financial decision-makers all over the world in the same way.
There is great irony in that the closer the world feels to falling apart, the more likely it is that many asset classes are on sale. Some of these scenarios may unfold, but not all of them. Inflation will continue raging, or it will stop. A recession will come, or a soft landing. Hedgewise should do quite well as soon as the future is better known. In the meantime, there are a few silver linings if you know where to look.
Disclosure
This information does not constitute investment advice or an offer to invest or to provide management services and is subject to correction, completion and amendment without notice. Hedgewise makes no warranties and is not responsible for your use of this information or for any errors or inaccuracies resulting from your use. Hedgewise may recommend some of the investments mentioned in this article for use in its clients' portfolios. Past performance is no indicator or guarantee of future results. Investing involves risk, including the risk of loss. All performance data shown prior to the inception of each Hedgewise framework (Risk Parity in October 2014, Momentum in November 2016) is based on a hypothetical model and there is no guarantee that such performance could have been achieved in a live portfolio, which would have been affected by material factors including market liquidity, bid-ask spreads, intraday price fluctuations, instrument availability, and interest rates. Model performance data is based on publicly available index or asset price information and all dividend or coupon payments are included and assumed to be reinvested monthly. Hedgewise products have substantially different levels of volatility and exposure to separate risk factors, such as commodity prices and the use of leverage via derivatives, compared to traditional benchmarks like the S&P 500. Any comparisons to benchmarks are provided as a generic baseline for a long-term investment portfolio and do not suggest that Hedgewise products will exhibit similar characteristics. When live client data is shown, it includes all fees, commissions, and other expenses incurred during management. Only performance figures from the earliest live client accounts available or from a composite average of all client accounts are used. Other accounts managed by Hedgewise will have performed slightly differently than the numbers shown for a variety of reasons, though all accounts are managed according to the same underlying strategy model. Hedgewise relies on sophisticated algorithms which present technological risk, including data availability, system uptime and speed, coding errors, and reliance on third party vendors.