


Summary
- Since February, the bond market has been in a major correction, with 30yr bonds now down over 10%
- However, bonds rarely experience losses over the long run, and remain a fundamental piece of any properly diversified portfolio
- The Hedgewise strategy remains near breakeven for the year despite this bond correction, and will continue to be resilient regardless of the environment
- Still, this kind of volatility is a good opportunity to re-evaluate your risk tolerance and seek perspective on what to expect moving forward
Introduction: Understanding Risk Parity During Market Corrections
The past couple of months have seen losses in the Hedgewise portfolio due to the significant bond market correction. Given the goal of our strategy is to balance risk evenly across assets, does this mean something is going wrong?
Though short-term losses are difficult to handle, the strategy is still functioning exactly as it should. To help understand why, consider a different example: imagine in the past three months, the stock market was down over 12%, but your portfolio was far closer to breakeven. In that case, it might seem more obvious that limiting losses during corrections is a victory of its own.
Within any investment strategy, it is impossible to avoid losses when many assets lose value at once, or when a single asset experiences a correction while other assets remain flat. The best that you can do is to reduce your exposure to the worst-performing assets while keeping perspective that crashes tend to be short-lived.
In this case, the Hedgewise system has been reducing bond exposure for months as those markets have been getting riskier. This has helped to limit client losses compared to a purely passive approach. However, it would be extremely dangerous to remove bonds from the portfolio altogether, given it is now far more likely that a different asset class will crash next.
The good news is that over any ten year period all assets tend to appreciate. The risk parity approach simply moderates your losses during volatile stretches. It cannot, however, ensure that every month yields a positive return. If you feel uncomfortable with this most recent stretch, it may be a signal that you are taking too much risk - which you can always adjust by selecting a lower Target Return.
With that in mind, let's take a deeper look at what has been happening in the markets lately.
Understanding Recent Hedgewise Performance
Hedgewise YTD Performance - All Targets
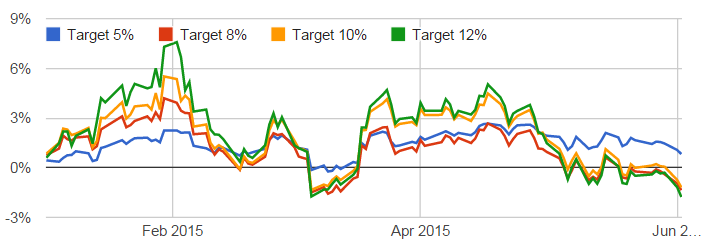
Year-to-date, all Hedgewise portfolios are hovering near breakeven. The lowest risk portfolio has proven quite resilient because of its automatic allocation to less risky assets. This is fairly impressive given that bonds are off more than 12% from their peak, while stocks and commodities remain relatively flat. Moving forward, it is quite unlikely that these other asset classes remain as calm as they've been.
Performance of 30yr Bonds Since Peaking in February 2015
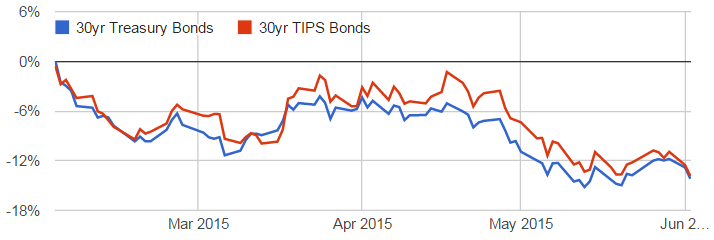
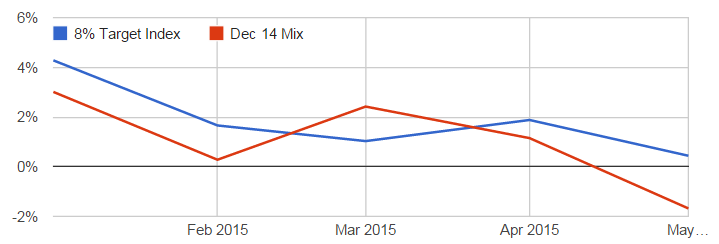
While Hedgewise does not predict the direction of returns, we do continuously monitor the underlying risk of each asset class. Expected bond volatility has been increasing since January, resulting in a lower bond allocation in each of our Targets. To help see the net impact of this adjustment, we've compared the hypothetical performance of a portfolio using fixed asset allocations since December 2014 to our live, risk-adjusted portfolio since then. In other words, what difference has it made to actively adjust for risk?
Performance of Hedgewise 8% Target Index vs. December 2014 Asset Mix
Don't Panic About Bonds
During corrections, there is often an impulse to abandon that asset for fear of continued losses. To help combat that impulse, here are a few fun facts about bond market performance over the long run.
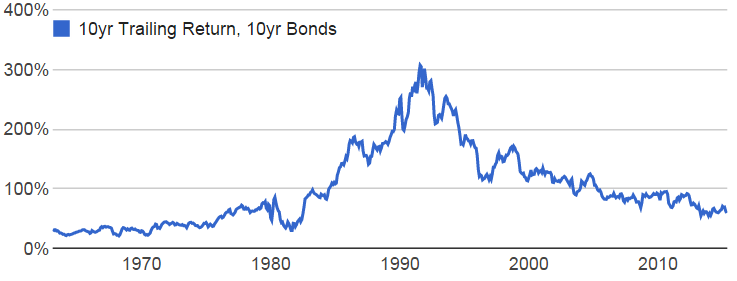
First, consider this: bonds have never, ever lost money over any ten year timeframe. This includes the last period of rising interest rates from the 1950s through the 1980s.
10yr Trailing Returns of 10yr Bonds, Presented Monthly, 1963 to 2015
If you think this doesn't apply to longer duration bonds, especially in rising interest rate environments, guess again.
10yr Trailing Returns of 20yr Bonds, Presented Monthly, 1963 to 1983
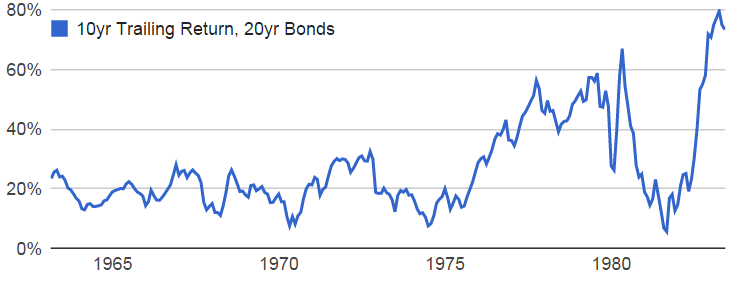
Now, these ten year returns are not particularly high, which is to be expected when interest rates are skyrocketing. This is just fine though, since other assets, like commodities, were booming during this timeframe. Bonds still reduced the overall risk of a balanced portfolio, and eventually began booming themselves once interest rates peaked.
Still, it can be hard to think about the next ten years when you are losing money today. Fortunately, there's also an extremely high likelihood that bonds will turnaround in fairly short order. We took a look at every period where 20yr bonds lost 5% or more over 3 months since the 1990s. Then, we plotted that against the following one year return of those same bonds. For some perspective, bonds are now down over 10% since February.
3mth Trailing 20yr Bond Return (X-Axis) vs. 1yr Following 20yr Bond Return (Y-Axis)
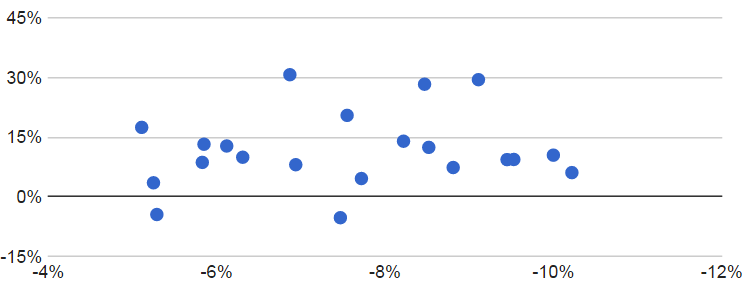
Out of 21 data points, bonds only continued to lose money over the following year twice. On average, the return in the following year was 11%. Quite recently, bonds were off about 10% after the 'Taper Tantrum' during the summer of 2013. In the following 12 months, bonds rallied over 10% and were one of the best performing asset classes.
Of course, this is no guarantee, and things may very well get worse before they get better. Regardless, it almost always pays to stay the course. If you still feel uncomfortable with the recent losses in your portfolio, this is an excellent indicator of your own personal risk tolerance. While it is often overlooked, emotions are a huge factor in your investment strategy. When a severe loss might cause you to abandon your long term plan, it is important to take steps to avoid that possibility.
Luckily, with Hedgewise you have just that option. Simply let us know that you'd like to reduce your risk by moving into a lower Target, and it will be done almost instantly. After all, your own peace of mind is often the most important part of the investing equation.
Disclosure
This information does not constitute investment advice or an offer to invest or to provide management services and is subject to correction, completion and amendment without notice. Hedgewise makes no warranties and is not responsible for your use of this information or for any errors or inaccuracies resulting from your use. Hedgewise may recommend some of the investments mentioned in this article for use in its clients' portfolios. Past performance is no indicator or guarantee of future results. Investing involves risk, including the risk of loss. All performance data shown prior to the inception of each Hedgewise framework (Risk Parity in October 2014, Momentum in November 2016) is based on a hypothetical model and there is no guarantee that such performance could have been achieved in a live portfolio, which would have been affected by material factors including market liquidity, bid-ask spreads, intraday price fluctuations, instrument availability, and interest rates. Model performance data is based on publicly available index or asset price information and all dividend or coupon payments are included and assumed to be reinvested monthly. Hedgewise products have substantially different levels of volatility and exposure to separate risk factors, such as commodity prices and the use of leverage via derivatives, compared to traditional benchmarks like the S&P 500. Any comparisons to benchmarks are provided as a generic baseline for a long-term investment portfolio and do not suggest that Hedgewise products will exhibit similar characteristics. When live client data is shown, it includes all fees, commissions, and other expenses incurred during management. Only performance figures from the earliest live client accounts available or from a composite average of all client accounts are used. Other accounts managed by Hedgewise will have performed slightly differently than the numbers shown for a variety of reasons, though all accounts are managed according to the same underlying strategy model. Hedgewise relies on sophisticated algorithms which present technological risk, including data availability, system uptime and speed, coding errors, and reliance on third party vendors.