


Summary
- A significant spike in interest rates has caused steep losses across all asset classes thus far in October, but a mix of higher rates and lower stock valuations bodes extremely well for future returns.
- Periods of Fed tightening are typically quite choppy, but have been consistently followed by rallies in one or more asset classes for structural reasons.
- Hedgewise continues to minimize losses this year via risk management, which has driven outperformance compared to benchmarks.
- This loss reduction will eventually add to a significant boost in long-run returns, but patience is required while the market sorts itself out.
Current Outlook: Little Reason to Worry
Current economic conditions - a bear market in bonds and commodities, largely driven by Fed tightening - have historically preceded excellent returns in both Hedgewise strategies. Unfortunately, these periods also usually include significant volatility, like what we saw in January and are now experiencing again in October. But it is extremely unlikely that these losses will persist over the next six to twelve months.
To understand why, let's first take a look at year-to-date returns in each asset class.
Asset Class YTD Returns, 2018
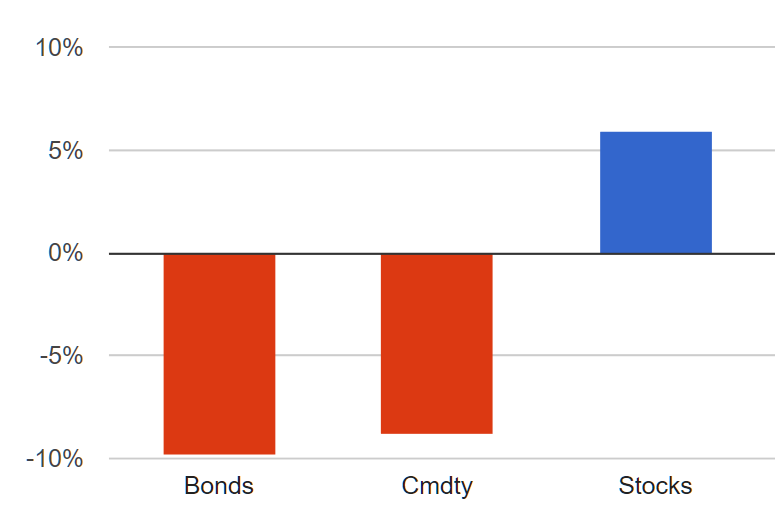
It's fairly rare to see this kind of dual bear market in bonds and commodities, since higher interest rates usually happen alongside a strong, growing economy which buoys the prices of raw materials. Yet this data suggests that the Fed is essentially pre-empting inflation: it wants to cool off growth before it gets out of control, and so far as inflation is concerned, it appears to be doing a great job.
There have only been three other periods since 1954 with similar economic conditions: 1980, 1981, and 1984. In each, the Fed was also corralling inflation, and asset class returns were eerily similar to today:
1yr Trailing Returns by Asset Class
| Date | Bonds | Copper | Stocks |
|---|---|---|---|
| March 1980 | -18% | -6% | 6% |
| August 1981 | -15% | -13% | 5% |
| April 1984 | -9% | -16% | 4% |
Once the Fed has raised rates enough to produce these outcomes, there are only two logical possibilities for the future: a) the economy is strong enough to sustain it, and stocks do well, or b) the economy is not strong enough, so rates go back down and bonds do well. Here's how the following one-year returns looked for each asset class in the above periods:
1yr Forward Returns by Asset Class
| Date | Bonds | Copper | Stocks |
|---|---|---|---|
| March 1980 | 9% | 1% | 40% |
| August 1981 | 35% | -18% | 1% |
| April 1984 | 27% | -6% | 15% |
This is quite consistent with the theory. Stocks did well in 1980, bonds did well in 1981, and both managed to do well in 1984 (this is known as a a Fed "soft landing"). Perhaps most importantly, though, both Hedgewise products also went on to do fantastically in every period.
1yr Forward Returns, Risk Parity Max and Momentum Max
| Date | Risk Parity | Momentum |
|---|---|---|
| March 1980 | 44% | 45% |
| August 1981 | 50% | 57% |
| April 1984 | 35% | 37% |
While these numbers are comforting on face value, it's important to emphasize that these periods each came with a ton of volatility, as investors were just as nervous about interest rates and the economy then as they are now. For example, here's how markets looked from April 1979 to March 1980.
Asset Class Performance, April 1979 to March 1980
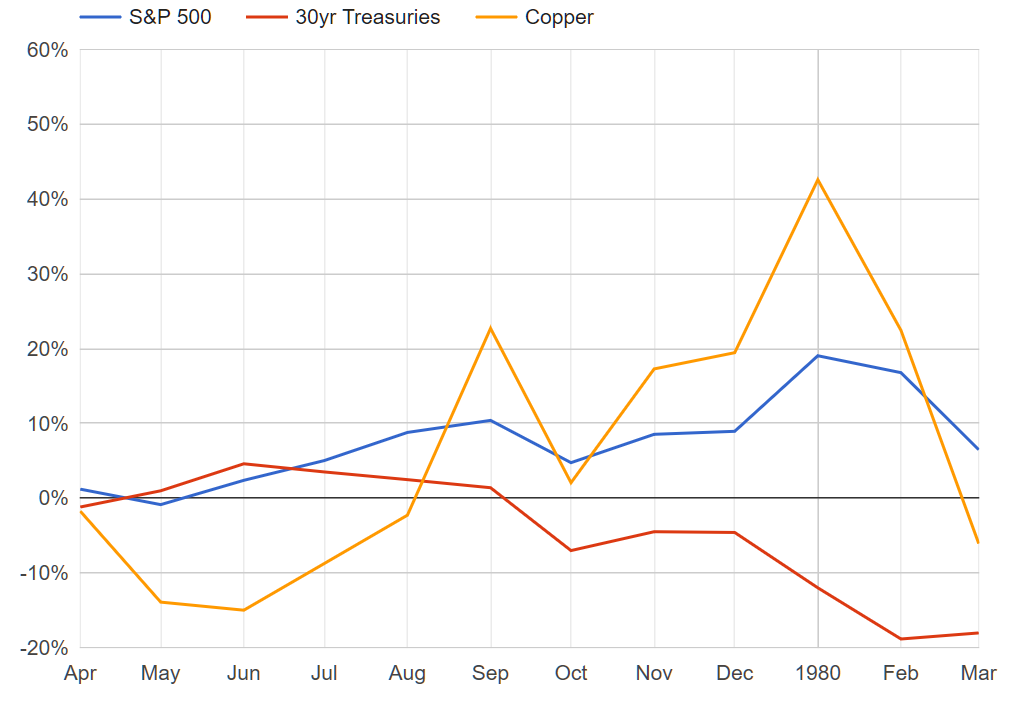
Note that in October 1979, stocks lost 5%, bonds lost 8%, and copper lost 17% in a single month! Stocks recovered from there, but then went on to fall 10% again in February and March of 1980, while bonds wound up down 18% altogether. Copper dropped 30% in about 2 months. Does it start to feel a bit familiar?
Notably, there was also a huge amount of daily volatility over this stretch. Stocks were down 1% or more on 14 days, including a single day loss of 3%.
Clearly, such years will be stressful, and large single day movements have a high emotional toll. It's hard not to wonder whether it makes more sense to simply sit on the sidelines for a while. But there's a very strong structural case for staying patient, especially as it relates to Fed tightening.
The Structural Case: Interest Rates and Returns
It's very important to differentiate the impact of interest rate movements on asset returns from systemic events (like the mortgage crisis) or economic slowdowns. This is because with the latter categories, volatile markets can sometimes be indicative of more problems lurking beneath the surface. For example, in the mortgage crisis, certain kinds of loans started to default before others, but markets were not yet pricing in the full impact of the issue.
On the other hand, interest rates alone are extremely transparent and the Fed works quite hard to avoid surprising the market much. Interest rates are also not an economic problem in isolation; they only become a problem if companies stop growing sufficiently or generating enough cash flow, etc. As such, if you assume that everything in the economy will stay the same, except for a move up in interest rates, you can calculate quite precisely how much it should impact markets. For example, with the way rates have moved so far in October, you'd expect bonds to be worth about 4% less and stocks to be worth around 3-6% less, simply based on a present value formula and discounted cash flows. As of October 10th, bonds are down 4.04% month-to-date and stocks are down 3.63%.
While those immediate losses are painful, potential gains have been quite literally 'moved' into the future. The expected return on all assets has gone up definitionally, since interest rates are a component of expected return. Little wonder that this is usually a terrible time to sell!
To test this, I've isolated every single rolling twelve-month period when interest rates went up by a similar amount to this year, regardless of what happened in other assets. The following shows the subsequent one-year returns in the Risk Parity Max and Momentum Max products.
1yr Forward Returns in Risk Parity and Momentum, Periods of Rising Interest Rates
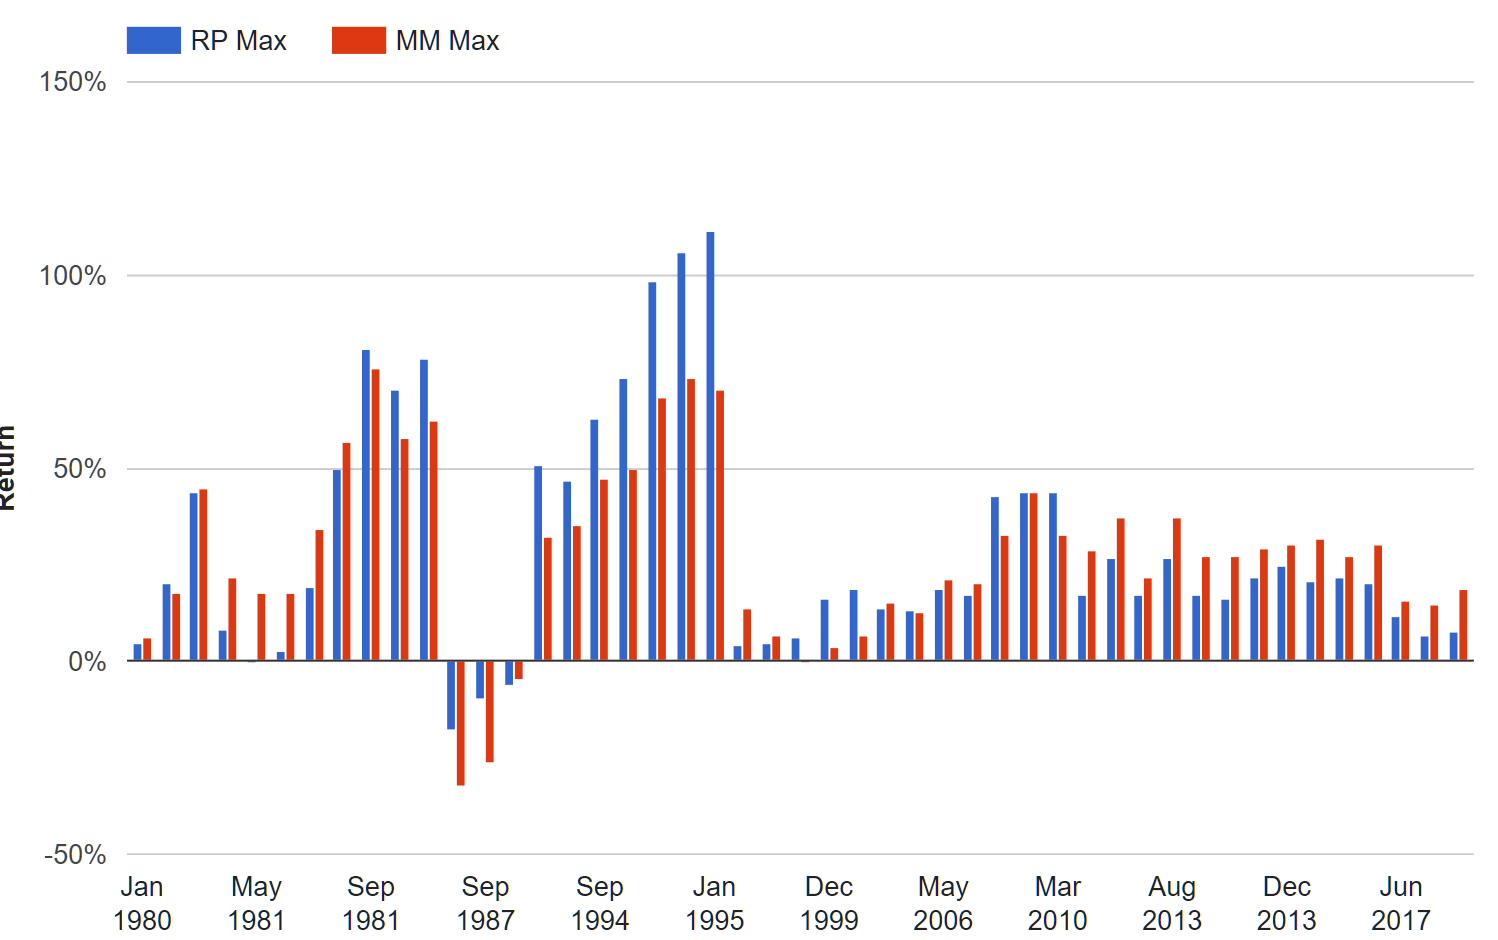
There were exactly three months when Risk Parity and Momentum went on to do poorly over the next year, and all of them were prior to Black Monday in 1987. Even if you include that, it still leaves a 94% chance of positive returns. It is also relatively difficult to parallel our current environment to the one in 1987. Most notably, stocks were up about 40% from January through August that year, with almost no downside volatility.
Outside of 1987, annual returns averaged over 20% for both strategies, and it didn't matter much which asset wound up rallying. Either interest rates came down, stocks rallied, or some combination of the two.
Is There A Better Way to Hedge?
While the forward-looking numbers may provide some comfort, it's still fair to ask whether these losses could have been avoided in the first place. If rates are going up, should we just sit on the sidelines to avoid the possibility of market corrections?
The problem with this logic is that you'd need perfect foresight as to when long-term interest rates are about to go up by 1% or more, and even if you had that, you'd still only be right about a pullback about 30% of the time. To illustrate, here's the same graph as above, but with trailing one-year returns instead of forward one-year returns. This shows you what loss (or gain) you would have avoided if you exited each strategy one year before interest rates hit their peak.
1yr Trailing Returns in Risk Parity and Momentum, Periods of Rising Interest Rates
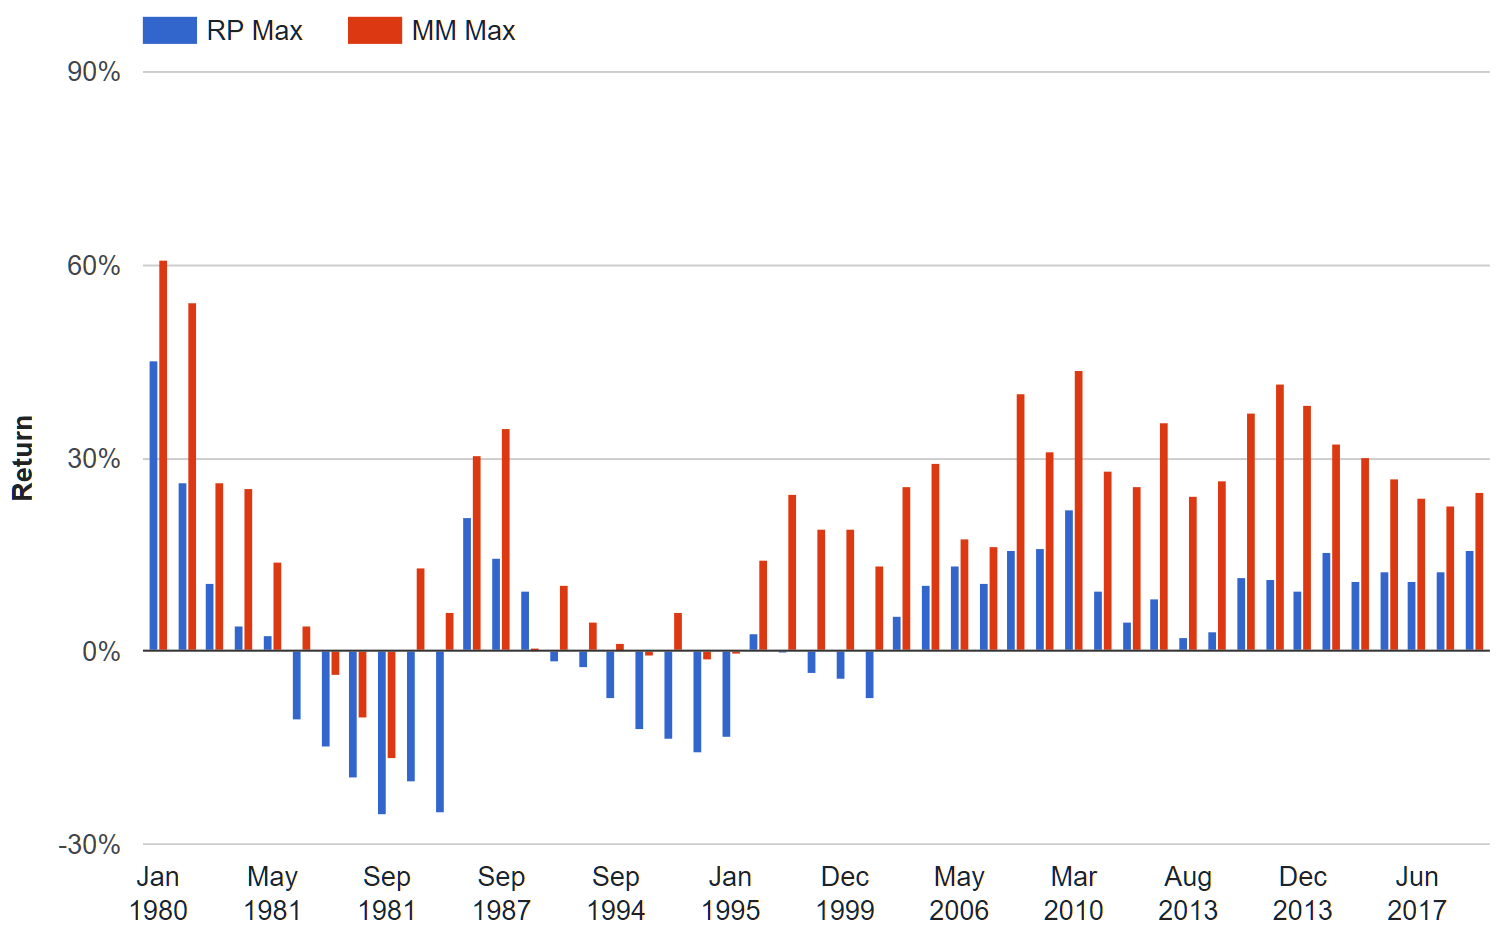
Sitting on the sidelines was still a losing bet about 60% of the time - and this was with perfect predictions of rate spikes!
As a result, Hedgewise generally accepts that you'll have a bad year every now and again, but it still seeks to minimize the damage via its risk management techniques. For example, Hedgewise risk indicators for the bond market spiked in January of this year as well as at the beginning of October, and bond exposure was drastically reduced as a result. The net impact of these techniques continues to drive outperformance for Hedgewise versus all major competitors.
Competitive Risk Parity Funds YTD Performance
| Product | YTD |
|---|---|
| Hedgewise RP High | -0.7% |
| AQR | -4.8% |
| Invesco | -4.1% |
| Wealthfront | -14.3% |
Traditional Diversified Mix YTD Performance
| Type (Ticker) | YTD |
|---|---|
| Conservative (AOK) | -2.9% |
| Moderate (AOM) | -3.4% |
| Aggressive (AOA) | -3.1% |
Wrapping Up: A Typical Volatile Year
While the Great Recession remains fresh on most of our minds, all signs indicate that the economy remains relatively normal. Unemployment is under 4%, interest rates are rising slowly, and markets have all been functioning as they should. While the extreme volatility thus far in October feels exceptional, it is quite similar to the volatility markets witnessed in other periods of Fed tightening. There's also a logical explanation for why markets get re-priced when rates go up, and why this makes future positive returns all the more likely.
Neither a year nor a week like this past one suggests that we are in uncharted territory, or that worse times are imminent. There's a reasonably good chance that markets will continue to be volatile for the next few months, just as they were for most of 1980 and 1984. But there's about a 95% chance that at least one asset class will break significantly higher within the next year. Fortunately, Hedgewise strategies are built so that you don't have to figure out which asset class it will be.
Disclosure
This information does not constitute investment advice or an offer to invest or to provide management services and is subject to correction, completion and amendment without notice. Hedgewise makes no warranties and is not responsible for your use of this information or for any errors or inaccuracies resulting from your use. Hedgewise may recommend some of the investments mentioned in this article for use in its clients' portfolios. Past performance is no indicator or guarantee of future results. Investing involves risk, including the risk of loss. All performance data shown prior to the inception of each Hedgewise framework (Risk Parity in October 2014, Momentum in November 2016) is based on a hypothetical model and there is no guarantee that such performance could have been achieved in a live portfolio, which would have been affected by material factors including market liquidity, bid-ask spreads, intraday price fluctuations, instrument availability, and interest rates. Model performance data is based on publicly available index or asset price information and all dividend or coupon payments are included and assumed to be reinvested monthly. Hedgewise products have substantially different levels of volatility and exposure to separate risk factors, such as commodity prices and the use of leverage via derivatives, compared to traditional benchmarks like the S&P 500. Any comparisons to benchmarks are provided as a generic baseline for a long-term investment portfolio and do not suggest that Hedgewise products will exhibit similar characteristics. When live client data is shown, it includes all fees, commissions, and other expenses incurred during management. Only performance figures from the earliest live client accounts available or from a composite average of all client accounts are used. Other accounts managed by Hedgewise will have performed slightly differently than the numbers shown for a variety of reasons, though all accounts are managed according to the same underlying strategy model. Hedgewise relies on sophisticated algorithms which present technological risk, including data availability, system uptime and speed, coding errors, and reliance on third party vendors.