


Hedgewise can intelligently manage your oil investments for you at a low fee and with zero commissions.
Summary
- Investors seeking oil exposure should not trust the most popular energy ETFs on the market
- These ETFs suffer from significant problems like the "roll cost" in the futures market and idiosyncrasies within the oil industry
- New research suggests a model for oil investing which avoids these problems and drives structural outperformance over the long run
- This model has already been implemented in live portfolios and has significantly outperformed the alternatives since inception
Introduction: A New Model For Oil Investing
We assume that your goal is a simple one: if oil prices go up over any given timeframe, long or short, you'd like to realize that profit. Yet, if you have done a bit of research, you have likely discovered that there is no ETF on the market that consistently accomplishes this goal.
Oil futures contracts, utilized by ETFs such as the United States Oil Fund LP (USO), the United States 12 Month Oil Fund LP (USL), the PowerShares DB Oil Fund (DBO), and the iPath S&P GSCI Crude Oil Fund (OIL), commit you to buying oil at a set price in the future. Unfortunately, that price is usually much higher than the price today, creating a significant cost drag on your portfolio.
Broad energy-related ETFs, such as the Energy Select Sector SPDR Fund (XLE), the Vanguard Energy Fund (VDE), the iShares Oil & Gas Explore & Production Fund (IEO), and the SPDR S&P Oil & Gas Explore & Production Fund (XOP), have failed to keep up with many of the most substantial oil rallies of the last decade, including the most recent one in February 2016. This is because the underlying stocks that compose these funds are frequently uncorrelated to changes in the price of oil.
However, our research has shown that it is quite possible to avoid these problems, and to create a dynamic portfolio that is far more effective than the most popular alternatives. In fact, by taking advantage of certain relationships within the marketplace, this model has systematically outperformed oil price changes over time while maintaining a tight directional relationship.
The model is based on three key assumptions:
- Financially stable companies which are very directly exposed to the price of oil will perform more predictably than a broad index
- Oil futures contracts are the best investment choice when the market is in "backwardation"
- Oil derivatives, such as gasoline, are occasionally underpriced relative to oil, enabling systematic outperformance during specific periods
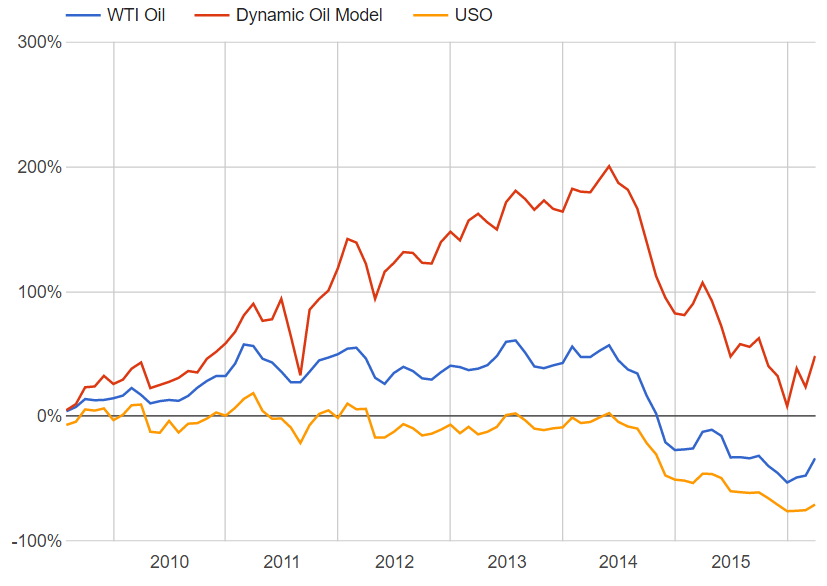
A back-tested simulation that applies this logic can be seen in the graph below, under the label "Dynamic Oil Portfolio". It significantly outperforms an investment in USO, the most popular oil ETF. Over the course of this article, we have also simulated the impact of each individual assumption so you can see exactly how this was built. Note that data is only available since August 2009 and assumes all dividends are re-invested.
If you are suspicious of simulations, you can also check out a 100% live portfolio with real-time performance that has been available since February 22, 2016.
Performance of Dynamic Oil Portfolio and USO vs. WTI Oil Spot Price, August 2009 - May 2016
Read on to find out why this model works and how to easily apply these techniques to your own portfolio.
Assumption 1: Invest Directly in Oil Companies, Not ETFs
In this article, we explored the many limitations of the most popular energy ETFs in the marketplace. However, we do not believe these limitations are unavoidable; you just need a more sophisticated approach than implementing some simple, broad index. Our theory is that an intelligently-selected portfolio of ten equally-weighted stocks can overcome many of these problems.
The oil market is commonly separated into six sectors, but only two of them - the Independent sector and the Drilling & Exploration sector - have a very high natural exposure to the spot price of oil. However, many of the smaller, independent players often experience radical performance swings due to idiosyncratic factors like the prospects for a particular oil field. Conversely, many of the biggest players in the Drilling & Exploration sector are also the biggest energy companies on the planet (Conoco Philips, etc.). Companies of this size are usually vertically integrated across nearly every oil sector, thus dampening their exposure to spot prices.
Still, these sectors are obviously the best places to start, so we'll only be selecting stocks within them. The next step is to apply a few filters to specifically deal with each problem.
Since we only want stocks with a high correlation to the spot price of oil, that seems like an obvious first step. We ran a regression on the monthly performance of every stock in these two sectors compared to oil prices, and simply chose the ten stocks with the highest correlation each month. However, the performance of this new portfolio was not significantly different from the Independent sector as a whole, which is far too volatile.
Performance of Independent Sector and the Top 10 Stocks in the Independent & Drilling Sectors vs. WTI Oil Spot Price, August 2009 - May 2016
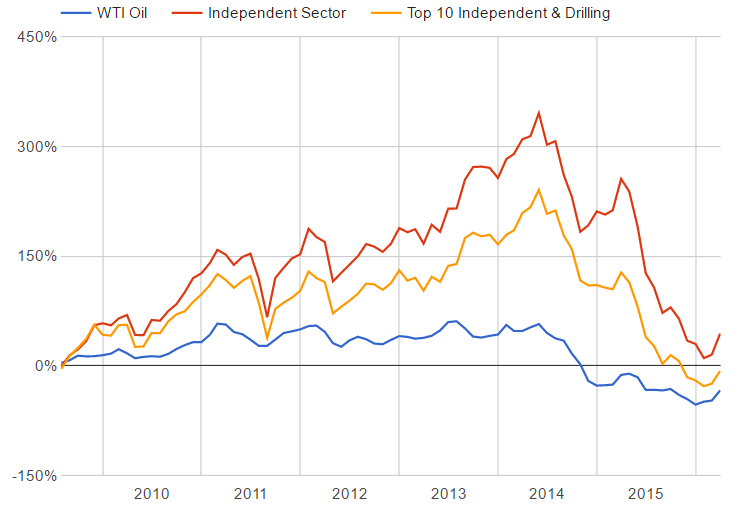
This likely traces back to some of the limits of regression analysis - you can find a high correlation between two things even if the amplitude of the movement is on an entirely different scale. Our portfolio wound up consisting of stocks that were highly responsive to oil prices, but which experienced huge swings up and down along the way.
Upon deeper analysis, the stocks that were causing the biggest problem tended to be small, highly levered companies. These firms were of the 'all-or-nothing' type, with one big oil field discovery doubling their stock price or one disappointment spiraling them into bankruptcy. We needed a way to eliminate these outliers, and decided to filter based on a couple of financial metrics to do so.
We focused on metrics which indicated a very low risk of bankruptcy. The companies needed to have enough cash on hand to cover their near-term liabilities (i.e., a high current ratio), and a relatively low amount of total debt on their books (i.e., low debt-to-equity). We also filtered out any companies in the 'micro-cap' space (valued under $300M). The idea was that larger companies with a solid balance sheet would have a much lower chance of experiencing massive performance swings.
After applying these filters, we again chose the top ten stocks each month according to the regression analysis. This time, the results were far more promising.
Performance of Independent Sector and the Top 10 "Filtered" Stocks vs. WTI Oil Spot Price, August 2009 - May 2016
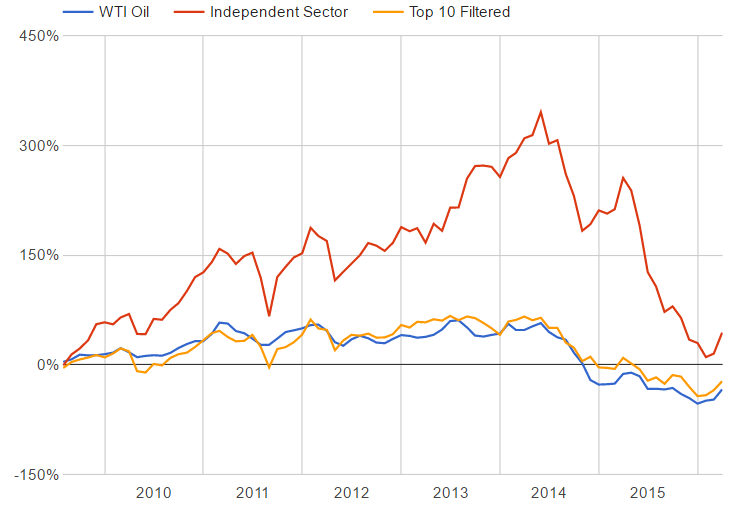
These results are an enormous step in the right direction. While the new portfolio still has small deviations from the spot price in either direction, it has a far tighter relationship than any ETF you can find on the market. These are the current top ten stocks for May 2016:
- Atwood Oceanics (ATW)
- Sanchez Energy (SN)
- Ensco (ESV)
- Gran Tierra Energy (GTE)
- Eclipse Resources (ECR)
- Kosmos Energy (KOS)
- Rowan Companies (RDC)
- Hess (HES)
- Transocean (RIG)
- Transocean Partners (RIGP)
On seeing this list, you may have individual reservations about certain stocks. Keep in mind that the list changes each month, so if one of these stocks starts to move independently of oil, or becomes less solvent, we would just switch it out. This method led to the performance graph shown above, and you can also see that this portfolio has performed quite effectively since inception in a live portfolio on February 22nd.
Performance of Top 10 "Filtered" Stocks vs. WTI Oil Spot Price, February 22, 2016 to May 13, 2016
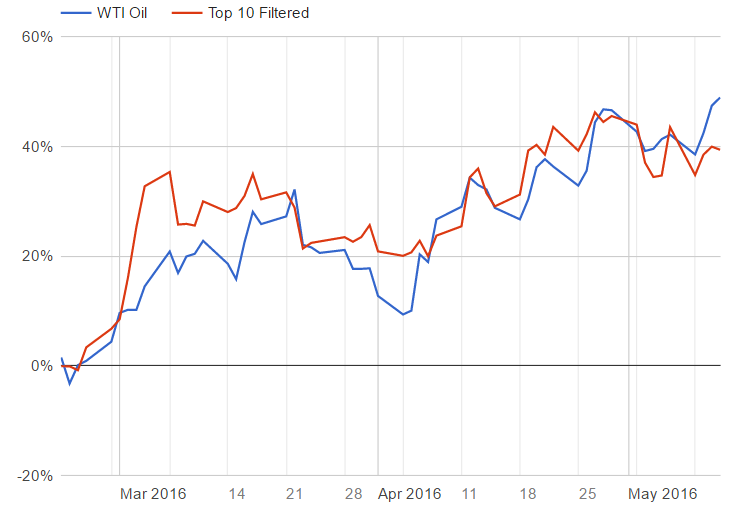
This day-to-day view is also illustrative of the natural deviation that will still occur, but remember that the purpose of this portfolio is to track oil over a medium to long timeframe. USO will show a tighter daily correlation, but will experience a terrible cost drag over a few weeks or longer.
While this is already a far improved solution to oil investing compared to the current alternatives, our research indicated that we could take this a couple of steps further, and not only track oil, but systematically outperform it. The key is a deeper understanding of the futures market.
Assumption 2: Take Advantage of Oil Futures "Backwardation"
Most of the time, oil futures contracts suffer from something called "contango", where the price in the future is higher than the price today. Occasionally, you will see the opposite occur, which is known as "backwardation". In these times, you can buy an oil futures contract for a cheaper price than it is selling today. Basically, you get a guaranteed discount.
While our ten stock portfolio is a great general alternative, it still can't beat a cheap contract that is directly tied to the price of oil. So instead of holding ten stocks all the time, we allowed our model to switch into futures in any months in which backwardation existed. This doesn't happen all that frequently, but when it does, it creates a meaningful difference in performance.
Performance of Top 10 "Filtered" Stocks and Top 10+Futures Contracts vs. WTI Oil Spot Price, August 2009 - May 2016
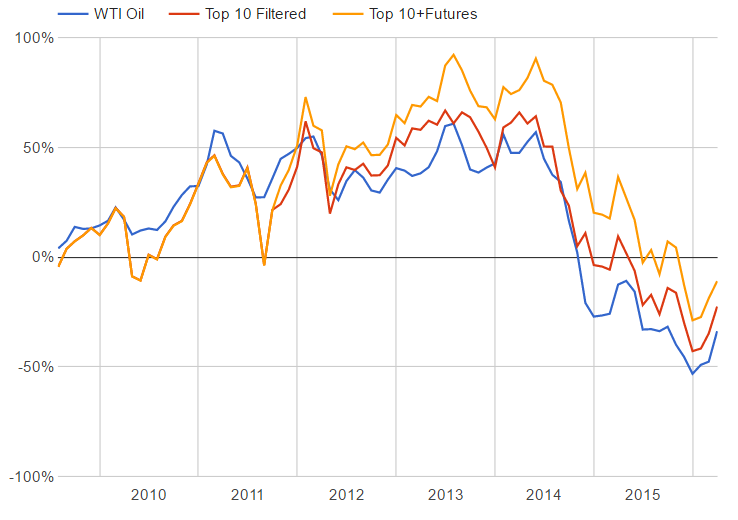
The red and yellow lines are literally the same portfolio, except in a few key months when the futures curve was in backwardation, such as mid-2011. Every time you take advantage of this, you systematically pick up a few percentage points, for a difference of about +14% over the entire time period. While you do have to monitor the futures curve carefully to implement this yourself, it appears to be a systematically winning bet.
Call us crazy, yet we still weren't satisfied. We couldn't help but wonder whether there were other opportunities to 'boost' performance in the oil universe, and our research led us to gasoline.
Assumption 3: Buy Gasoline When It Is Relatively Cheap
Along with the recent crash in oil prices, we've all noticed better prices at the pump. This is because crude oil makes up about 70% of the pump price of regular gasoline. It also turns out that you can invest in gasoline futures just like you can invest in oil futures, and that the two often move in lockstep. So why not consider this as another alternative?
After running lots of numbers, what we found is quite interesting. Most of the time, gasoline futures have all the same drawbacks as oil futures - if one market is in contango, it affects the other just the same. Occasionally, though, and for very short periods, the price of crude oil will spike and gasoline prices will be a little slow to catch up. If you happen to buy gasoline futures on one of these occasions, they don't just tend to keep up with oil - they often outperform it.
To test this, we added gasoline futures to our potential mix, but only utilized them in the short windows when the price was 'lagging' that of oil. The portfolio also needed to be shifted weekly, rather than monthly, since these windows tended to be so small.
Performance of Top 10+Futures and Top 10+Futures+Gasoline vs. WTI Oil Spot Price, August 2009 - May 2016
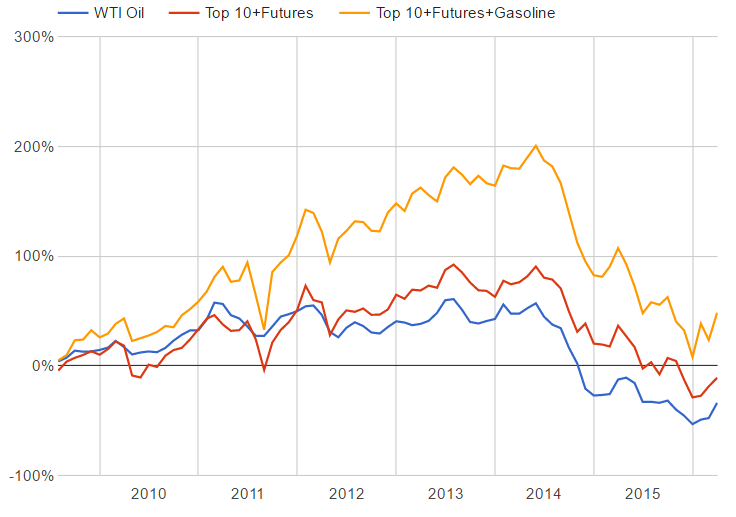
This small change had another big positive effect: it boosted performance by about 35% over this timeframe. Note that this all comes from a few key weeks when you are implementing this 'arbitrage', and there is no guarantee that it will happen again or achieve the same effect when it does. You also need a consolidated model for relating gasoline prices to oil prices, though we provide our version here. If history is any guide, though, this will be a sound strategy to continue implementing in the future.
Caveats
First, if you are considering implementing the part of this model involving futures contracts, it is vital that you understand the risks of that marketplace and that the tactics in this article provide no guarantee of performance. Especially in the short-term, futures pricing can be extremely volatile, such that even if these patterns do repeat, it may take a while for the story play out.
Second, the "Top 10 Filtered" portfolio will also have inevitable periods of significant variation from stock prices. For example, right after the Deepwater Horizon Spill in 2010, nearly every oil driller on the planet experienced a significant decline in stock price. However, this event did not have nearly the same impact on the actual spot price of oil. Such geopolitical and company-specific anomalies always have the potential to distort performance.
Despite these caveats, we still believe this approach is superior to most other available alternatives. There is simply no such thing as a 'perfect' oil investment.
Conclusion: No Rocket Science, Just Smarter Investing
The ideas presented in this article are meant to be logical and relatively easy to follow. We invest in individual oil companies instead of broad ETFs, but weed out small ones with a high risk of bankruptcy. We use oil futures contracts when you can buy them at a discount, but not otherwise. We do the same with gasoline futures contracts. This isn't based on individual company valuations, or advanced charting, or personal opinions, because those techniques depend too much on being 'right' or 'wrong'. This approach is simply about achieving the simple goal of investing in oil without having to worry about so many pitfalls.
To be clear, this article is not taking a stance on whether current oil prices are high or low. However, many investors believe that a price of $50 or $60 per barrel is relatively likely within a two-year timeframe, but have not had a very sensible way to capitalize on this bet. Others may be waiting for oil to drop in price again, but will still need an effective approach to invest if it does. Wherever you fall on the spectrum, we hope the techniques discussed in this article may prove useful.
Disclosure
This information does not constitute investment advice or an offer to invest or to provide management services and is subject to correction, completion and amendment without notice. Hedgewise makes no warranties and is not responsible for your use of this information or for any errors or inaccuracies resulting from your use. Hedgewise may recommend some of the investments mentioned in this article for use in its clients' portfolios. Past performance is no indicator or guarantee of future results. Investing involves risk, including the risk of loss. All performance data shown prior to the inception of each Hedgewise framework (Risk Parity in October 2014, Momentum in November 2016) is based on a hypothetical model and there is no guarantee that such performance could have been achieved in a live portfolio, which would have been affected by material factors including market liquidity, bid-ask spreads, intraday price fluctuations, instrument availability, and interest rates. Model performance data is based on publicly available index or asset price information and all dividend or coupon payments are included and assumed to be reinvested monthly. Hedgewise products have substantially different levels of volatility and exposure to separate risk factors, such as commodity prices and the use of leverage via derivatives, compared to traditional benchmarks like the S&P 500. Any comparisons to benchmarks are provided as a generic baseline for a long-term investment portfolio and do not suggest that Hedgewise products will exhibit similar characteristics. When live client data is shown, it includes all fees, commissions, and other expenses incurred during management. Only performance figures from the earliest live client accounts available or from a composite average of all client accounts are used. Other accounts managed by Hedgewise will have performed slightly differently than the numbers shown for a variety of reasons, though all accounts are managed according to the same underlying strategy model. Hedgewise relies on sophisticated algorithms which present technological risk, including data availability, system uptime and speed, coding errors, and reliance on third party vendors.