Summary
- 2018 was an extremely difficult year for investors, with losses unfolding across every major asset class. Typical hedges, such as bonds and gold, were ineffective, and an atmosphere of unpredictable volatility diminished returns for nearly all styles of risk management.
- Against this backdrop, Hedgewise frameworks lost between 2% - 14% YTD, which remains substantially better than most comparable funds and within expectations given these circumstances.
- Still, it is natural to wonder whether this environment is radically different than historical precedents, and if it threatens the efficacy of risk-managed frameworks.
- History suggests that this year's returns are relatively similar to other periods when the Fed was reaching the end of its tightening cycle. This tends to drive fear, uncertainty, and lower valuations across all asset classes, despite many inherent contradictions.
- Such fear-driven volatility cannot persist forever, simply because you cannot experience inflation and deflation, or recession and growth, simultaneously. So long as high uncertainty persists, large short-term price swings usually remain, but they have little bearing on your long-term outlook or the efficacy of risk management more broadly.
Introduction: A Crummy, No-Good, Typical Year
2018 was not a good year for investors, of any asset, in any style, living in any country. The last 12 months have often felt like a never-ending deluge of worry, including rising interest rates, peak profits, trade war, Brexit, et al. Yet traditional safe-havens like gold and bonds have suffered losses alongside stocks, and recoveries in any asset class have quickly and violently reversed. That said, as ugly as it's been, it's quite a bit more familiar than it might seem, and quite a bit less scary than you probably feel.
First, to dispel the most worrisome economic myth floating around in the media: asset performance trends this year are not radically different than the past, and remain very consistent with what you'd expect when the Fed is aggressively battling inflation and withdrawing mountains of liquidity via higher interest rates. Higher rates force all assets to be more heavily discounted, and everyone also wonders how high rates will need to go, and whether the Fed is driving us straight towards a recession, deflation, hyperinflation, or some mix. Just like that, all assets start pricing in more risk.
Of course, it feels like there's lots else going on, like terrifying tweets and tariff wars. But it's hard to put much weight on those factors when you saw just as much volatility and cross-asset decline in nearly every other year in history that the Fed was behaving similarly. A more likely explanation is that when investors are particularly on edge, they react more strongly to the news, whatever it might be. While this results in very real price swings, it also makes it far less likely that losses persist.
Ironically, this environment can drive moderately high losses in risk-managed frameworks precisely because many of the perceived risks are unsubstantiated. Hedging will be less effective because each individual asset class begins pricing in a worst-case scenario, despite the fact that all of those scenarios cannot simultaneously co-exist. Risk measurements will often fail to signal much chance of a major crash - which is usually quite correct! - but investors might succumb to panic for a while anyway. Financial theory suggests that the most effective path through such turbulence is to wait for the noise to pass, and while this usually seems quite obvious in retrospect, it will almost certainly test your nerves along the way.
Fortunately, this scenario has played out many times in the past, and has always resolved without any breakdown in fundamental economics or the theory of risk management. Though losses this year are certainly unpleasant, Hedgewise has actually navigated the environment fairly well from a historical perspective and relative to competitive funds. While it's natural to wonder how such a strange, crummy year could fit in the bigger picture, the reality is that it is much the same as all the other strange, crummy years we've had, and will soon pass much like the rest.
Review of Hedgewise 2018 Performance
2018 has certainly been unfamiliar in the context of the recent nine-year bull market. Among other fun headlines, there haven't been more radical daily and monthly swings since the depths of the financial crisis, the last time this many asset classes had simultaneous losses was 1901, and the last time investors felt this nervous was the Nixon era in 1972.
Here's a look at year-to-date returns for every major class:
2018 YTD Performance by Asset Class
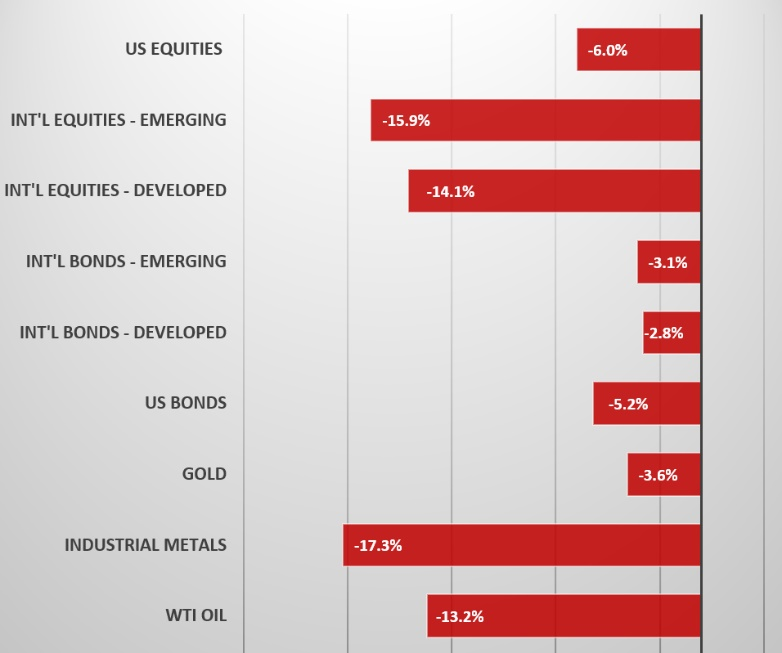
Given this picture, it comes as little surprise that most investment strategies have fared poorly; in years like this one, losses are essentially unavoidable. With that in mind, the primary question becomes how well Hedgewise frameworks have helped to mitigate the damage, and whether this calls into question the effectiveness of the underlying financial theories. Fortunately, there is ample evidence that Hedgewise techniques have continued to be effective.
From a 10,000 foot view, the most obvious explanation for this year's negative returns is that Hedgewise strategies are multi-asset, and frequently use leverage to balance risk and amplify potential returns; when most assets are down, this will result in losses. A simple, static example of implementing such a strategy at a moderate risk level might look like 100% bonds, 60% stocks, and 40% commodities. This year, that portfolio would have lost approximately 15%, depending on its exact weighting of commodities.
For comparison, Hedgewise strategies have incurred YTD losses between 2% - 14%, depending on your product mix and risk level. This is a very compelling outcome, especially in a year when many traditional risk management mechanisms were ineffective. To provide a less theoretical comparison, the Hedgewise Risk Parity strategy has also outperformed all comparable mutual funds throughout the year.
Hedgewise Performance Vs. Major Risk Parity Mutual Funds, 2018 YTD
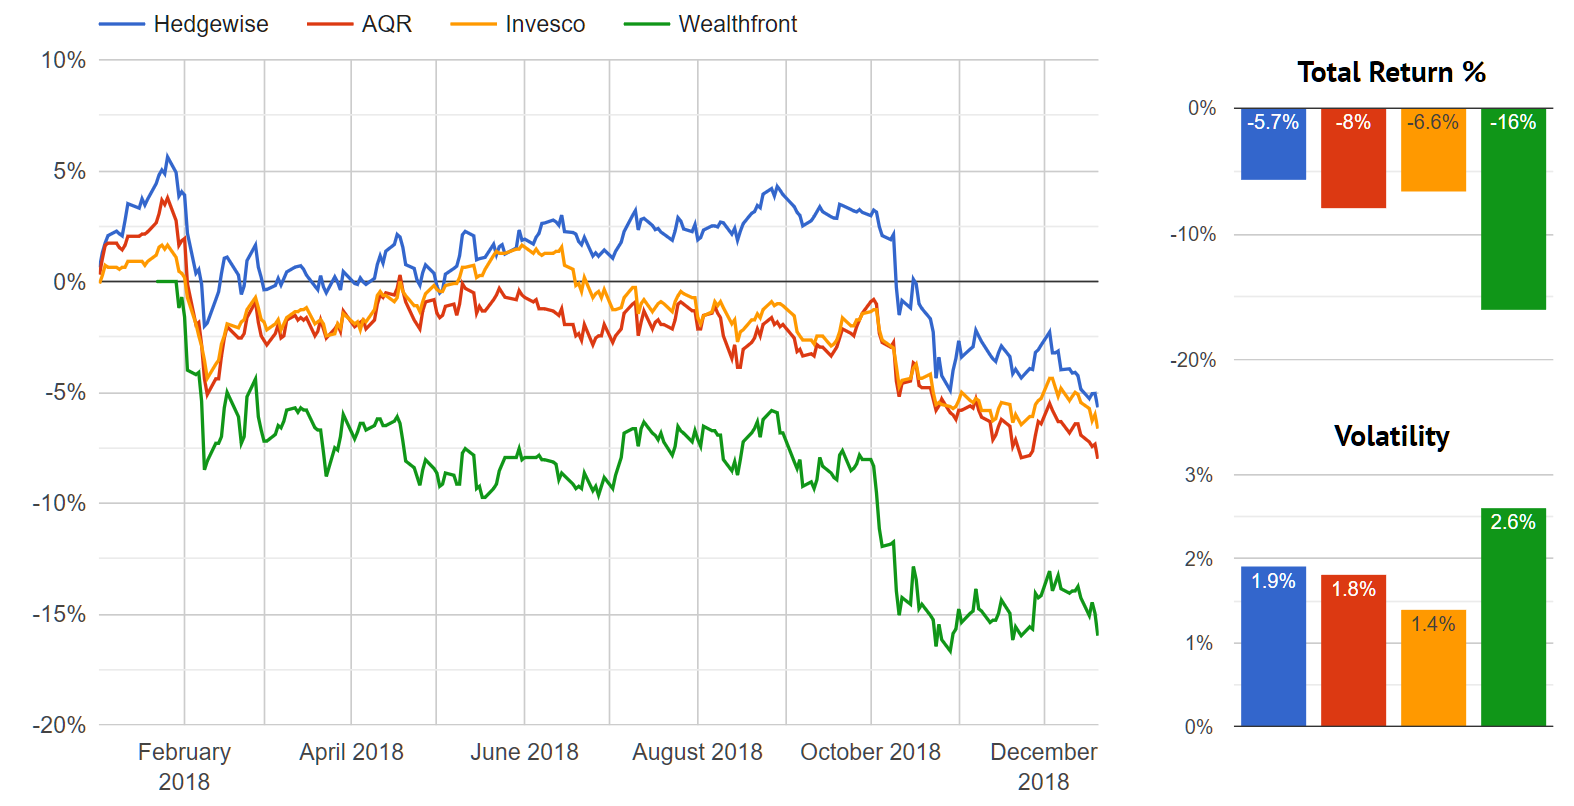
There are a couple of notable highlights from this graph. While it's clear that Hedgewise risk management techniques have largely outperformed the competition throughout the year, no fund was able to escape losses altogether. This adds weight to the idea that losses were inevitable in nearly any form of the strategy framework, but that Hedgewise handled this better than most. While there are some ebbs and flows to each fund's performance, due to myriad differences in the definition of risk and portfolio composition, it's a relatively minor give-and-take that adds up over time (except in the case of Wealthfront, whose performance has continued to raise concerns). Hedgewise will certainly have some months that look better and some that look worse, but the short-term deviations mean much less than the longer-term edge built into each portfolio.
Still, even if Hedgewise has done better relatively, is there something wrong with risk managed strategies more broadly? Why has hedging been ineffective, and how do you know that won't continue? Why can't some of these pullbacks be more nimbly avoided?
To answer these questions, it's helpful to re-examine how the core financial theory is supposed to work and relate that to a few similar historical examples.
The Fed and Peak Uncertainty
When the Fed is trying to figure out how high to raise interest rates - and especially when they are getting close to a level that may cause a recession if they go too high - markets often become quite perplexed. There is simultaneously inflationary pressure, and recessionary pressure, but neither a recession nor high inflation has actually happened. When there are so many different, scary possibilities at once, lots of assets can lose value in contradictory ways while this limbo continues.
From a risk management perspective, this tipping point creates a conundrum. Hedging doesn't work very well, but some assets are becoming inevitably undervalued since only one actual scenario can unfold. Market prices frequently lurch from one worst case projection to another, yet those fears aren't frequently based on any actual events or hard data. Does it make sense to continue operating normally in such an environment, knowing that losses typically result, or is it better to try and avoid it altogether?
There are two key theoretical insights that suggest simply taking the lumps and waiting it out. First, if many assets have begun trading beneath fair value, then it follows that there is a much higher chance of short-term gains than is typical. Second, the longer that losses persist, the more pressure will build to the upside, since value tends to accumulate over time. Together, these ideas imply a fairly rapid but difficult to predict turnaround which easily reverses any net losses. Importantly, note that this does not assume that all assets will recover - oftentimes one bad scenario will unfold - only that some assets are poised for a significant rebound during which risk-managed frameworks will be well-positioned to benefit.
To test this is relatively simple: the pattern you'd need to see is that when many asset classes lose value simultaneously against a backdrop of rising interest rates, you go on to have a relatively rapid and substantial rebound in some of those assets, along with a corresponding rebound in the risk-managed frameworks. Since this should hold true regardless of what event winds up unfolding, this analysis includes every event since 1954 where interest rates were rising while stocks and some commodities were falling. Notice that our current year is included for reference in the final row.
| Year | Length (Months) | Stocks | Bonds | Copper | Gold |
|---|---|---|---|---|---|
| 1957 | 17 | -5.9% | -5.2% | N/A | N/A |
| 1960 | 2 | -5% | -0.73% | -6.4% | N/A |
| 1962 | 3 | -18.8% | -0.7% | -6% | N/A |
| 1966 | 5 | -12.4% | -1.7% | -36.3% | N/A |
| 1970 | 8 | -13.9% | -4.5% | -5.7% | 0.9% |
| 1974 | 5 | -22.8% | -2.2% | -46.4% | -9% |
| 1975 | 3 | -11.7% | 0% | 2.2% | -13.8% |
| 1978 | 3 | -5.9% | -1.9% | 4.5% | -6.4% |
| 1980 | 6 | -3.5% | -6.3% | -23.5% | 22.8% |
| 1982 | 2 | -5.8% | -2.6% | 0.7% | -5.7% |
| 1984 | 11 | -5.5% | -3.2% | -14.8% | -5.4% |
| 1994 | 2 | -8.1% | -10.9% | -2% | 0.8% |
| 1997 | 2 | -3.2% | -3.1% | 8.7% | 1.7% |
| 2015 | 9 | -0.7% | -4.6% | -24.9% | -9.6% |
| 2018 | 12 | -6.0% | -5.2% | -17.4% | -3.6% |
Note that this covers a very broad spectrum of history. Sometimes the economy was battling hyperinflation (late 70's), other times it was already in recession (early 70's), and sometimes it was just nervous (2015). Sometimes the Fed was in the midst of raising rates too high, and other times it needed to go on to raise rates more. None of that matters much to our thesis.
Here's a look at how each asset class performed just three months after the end of each of the above periods. It would be natural for some asset classes to continue falling, but also to see significant rallies elsewhere. On net, the rallies should appear more common and larger in size than any additional losses.
Performance by Asset Class, Three Months Forward
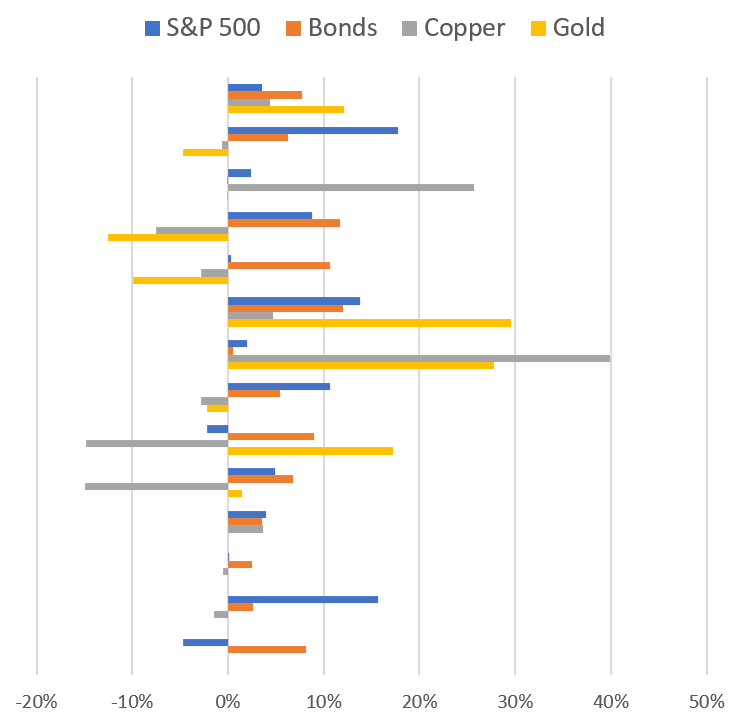
Every data point fits the theory, and it's also interesting to note that stocks and bonds both rallied 85% of the time, and losses were relatively light even when they did persist. This traces back to the downward bias of uncertainty; once prices are so cheap, even the asset classes that go on to perform the worst don't have all that much further to fall since such pessimism was already afoot.
Both Hedgewise risk-managed frameworks suffer in these circumstances, but that is by design since these events are quite infrequent, and because this 'rebound effect' provides such an effective antidote. First, let's take a look at how each strategy performed during these same periods. The first column shows the net performance for each strategy, and the second the worst peak to trough drawdown (if worse than the net loss), which gives a better sense of how the 'worst of it' felt.
| Year | RP Max | RP DD | MM Max | MM DD |
|---|---|---|---|---|
| 1957 | N/A | N/A | -13.3% | -16.2% |
| 1960 | N/A | N/A | -8.5% | -- |
| 1962 | N/A | N/A | -13.2% | -- |
| 1966 | N/A | N/A | -12% | -13.1% |
| 1970 | N/A | N/A | -13.9% | -- |
| 1974 | -16% | -- | -4.5% | -5.8% |
| 1975 | -18.3% | -- | -19.6% | -- |
| 1978 | -15.3% | -- | -12.2% | -- |
| 1980 | -12.9% | -24.5% | -0.3% | -19.7% |
| 1982 | -5.3% | -- | -2.8% | -- |
| 1984 | -22.9% | -- | 5.6% | -7.8% |
| 1994 | -10.8% | -- | -7.1% | |
| 1997 | -3.2% | -4.5% | -4.4% | -5.3% |
| 2015 | -5.9% | -8.1% | -1.9% | -10.8% |
| 2018 | -9.3% | -15.8% | -13.7% | -19.8% |
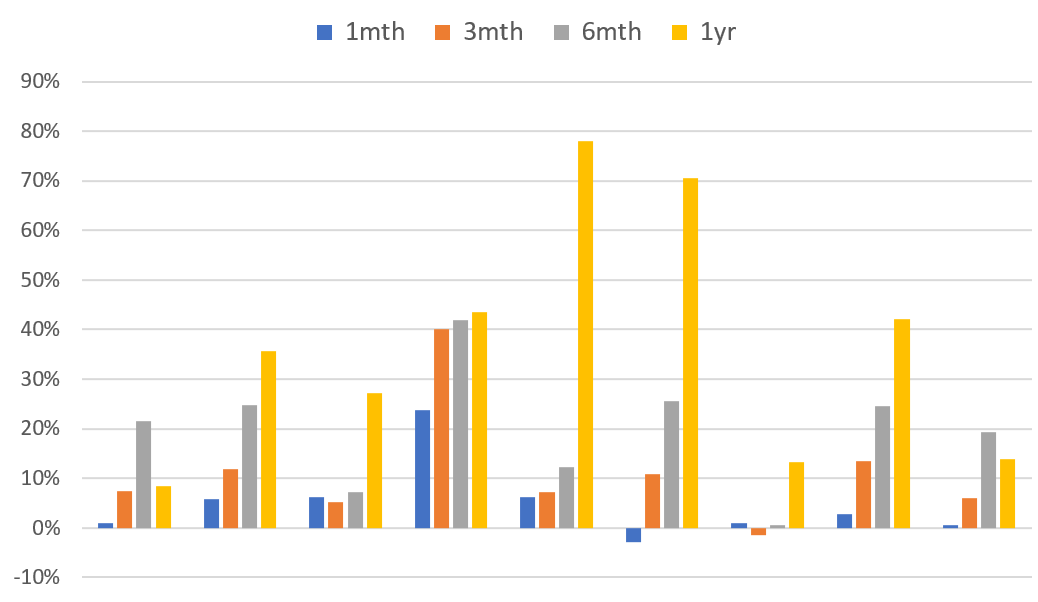
Next, let's examine how the strategies performed directly following these months; you'd frequently expect the rebound to be rather fast, but even if not, it should eventually result in large gains since value accrues as you wait. I've separated each strategy into forward looking one month, three month, six month, and one year gains to highlight the speed and size of each recovery.
Risk Parity Subsequent Returns (1972 Onward)
Momentum Subsequent Returns (All Data Points)
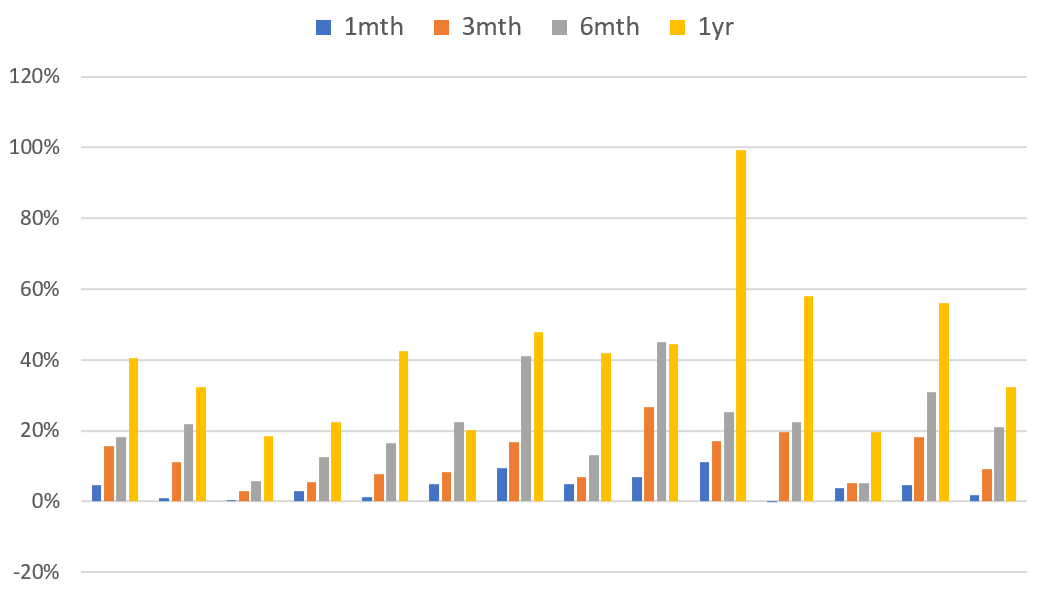
For both strategies, the average one month return is over 4%, the average three month return is over 10%, the average six month return is over 20%, and the average one year return is close to 40%. Now, the main caveat to these numbers is that they all measure forward starting after the end of the "peak uncertainty" stretch, and it is impossible to say whether this month will mark that point. However, consider that we are already 12 months into our current stretch, which is far longer than the average duration historically and has only been exceeded once, in 1956, when the pain endured for 17 months total. Eventually, the Fed either breaks the economy, or inflation rockets, or the tightening cycle ends uneventfully, and Hedgewise frameworks have handled every scenario with ease. Until then, you usually run into years just like this one, and while that may provide little comfort, it's important to understand that we are not in uncharted territory, nor has Hedgewise performance been any worse than you'd expect.
If these stretches are always so nasty, can't we just find a way to skip them? The data above provides much in the way of a retort. These periods are really infrequent; you see two to four per decade, and on average they last only a few months. Once they end, the same risk management mechanisms that appeared to be failing suddenly work wonderfully. In a way, this is precisely the environment where you choose to accept losses as the outcome: it's an environment with a rebound literally built-in.
Conclusion: Evaluating 2018
On the one hand, 2018 definitely counts as an exceptional year. It joins the handful of events each decade that stand out for their awfulness, and it absolutely feels unfamiliar because you have to go back to the 1970s and 80s to find a year quite this bad. Then again, those were the very decades when the Fed last had to seriously wield monetary policy to fight potential inflation; perhaps it should be of little surprise that is what we are facing again now. When the central bank is the main concern, it's relatively common to hit these stretches of 'peak uncertainty', when many assets fall together despite inherent contradictions, and markets lurch from one panic to another.
Amidst this, risk-managed strategies like Risk Parity and Momentum will have losses, but this doesn't mean that they are working poorly. In fact, Hedgewise has continued to consistently outperform large competitive products. Historically speaking, a similar magnitude and breadth of cross-asset losses has often resulted in losses of 20%, while current YTD losses remain well-below that. Similarly, even a purely passive hedged portfolio would likely be performing worse. These are all signs that the risk management techniques in place continue to work about as well as they should, despite the difficult reality that these circumstances entail a substantial drawdown.
Looking forward, though, this drawdown is entirely about context. It is being driven by a heightened anxiety that has driven down the price of nearly all risky assets, and given that only one economic reality can unfold, this means that one or many of these assets are mispriced. The same risk management mechanisms that have driven losses, like hedging and leverage, will also be positioned to take advantage of the subsequent rallies that have always resulted with time. This is very different than a loss in a single asset class or speculative instrument (like, say, Bitcoin), which explains why recoveries have been so convincing and consistent when they occur.
Certainly, this year feels crummy, but it's about as crummy as you'd expect it to be, and it's the kind of crummy where you usually have the losses that we have. It will probably continue to feel very crummy until it is finally clear which big mistake is being made, if any. Then, suddenly, it will start to look much better, and it doesn't really matter if we are in a recession or high inflation or neither. It only matters that we finally know, after which 2018 will be just another data point of a typical bad year.
Disclosure
This information does not constitute investment advice or an offer to invest or to provide management services and is subject to correction, completion and amendment without notice. Hedgewise makes no warranties and is not responsible for your use of this information or for any errors or inaccuracies resulting from your use. Hedgewise may recommend some of the investments mentioned in this article for use in its clients' portfolios. Past performance is no indicator or guarantee of future results. Investing involves risk, including the risk of loss. All performance data shown prior to the inception of each Hedgewise framework (Risk Parity in October 2014, Momentum in November 2016) is based on a hypothetical model and there is no guarantee that such performance could have been achieved in a live portfolio, which would have been affected by material factors including market liquidity, bid-ask spreads, intraday price fluctuations, instrument availability, and interest rates. Model performance data is based on publicly available index or asset price information and all dividend or coupon payments are included and assumed to be reinvested monthly. Hedgewise products have substantially different levels of volatility and exposure to separate risk factors, such as commodity prices and the use of leverage via derivatives, compared to traditional benchmarks like the S&P 500. Any comparisons to benchmarks are provided as a generic baseline for a long-term investment portfolio and do not suggest that Hedgewise products will exhibit similar characteristics. When live client data is shown, it includes all fees, commissions, and other expenses incurred during management. Only performance figures from the earliest live client accounts available or from a composite average of all client accounts are used. Other accounts managed by Hedgewise will have performed slightly differently than the numbers shown for a variety of reasons, though all accounts are managed according to the same underlying strategy model. Hedgewise relies on sophisticated algorithms which present technological risk, including data availability, system uptime and speed, coding errors, and reliance on third party vendors.


