


Summary
What Happened
Hedgewise has experienced a 0.5-4% YTD loss, depending on your risk level, due to a significant bond correction during which stocks and commodities have remained relatively flat.
Why Not to Worry
Such "unhedged" events are usually temporary and self-correcting, given that the fundamentals in the markets must eventually align. Hedgewise has already moderated your losses by significantly reducing bond exposure as risk increased, and our approach ensures that your portfolio is well-positioned regardless of what happens next.
Looking Forward
Avoid the temptation to move into cash or time the markets. Remember that all assets tend to appreciate over the long run, and that periods of loss are typically short-lived.
Introduction
Hedgewise is built on the premise that diversification across asset classes is the best way to invest. By evenly balancing your risk, you get a steadier return with more upside and less downside.
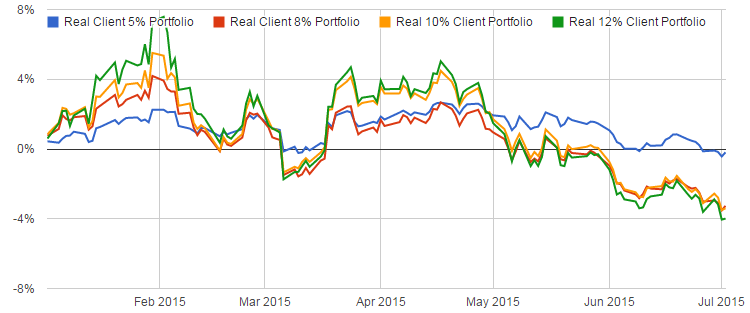
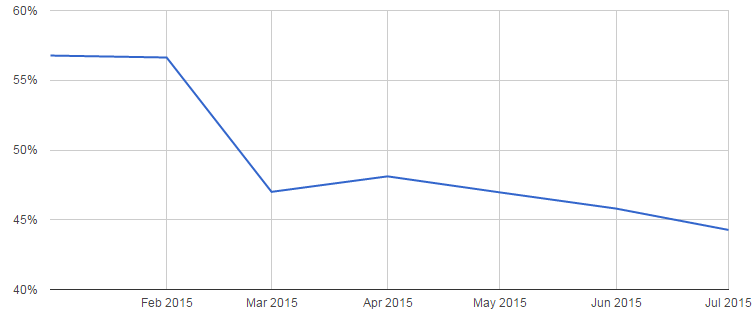
With that in mind, it can be challenging to understand why losses still occur. In the first half of this year, Hedgewise started strong, but then gave up all of those gains to wind up with a loss between 0.5% and 4%, depending on your risk level.
Hedgewise 2015 YTD Return, Real Client Portfolios
The natural question becomes whether this still makes sense in the context of a hedged portfolio. When does diversification fail, and is there a risk that it will continue to do so? Are there steps that Hedgewise should be taking to "fix" it?
The reality is that even a diversified portfolio can only perform as well as its underlying assets. If there is a significant asset crash, or many assets simultaneously lose money, it is inevitable that there will be a period of loss.
However, such environments tend to be short-lived because the underlying economics must eventually reconcile. When bonds fall, it means investors are building in expectations of faster growth, higher inflation, or both. In those situations, both stocks and commodities should be rallying - yet they haven't. One of these markets is likely undervalued, but it is very difficult to know which one.
Regardless of the outcome, our strategy automatically protects your portfolio in multiple ways. By dynamically monitoring risk, our system began reducing bond exposure as early as January. This has significantly reduced losses compared to an unmanaged approach, and leaves your portfolio well-positioned to take advantage of a recovery, regardless of where it occurs.
Still, losses are difficult to bear, and you may wonder if there are environments in which cash is a better option. History has shown that the underlying principles of diversification are extraordinarily powerful, and that a risk-balanced approach will tend to systematically outperform any attempts to time the tops and bottoms, so long as you remain steady throughout periods like this one.
You don't need to take our word for it, though - we've put together all the data you need to decide for yourself.
Understanding YTD Performance
First, let's take a look at the performance within each class since January, as well as the impact that had on our Target 8% portfolio.
Performance by Asset Class, January through July 1 , 2015
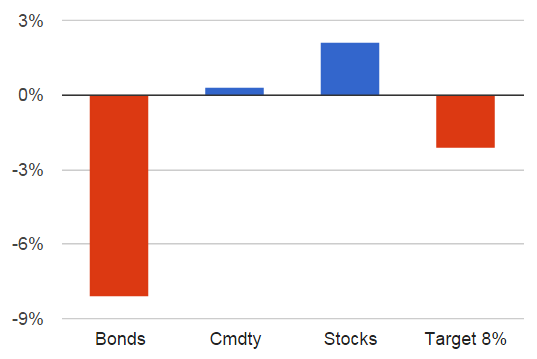
Note the great disparity between the performance in bonds and that of stocks and commodities. Nearly any kind of well-diversified portfolio is bound to experience a loss in this environment. However, these returns are far less balanced than we might expect. Typically, when bonds lose over 8% in 6 months, other asset classes, such as stocks, will also experience radical shifts.
Comparison of Asset Class Returns When Bonds Lose >8%
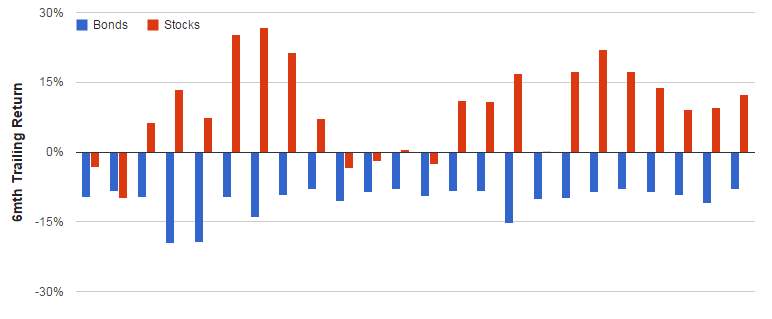
The typical "mirror image" is what we expect, because markets generally react together. In fact, there have only been three other periods in recent history where stocks have remained relatively unchanged while bonds are plummeting: April 1973, June 1994, and June 2009. Every case provides evidence that suggests this current environment will be temporary.
History Shows This Environment Will Not Last
Period 1: November 1972 to October 1974
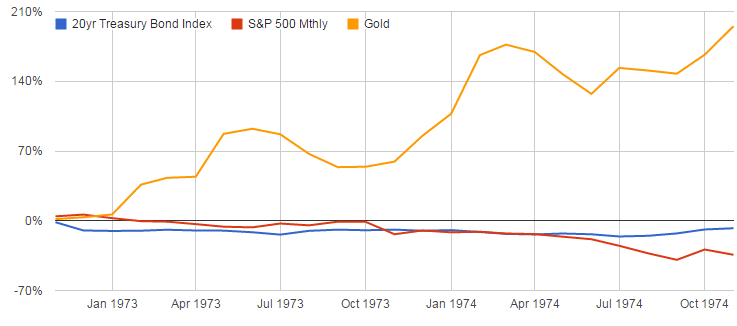
In April 1973, inflation fears had begun to grip the country as we had recently moved off the gold standard. Bonds were off about 10% as interest rates began increasing, but stocks were only down 3% or so. If inflation was going to become a major threat, both stocks and bonds would likely struggle, while real assets, such as commodities, would soar. However, stocks took a bit longer to react to this eventuality than other assets, remaining near flat through October. As it became more obvious that the inflation pressures were real, stocks went on to lose over 30% in 1974 while gold continued a phenomenal rally.
Period 2: January 1994 to January 1996
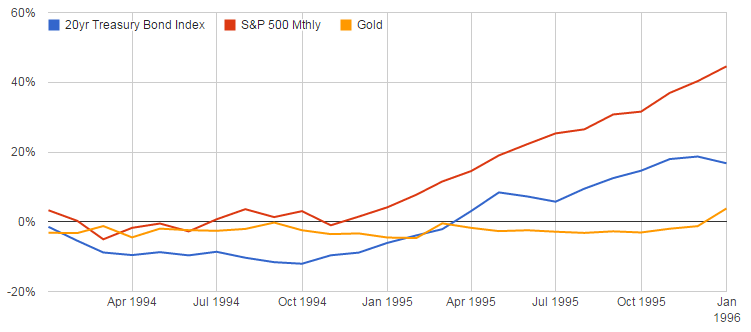
In July of 1994, Alan Greenspan and the Fed were worried about the threat of inflation in a rapidly expanding economy, and began quickly ratcheting up interest rates. While bonds immediately dove, both stocks and commodities remained in a choppy trading range as investors waited to see how higher interest rates would affect the economy and whether inflation would become a continued threat.
In this scenario, there are three possible outcomes: 1) The Fed does not raise rates enough, allowing inflation to become significant, as it did in the 70s, 2) The Fed raises rates too much, causing a significant economic slowdown, or 3) The Fed balances it just right, keeping inflation under control without threatening the growing economy.
In this instance, the Fed struck the right chord. Even though interest rates reached nearly 6% by the end of 1994, the economy kept growing while inflation remained tame. Both bonds and stocks had significant upside moving forward, as interest rates peaked, inflation was reasonable, and the economy remained strong.
Period 3: January 2009 to January 2010
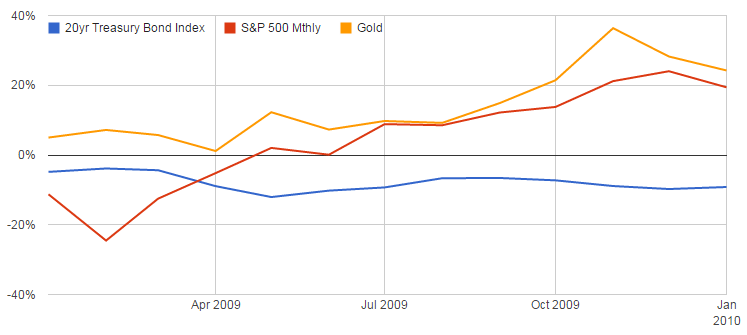
Immediately after the crisis in 2008, investors were worried about pretty much everything. Bonds plunged on fears of a government default or massive inflation and stocks dealt with the fallout of the financial crisis. Only gold began to rally as a last ditch safe haven. However, it didn't make sense for both stocks and bonds to underperform once it became clear the crisis was over. As signs of recovery began to appear, stocks started their current bull run and never looked back.
In all three of these examples, markets regained balance because at least one asset class rallied. History suggests this will happen again, and Hedgewise is in a position to benefit no matter which scenario unfolds.
Why Hedgewise Remains Well-Positioned
While Hedgewise is not "immune" to periods of loss, we provide two separate layers of protection to continuously increase the probability that your account will perform well over time.
First, we always maintain exposure across bonds, stocks, and commodities to avoid the danger of timing the markets and with the confidence that all assets tend to appreciate over the long run.
3 Year Trailing Returns by Asset Class, Since 1953
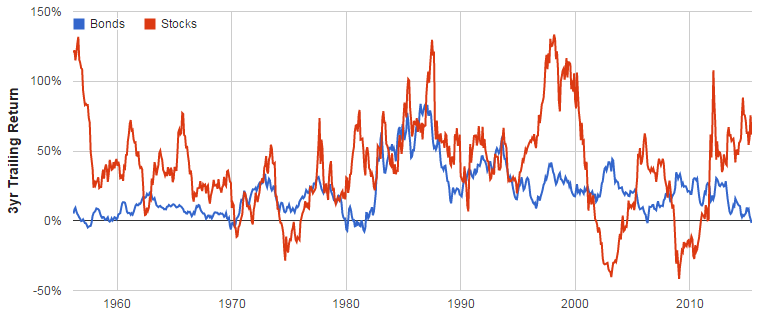
Over any three year period, both stocks and bonds tend to appreciate. However, a risk-balanced portfolio is dramatically more consistent than any single asset class. For example, consider a simple 60% bond / 30% stock / 10% gold mix.
3 Year Trailing Return, 60/30/10 Portfolio, Since 1970
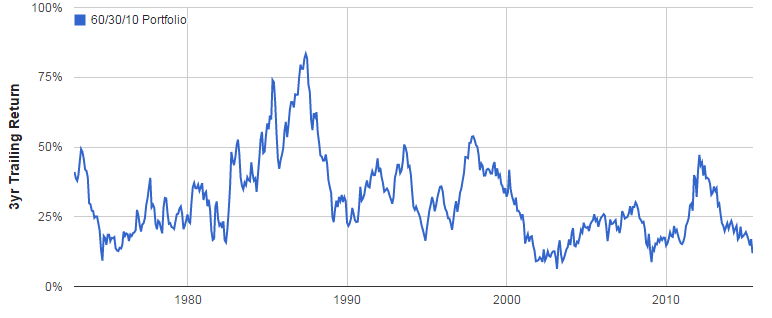
This portfolio has never lost money over any three year span. Hedgewise further improves on this simple mix by dynamically adjusting for risk and utilizing leverage to give you greater control over your desired return.
This enables us to reduce your exposure to certain asset classes as they become riskier, thus further increasing the chance that your return will remain "balanced". Here's how our overall bond allocation shifted for the Target 8% Index YTD.
Total Bond Allocation YTD, Target 8% Index Portfolio
Unlike the static portfolio, Hedgewise has shifted down your overall allocation to bonds and reduced your losses this year as a result. Looking forward, these methods will continue to limit your downside while giving you an extremely high likelihood of positive returns over time.
While we remain very confident in the continuing power of these underlying principles, we must emphasize that periods of loss are absolutely inevitable. In any given ten year stretch, it is likely that you will experience one year that is far worse than the current one has been. However, because it will be so hard to time when that period will occur, or how long it will last, you will almost always do better by just remaining patient.
Conclusion
Markets this year have been a challenge. Bonds have experienced a major correction, commodities have been extremely volatile, and stocks have remained in a tight trading range. Despite this, Hedgewise losses remain relatively small, and have been moderated by our dynamic approach to risk management. History has shown that current market conditions will not last, and though it isn't yet clear which asset class will rally next, Hedgewise is already well-positioned to take advantage of it.
Still, experiencing losses will always be tough. We know exactly how it feels, because the founder of Hedgewise and his family are 100% invested in this strategy. It is human nature to second guess, and seeing your account value fall is inevitably an emotional experience. While we can't change this, we can give you the information you need to put these losses into context. By analyzing how markets have performed in similar situations in the past and learning how our strategy has optimized your portfolio, you gain a powerful counterweight against any emotional reaction. As challenging as it may be to endure losses, history has always rewarded patience and perspective, and we look forward to proving that again.
Disclosure
This information does not constitute investment advice or an offer to invest or to provide management services and is subject to correction, completion and amendment without notice. Hedgewise makes no warranties and is not responsible for your use of this information or for any errors or inaccuracies resulting from your use. Hedgewise may recommend some of the investments mentioned in this article for use in its clients' portfolios. Past performance is no indicator or guarantee of future results. Investing involves risk, including the risk of loss. All performance data shown prior to the inception of each Hedgewise framework (Risk Parity in October 2014, Momentum in November 2016) is based on a hypothetical model and there is no guarantee that such performance could have been achieved in a live portfolio, which would have been affected by material factors including market liquidity, bid-ask spreads, intraday price fluctuations, instrument availability, and interest rates. Model performance data is based on publicly available index or asset price information and all dividend or coupon payments are included and assumed to be reinvested monthly. Hedgewise products have substantially different levels of volatility and exposure to separate risk factors, such as commodity prices and the use of leverage via derivatives, compared to traditional benchmarks like the S&P 500. Any comparisons to benchmarks are provided as a generic baseline for a long-term investment portfolio and do not suggest that Hedgewise products will exhibit similar characteristics. When live client data is shown, it includes all fees, commissions, and other expenses incurred during management. Only performance figures from the earliest live client accounts available or from a composite average of all client accounts are used. Other accounts managed by Hedgewise will have performed slightly differently than the numbers shown for a variety of reasons, though all accounts are managed according to the same underlying strategy model. Hedgewise relies on sophisticated algorithms which present technological risk, including data availability, system uptime and speed, coding errors, and reliance on third party vendors.