


Summary
- The Hedgewise Risk Parity strategy is built to endure any economic environment and free you from worrying about what might happen next
- Rising interest rates are still a top concern for most clients
- We examine how the strategy performed in the 1970s, when interest rates experienced one of the most sustained uptrends in our economic history
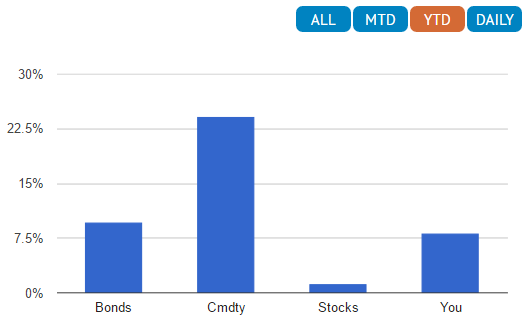
Hedgewise has had a phenomenal year-to-date. Our Risk Parity "High" portfolio is up nearly 9% while the S&P is up a little over 3%. This is primarily due to significant rallies in both the bond and commodity markets, as the Fed has adopted a more cautious approach in light of continued concerns of a less than robust US and global economy.
YTD Performance of Major Asset Classes vs. Hedgewise Risk Parity "High" (labeled "You")
Our clients have welcomed this outperformance, but the bond rally has raised a familiar worry: what happens when interest rates rise? Given our strategy has a heavier bond allocation than most traditional portfolios, is it time to consider alternatives?
Fortunately, we have decades of historical data that show the approach we use at Hedgewise does well even when interest rates rise. During the 1970s, the US experienced the most severe bond bear market in history. Despite this, the Hedgewise model portfolio managed to outperform the S&P 500 for a majority of that time period. This was possible due to the natural protection against rising rates provided by real assets like commodities, as well as our methods of active risk management. Perhaps more importantly, the use of leverage did not handicap our performance, dispelling the myth that Risk Parity fails when the cost of borrowing is high.
We think this data presents an extremely compelling case for why you can trust our strategy in any economic environment.
Modeling Performance in the 1970s: Risk Parity Still A Great Investment
From 1970 to 1983, the Federal Funds rate rose from 4% to nearly 20%, or a whopping 1600 basis points. The US was facing a vicious combination of rising prices and falling economic activity, also known as "stagflation". This provided an excellent environment to pressure test our Risk Parity framework, which you might expect to do terribly given its heavy bond allocation. However, just the opposite occurred: our model outperformed equities nearly the entire time.
To create the historical model, we had to make a few key assumptions:
- We are using a modified form of our proprietary risk management framework due to the lack of market data available in the 70s compared to today. If more data from this period was available, we expect our framework would perform even better than what this analysis reveals.
- We limited the portfolio to nominal bonds, equities, and gold because inflation-protected bonds (TIPS) did not yet exist, nor did reliable data on the price of commodities like oil and copper. The assets that we had to exclude all tend to perform well in periods of high inflation, and would likely have further buoyed performance within our full model.
- Risk Parity is typically available at multiple 'risk levels', the higher of which amplify expected returns through leverage. We ran an unleveraged "Low Risk" version of the model as well as a leveraged "High Risk" version.
- The portfolios are based on end-of-day index prices. All dividends and coupon payments are included and assumed reinvested. Leverage is assumed to have a cost equal to the rate on one-year treasury bonds. The model does not include the cost of commissions or management fees (however, note that these costs are accounted for in all of our live performance data).
Performance of Hedgewise Risk Parity "Low" and "High" Models vs. S&P 500, 1970 to 1982
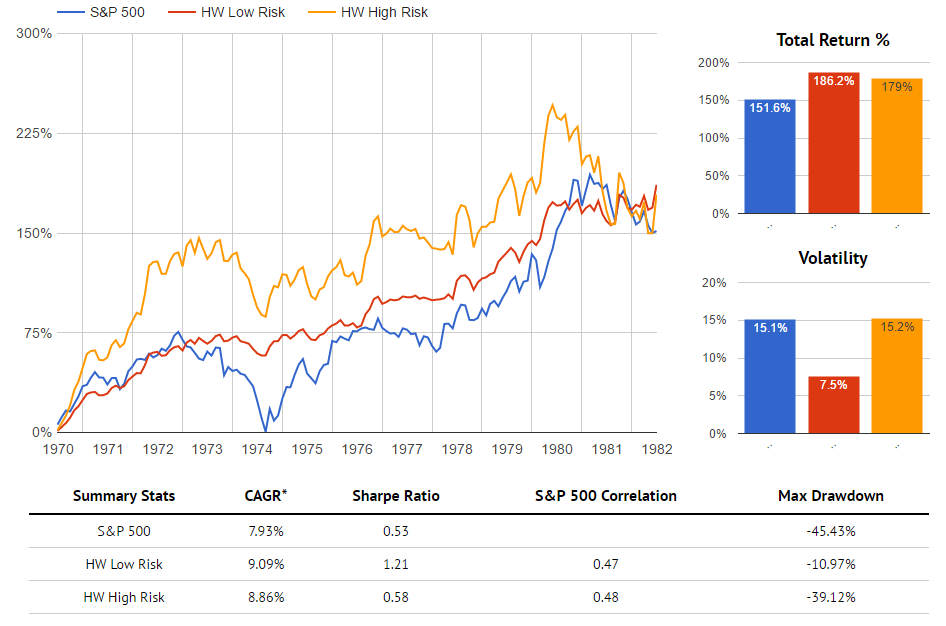
Despite one of the worst decades ever for bonds, both versions of the Hedgewise portfolio still outperformed equities for nearly this entire stretch. This was possible for a few reasons. First, ten-year bonds achieved an annualized return of about 6% during this timeframe. Even though rising rates eroded the principal value of the bonds, this was counterbalanced by consistently higher yields. Second, assets that provided protection from inflation, like gold, performed incredibly well as the value of the US dollar plummeted. Finally, the Hedgewise system actively managed the portfolio's bond exposure, and naturally reduced it in the periods of greatest expected volatility.
It is interesting to note that the "High Risk" portfolio outperformed the "Low Risk" portfolio for a majority of this time, despite the fact that it required leverage. This is counterintuitive for many clients, who naturally assume that a combination of high borrowing costs and a bond bear market will result in big losses. However, this is nothing but a myth as it relates to an effectively-run Risk Parity approach. As you can see, our returns were positive throughout most of the decade, despite the fact that rates were consistently rising. Our strategy is not a bet on bonds, but rather a bet on the timeless power of risk management and diversification. It is incorrect to assume that it is poorly suited for any particular environment, or that leverage will fail when short-term rates are high.
That said, the "High Risk" portfolio was clearly subject to much larger drawdowns, which is to be expected. This will be true whenever there is a significant market crash, regardless of the source. Equities were the cause of one big dip in 1974, while bonds were the culprit in the early 80s. If you believe such an event is imminent in any market, it is fair to consider moving to the "Low Risk" level, but it certainly wouldn't make sense to abandon the strategy altogether.
The takeaway from this data is quite significant: even in a rising rate environment, Risk Parity remains a great choice. With that said, recent history in the EU and Asia suggests that rising rates should be the least of your worries.
Where Have the Rising Interest Rates Gone?
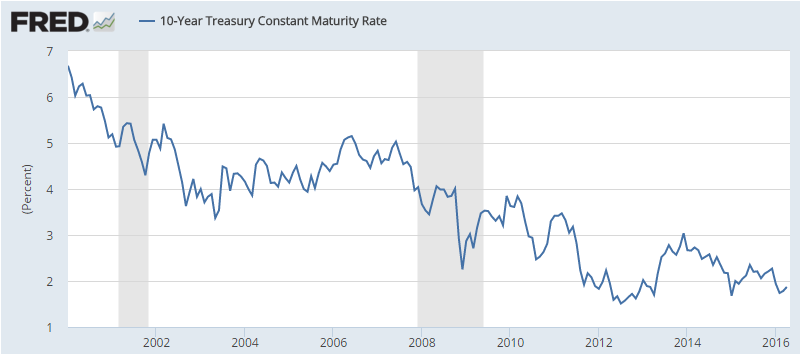
Supposedly, the bond bull market in the US has been on the verge of ending for almost 4 years. There was the so-called 'taper tantrum' in 2013, when yields rocketed over 100bps when Bernanke announced the end of 'Quantitative Easing'. To the surprise of many, the US economy continued to sputter along slowly and global weakness brought yields back down. In late 2015, the Fed was expected to raise rates as many as 6 times. A global collapse in commodity prices and rapidly slowing growth in China caused them to back-off again. Meanwhile, ten-year bonds have continued to hover around 2%.
10-Year US Treasury Yields Since 2000
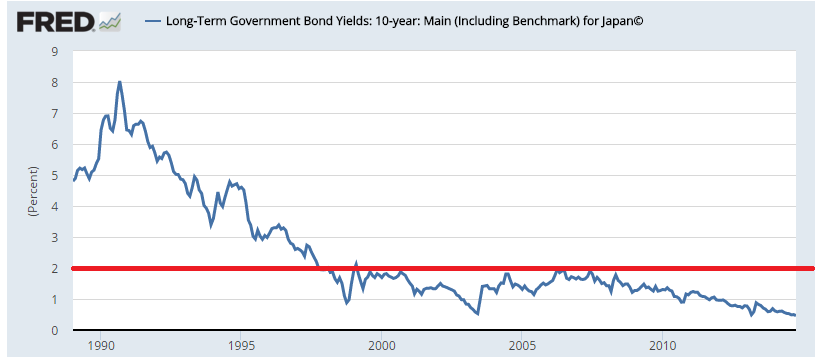
For many, the gut reaction to this graph is to think that we must be near the bottom; however, there is no reason that we can't fall well below a 2% yield for decades. Japan, for example, has had ten-year yields under this level for almost 20 years.
10-Year Japanese Treasury Yields Since 1990 (2% yield emphasized)
Many are quick to point out that our economic history is quite a bit different than Japan's. Instead, let's take a look at Germany:
10-Year German Treasury Yields Since 2000 (2% yield emphasized)
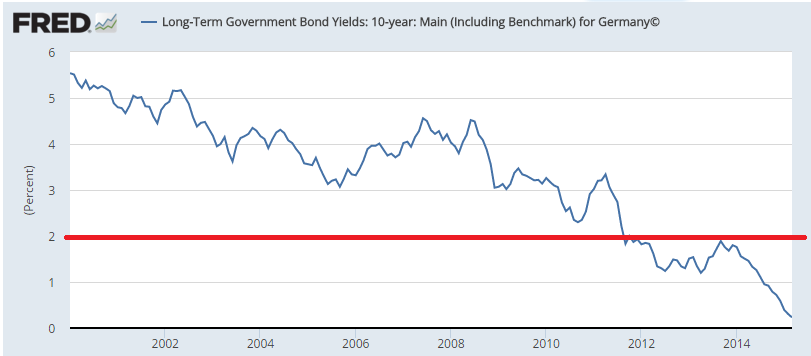
The reality is that the entire world remains in a very fragile state. On a relative basis, yields in the US are actually still pretty high. In the EU, a number of countries have recently introduced negative interest rates to continue to combat recessionary pressure. The point is that we may be at the end of the bond bull market, but it's also entirely possible that we are not.
Conclusion: Rising Rates Are Not a Big Concern
The evidence presented in this article helps clarify some extremely important concerns about Risk Parity. Adding leverage to a bond-heavy portfolio never resulted in disaster even when interest rates were skyrocketing. During the most inflationary period in US history, our model outperformed the S&P 500 for a majority of the time. These facts boldly refute the idea that Risk Parity only 'works' during bond bull markets.
Inherent in a truly diversified portfolio will always be periods when one asset is outperforming the others. In exchange for tolerating this, you get steadier, more reliable returns that do not depend on predicting the future. Your portfolio becomes less vulnerable to a crash in any given market.
One of the core premises of Risk Parity is the ability to endure any economic environment. While its relatively heavy exposure to fixed income and the use of leverage give many pause, there is little reason for concern. If the Hedgewise model portfolio can successfully endure a decade when rates rose by over 16%, we are confident it will remain an excellent investment choice no matter what comes next.
Disclosure
This information does not constitute investment advice or an offer to invest or to provide management services and is subject to correction, completion and amendment without notice. Hedgewise makes no warranties and is not responsible for your use of this information or for any errors or inaccuracies resulting from your use. Hedgewise may recommend some of the investments mentioned in this article for use in its clients' portfolios. Past performance is no indicator or guarantee of future results. Investing involves risk, including the risk of loss. All performance data shown prior to the inception of each Hedgewise framework (Risk Parity in October 2014, Momentum in November 2016) is based on a hypothetical model and there is no guarantee that such performance could have been achieved in a live portfolio, which would have been affected by material factors including market liquidity, bid-ask spreads, intraday price fluctuations, instrument availability, and interest rates. Model performance data is based on publicly available index or asset price information and all dividend or coupon payments are included and assumed to be reinvested monthly. Hedgewise products have substantially different levels of volatility and exposure to separate risk factors, such as commodity prices and the use of leverage via derivatives, compared to traditional benchmarks like the S&P 500. Any comparisons to benchmarks are provided as a generic baseline for a long-term investment portfolio and do not suggest that Hedgewise products will exhibit similar characteristics. When live client data is shown, it includes all fees, commissions, and other expenses incurred during management. Only performance figures from the earliest live client accounts available or from a composite average of all client accounts are used. Other accounts managed by Hedgewise will have performed slightly differently than the numbers shown for a variety of reasons, though all accounts are managed according to the same underlying strategy model. Hedgewise relies on sophisticated algorithms which present technological risk, including data availability, system uptime and speed, coding errors, and reliance on third party vendors.