


Summary
- Many are perplexed by the current state of markets: how can you have a global pandemic and recession alongside gains in nearly every asset class?
- This is being driven by the Fed's bold new experiment of targeting negative long-term real interest rates, which logically inflates the price of every investable asset.
- Unfortunately, this will result in bizarre, risky side effects, including increased volatility, lower expected returns, a more limited ability to diversify, and little buffer against future economic shocks.
- Traditional passive investors are left with unsavory options: either push into riskier assets despite a poor risk/reward ratio, or miss out altogether.
- Fortunately, the Hedgewise Risk Parity product presents an attractive alternative since it diversifies more intelligently than traditional products and can accrue gains outside of pure asset appreciation.
- We'll walk through how the investment environment has shifted, what it means for the future outlook, and how to consider potential changes to your portfolio mix or risk level.
Introduction: The Real Story of 2020
In 2019, if you had told most investors that within a year, the US would have nearly 10% unemployment, a global pandemic, and a worldwide recession, few would have predicted the outcome we have today. Despite the recent bout of volatility in September, stocks remain up over 4% YTD alongside gains of over 20% in bonds and gold. How can this be?
While the weekly media narrative shifts between the impact of retail traders, or a repeat of the dot-com bubble, or the flood of government stimulus, the relatively simple explanation lies with the Fed. The only fundamental economic factor that can cause stocks, bonds, and gold to appreciate at once is the decline of real interest rates, and the Fed has now launched the world into a truly extraordinary state in this regard.
While short-term interest rates were frequently near zero after the Great Recession, long-term rates (i.e., 20yr and 30yr Treasury bonds) never fell below 2%, which makes good sense. Since the Fed's inflation target is 2%, it is reasonable to figure that nominal interest rates will be at least that amount; otherwise, government bonds become a guaranteed losing investment in real dollars (a.k.a., negative "real" interest rates). It also makes sense that most investors want some return on top of inflation, especially for a 20+ year investment, in exchange for taking on the risk of higher than expected interest rates.
Yet the Fed has been on a mission this year to bring long-term rates deeply into negative territory: the real yield on 10yr Treasuries is now -1.1%. On first glance, you might think sure, but it's a recession, so the Fed lowers rates like they always do. But make no mistake, this time is different. We are now far below any historical levels, and this is altering every aspect of the investment world in radical new ways. Some of the expected effects include:
- Significantly increasing price-to-earnings multiples, especially within growth stocks
- Lowering expected returns and increasing volatility across all asset classes
- Eliminating traditional sources of diversification
- Imposing asymmetric downside risk on all passive investments
- Amplifying the negative impact of adverse economic events in the future
There are good reasons why this state has been carefully avoided by the Fed in the past, and though it may be necessary for the time being, the ramifications go much further than the pandemic itself will. Let's dive into the nature of this new landscape and what it means for the future of investing.
Gaining Perspective through the Ugly State of Bonds
Treasury bonds provide an excellent and straightforward primer on how we have entered new historical territory, and why this formulaically creates unfortunate side effects.
On the historical front, the following chart provides a view of how the interest rate on 20yr Treasury bonds changed in every U.S. recession since 1953, with our current one in 2020 included as the final data point. The left y-axis measures how far 20yr rates went down from peak to trough over the course of the recession (i.e., if they peaked at 5% before the recession and troughed at 3% during the recession, it would show -2%). The right y-axis converts this to a measure of the relative distance that rates moved toward the "zero bound", where -100% would mean that rates had gone all the way to zero (beyond which rates are extremely unlikely to travel further).
Historical 20yr Treasury Bond Interest Rate Movements During U.S. Recessions
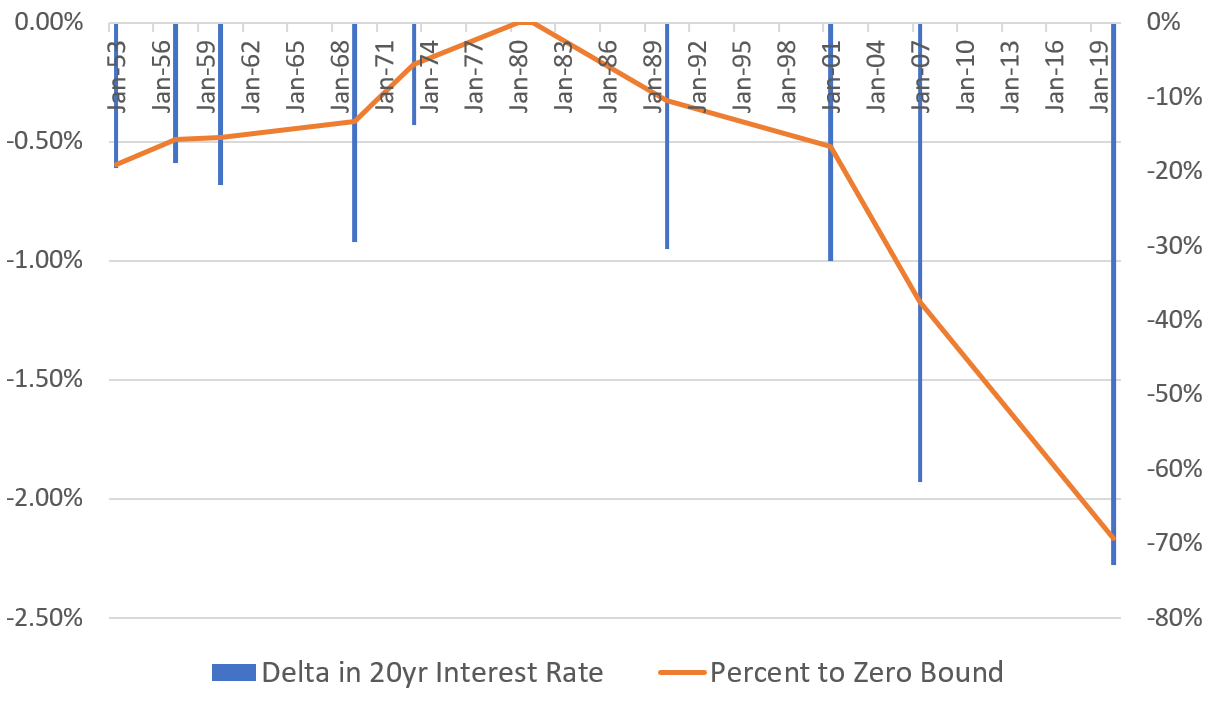
The aftermath of the Great Financial Crisis of 2007 was already somewhat unique: long-term rates moved down twice as much as they had historically, and traveled to a much lower absolute level. However, that now pales in comparison to this year, which has been far bigger and far bolder than anything that came before as the Fed moves precariously close to the zero-bound.
To give a sense of the impact, here is the current expected payoff diagram from an investment in 20yr Treasuries compared to mid-2019. This shows you the expected real (adjusting for inflation) total return depending on where 20yr rates move, and assumes inflation meets current expectations of 1.9% throughout the holding period.
20yr Treasury Bond Expected Real Returns, Current vs. Mid-2019
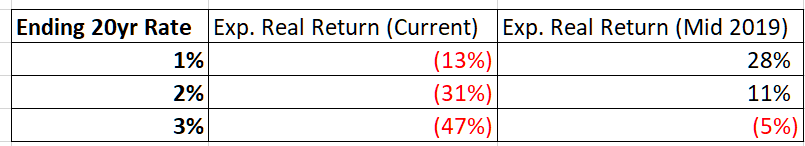
Negative real long-term rates essentially turn bonds into "return-free risk" rather than "risk-free return". This is different from anything we saw during the 2010's; low interest rates are not the same as negative rates. The only reason bonds are being bought at these levels is because the Fed is basically using all of its money-printing powers to keep buying them. This creates asymmetric downside risk: best case, you lose a little bit of money, and worst case, you lose a ton.
The mathematical mechanics in play here are important to understand. As interest rates head toward zero, you are effectively moving all potential future profit into today's price. For example, if you had a 1yr bond that yields 10%, you'd pay $100 for it today and get back $110 next year. However, if it yields 0%, it would already cost $110. The Fed is artificially inflating bond prices to near their maximum limits to service its broader goal of stimulating the economy. While this may be a necessary lever for the Fed, it creates a catch-22 for fixed income investors. It's sort of like a bubble, but it has nothing to do with speculative investors or irrational expectations. It's a pre-meditated action by the Fed that inflates asset prices to create a negative yield.
Unfortunately, it is not possible to limit this dynamic to fixed income, as the yield on Treasury bonds sets what is known as the "risk-free rate" on all other asset classes. Let's take a look at the strange ways that negative real yields have been metastasizing.
"Not A Bubble" Bubbles
Equities have been the big mystery for most investors this year because it doesn't really make sense through the lens of a global pandemic. Why would tech company valuations go through the roof based on a temporary event? How can a market with a recession and millions of newly unemployed be worth more than 2019?
If you try to analyze this through the lens of profit and loss, you will likely be confused. If you look instead to the role of negative real interest rates, far more clicks into place.
From an analytical perspective, the value of any given asset in the present moment is the value of its future cash flows discounted to today. For a stock, this means you would take all the future expected earnings of a company and discount them by some reasonable rate of return to adequately compensate for risk. In perpetuity, such a formula simplifies to the following:
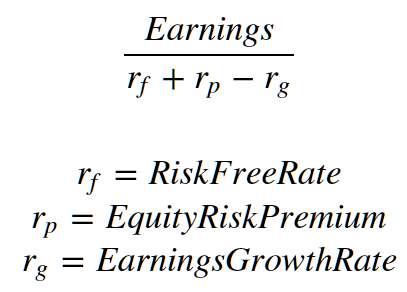
The result of this formula will be your rough "fair value" price, which also reveals your expected price/earnings multiple (e.g., if your earnings were $1 and you divide that by 5%, you get a $20 price and a 20 P/E multiple). In other words, the three variables listed here are the main determinants of the price/earnings (a.k.a., "P/E") ratio.
You can use this to "model" a P/E for the S&P 500 using assumptions for each of the values of the denominator, and compare that to the actual P/E in any given year. For example, the following chart uses 10yr Treasury bonds as the risk-free rate, sets the equity risk premium to its historical average of 5%, and uses an estimate of 2% for the earnings growth rate.
S&P 500 Trailing Actual P/E vs. "Model" P/E, 1954 to Present
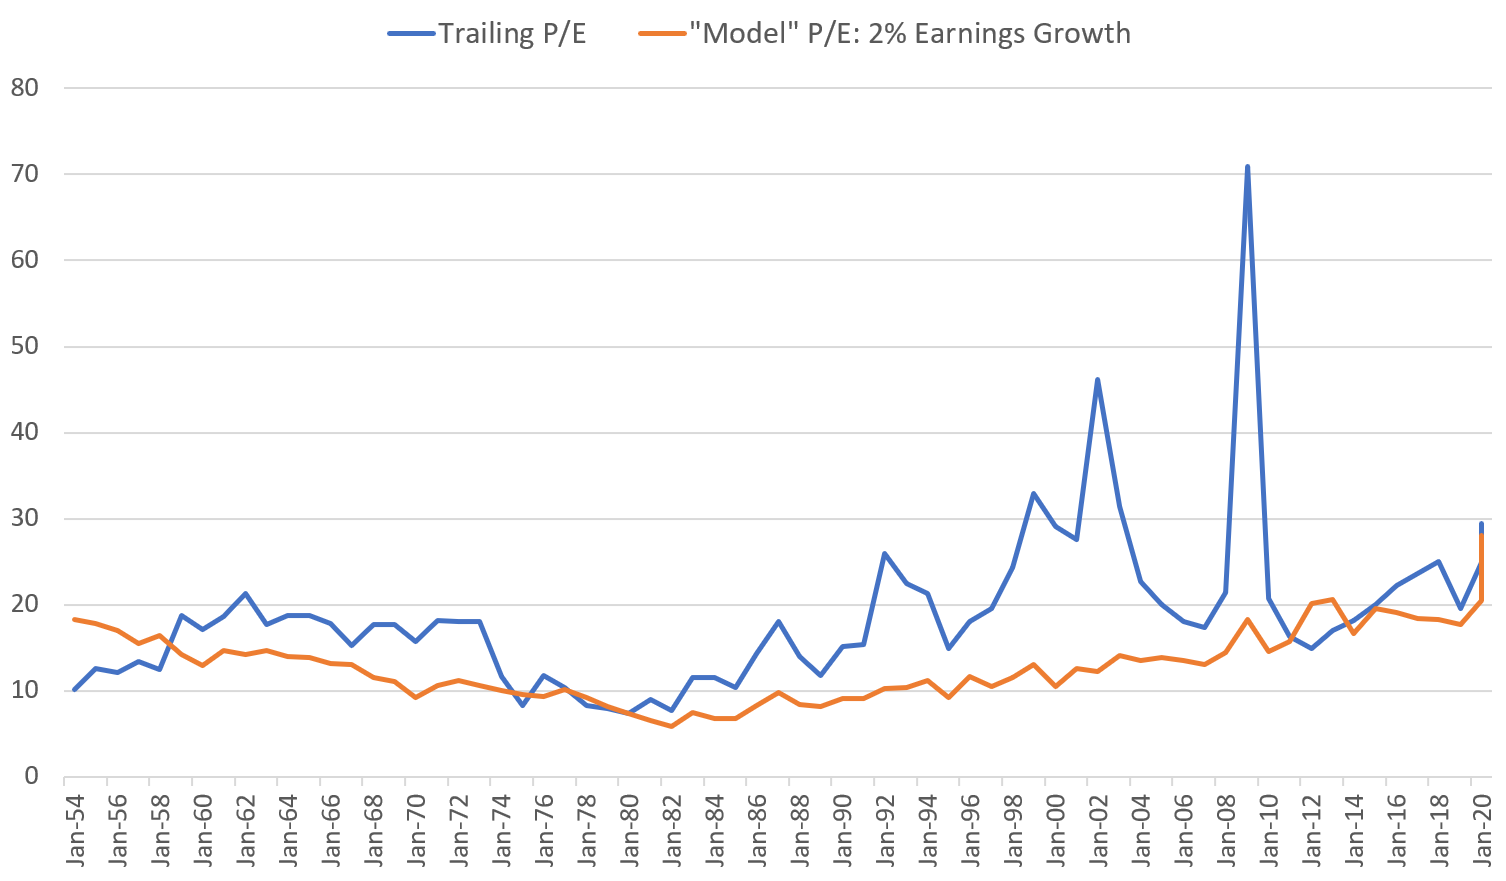
To first clarify the wild peaks in the blue line, the only long-term P/E data available is trailing 12 months, which results in an inevitable lag given the market is forward looking. For example, the spike in 2009 represents the market recovery right after earnings bottomed out in 2008. Forward earnings also tend to be higher than trailing earnings, so the blue line is somewhat inflated (i.e., if you could use forward earnings instead, the denominator would be higher, and the blue line would be lower).
Rather than delve too deeply into these mechanics, focus instead on the extreme bounce in the model P/E this year. Holding all else constant, the introduction of negative real interest rates theoretically justifies a 30-50% inflation of the price of the S&P 500. While this dynamic existed to some degree in prior recessions and as interest rates slowly fell over the past thirty years, never has it been this fast or steep.
It is confusing to make sense of this. Price multiples are nearing levels that have never been sustainable historically, but they are also quite reasonable compared to the model. You could argue that equities are too expensive but also too cheap in the same breath. The trouble is that interest rates near zero will naturally produce these kinds of bizarre contradictions.
The reason for this is mathematical. As the risk-free rate in the earlier equity pricing formula approaches zero, all you are left with is the equity risk premium subtracted by the earnings growth rate. This number begins to get quite small, especially for high growth stocks. As the denominator approaches zero, the result expands exponentially. For example, here is how your model P/E changes as you adjust assumptions for the risk-free rate and earnings growth while assuming a static 5% equity risk premium.
How "Model" P/E Ratios Change with Risk-Free Rate and Earnings Growth Assumptions
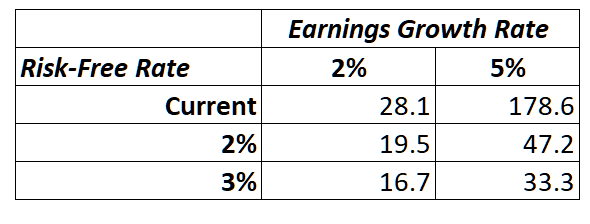
These values justify north of a 40% appreciation this year in "average" stocks, but nearly a 300% jump in "growth" stocks (i.e., from 47.2 up to 178.6). This provides some insight into corners of the market that have seen explosive P/E growth recently, like Tesla currently sporting a multiple north of 900 and Amazon moving from 80 up to 120. The problem is that while these prices may be justifiable mathematically, they are not connected to an actual increase in future expected profits.
This potentially creates a situation similar to a speculative bubble. Despite no change to business fundamentals, assets prices inflate to extreme levels. These prices will functionally reduce earnings yields and future expected returns, and will probably fall substantially if interest rates ever go back up. At the same time, there may be huge near-term gains up until the point of "maximum inflation".
This is the dilemma now facing the world. What is the right way to handle it?
Mapping the Bigger Picture
The following illustration provides an effective roadmap for thinking through these issues at a high level. This shows how the hypothetical total returns of a 10yr passive investment change as interest rates move to the zero bound. The blue line is the "normal" state of markets with rates above 2%. The orange line is the "expected" behavior after rates hit zero, and the yellow line is what may happen at the extremes.
How Passive Expected Total Returns Change Over Time with Zero Interest Rates
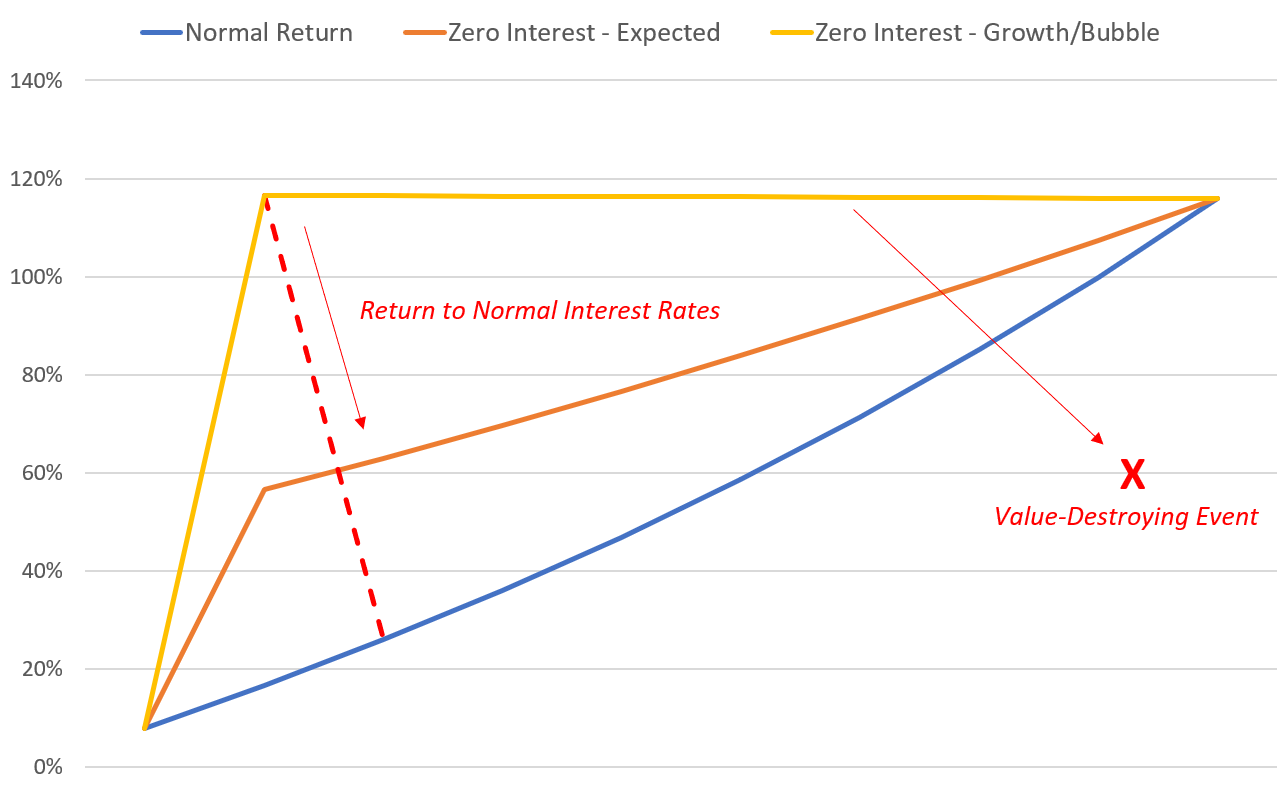
Mechanically, notice how all three lines wind up in the same place. This must be true if nothing has changed economically speaking, as there are still the same total profits available over time in all states of the world. All that is happening is a shift of when you realize those profits.
The more sensitive an asset class is to interest rates, the more likely it is to move closer to the yellow line, at which point it becomes "return-free risk". Treasury bonds are here already, along with all fixed income assets in degrees. High growth segments of the stock market may approach this level depending on the degree of price/earnings inflation. These assets are no longer effective investments because near-term gains have exhausted future earnings potential, yet they may ironically seem attractive because of the visibility of short-term appreciation.
While the S&P 500 as a whole is probably closer to the orange line, it still faces much more asymmetric downside risk than it did before. A return to normal interest rates will probably result in a price correction even amidst positive economic conditions. Should any negative economic shock occur, the S&P 500 will have less built-in cushion due both to elevated initial prices and the inability of the Fed to lower rates further.
Against this backdrop, one of the big questions floating around is whether investors should now overweight or even leverage into equities as there are so few other options to pick up a reasonable return. This framework highlights why that is probably a bad idea: you would be risking up right after missing a period of asset price inflation, which will then amplify your losses should any of the above risks unfold with no clear recourse for recovery.
Despite this, many passive, traditionally risk-averse investors are feeling cornered into this option, further exacerbating the potential loop of rising equity prices and market instability. If any negative shock occurs, there will be a much higher likelihood of large losses due to panic selling. Even small changes in risk aversion could spark spiraling moves, which is likely what we've seen so far this September.
The more sensible move is to sit tight at whatever equity weight you began before all of this. You'll wind up in the same place by the end, even if you happen to accrue more of it now and less of it later. You'll also remain consistent with your prior risk tolerance, and avoid the need to speculate on whether and when interest rates will rise.
This advice may feel dissatisfying against a backdrop of lower future returns, and it doesn't address what to do with the cash that used to be in safer instruments like government bonds. There's no easy way out of this knot for purely passive investments. In a Fed-induced bubble, the two best options are either excessive risk-taking with limited upside, or doing nothing at all. Fortunately, there are some more attractive paths in the world of alternative investments, where Hedgewise Risk Parity fits in quite nicely.
Hedgewise Risk Parity, and Other Alternatives
Hedgewise Risk Parity has two unique attributes that help separate it from the dilemma of the passive investment universe. First, it has a built-in method of managing volatility which can accrue gains independent of asset appreciation. Second, it automatically includes exposure to alternative assets, like gold and commodities, that are less sensitive to nominal interest rates. This opens up other paths of potential return, and maintains the diversification benefits inherent to the Risk Parity approach.
Volatility management is a fancy name for something intuitive: if prices are just going to bounce around for a while, buy a little when it goes down and sell a little when it goes up. I discussed this concept in depth in a previous article as it applies to bonds, but one chart is useful to revisit. The following simulates how the Hedgewise "risk-managed" approach compares to a passive investment in 30yr Treasury bonds over 5 years, assuming interest rates begin near their current level of 1.5% and end at the levels shown on the x-axis of the graph.
30 Year Bond Performance Simulation: Passive vs. Risk-Managed Investment
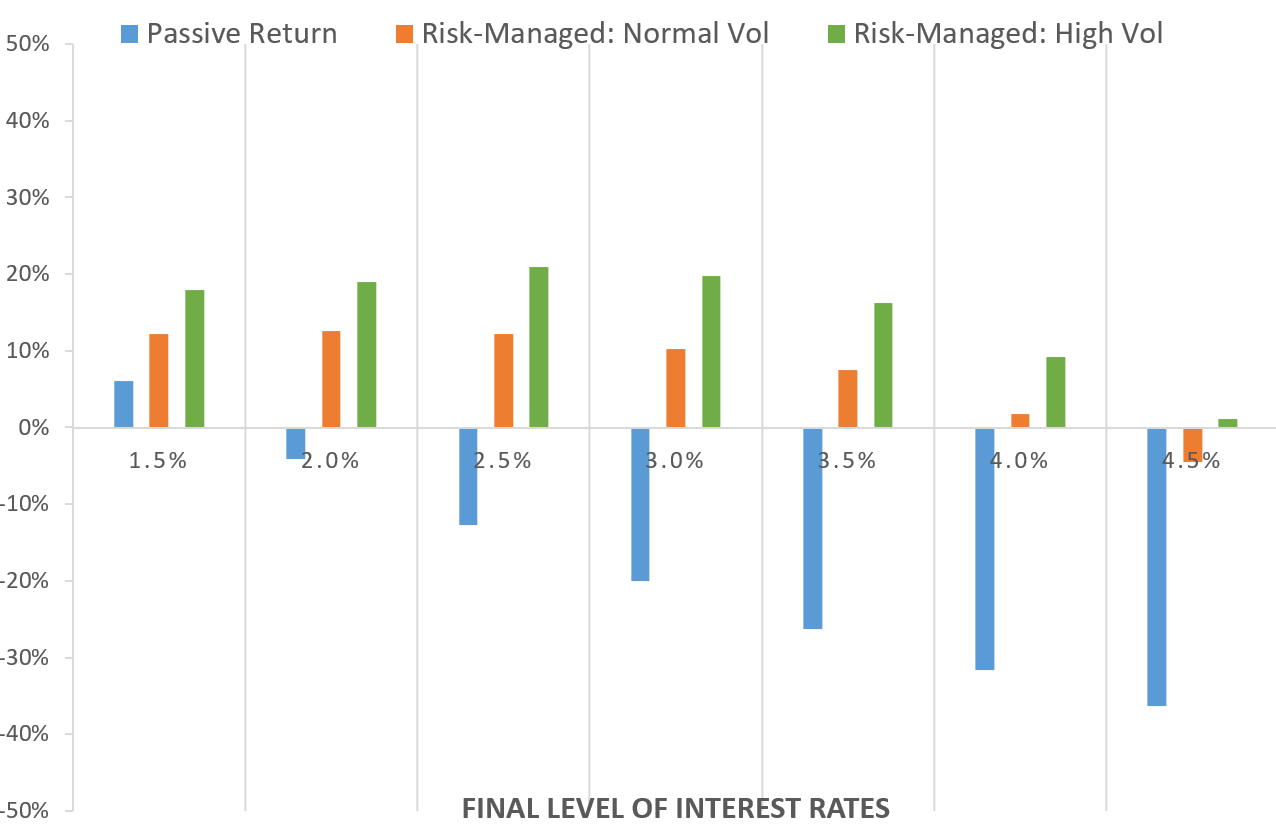
Depending on how volatile bonds are along the way, Hedgewise can usually pick-up a 10-20% gain, regardless of what happens to interest rates. The mechanics of this can be counterintuitive. You are never holding very many bonds, perhaps somewhere between 5-25% in total. You increase and decrease that amount as rates change to yield small gains, but day-to-day, you will only observe the impact of however bonds move. This can make it appear as if you are "long bonds" despite really being "long bond volatility". It also will leave cash on the sidelines because doing this at too high of a percentage would expose you to the downside of rising rates. This cautious, slow and steady approach is the only way to get outside of the passive trap discussed earlier. (As an aside, note that unlike Hedgewise, a purely passive Risk Parity product that never changes its bond weights would be vulnerable to substantial downside)
The second benefit of Hedgewise Risk Parity is the inclusion of alternative assets like gold and commodities as part of your mix. This exposure becomes more valuable as interest rates hit zero because their prices do not inflate to the same degree as stocks and bonds since they are real assets. For example, the price of oil is determined primarily by supply and demand, which helps explain why its current price remains low (alongside that of most energy companies). It can be easy to misinterpret this as a problem when you've seen such huge gains in the broader market, but it's actually evidence of commodities' independence. This means they are not vulnerable to the same asymmetric downside risk from interest rates, and maintain the possibility for significant appreciation in an inflationary environment. Commodities will remain an effective portfolio diversifier as a result, unlike bonds.
The impact of these benefits can be seen by mapping new risk vs. return expectations for each asset class. In the following diagram, the blue markers show the historical realized return and realized volatility for each asset since the 1970s, and the orange markers have shifted this to account for zero-interest rates.
Expected Future Risk vs. Return, Various Asset Classes
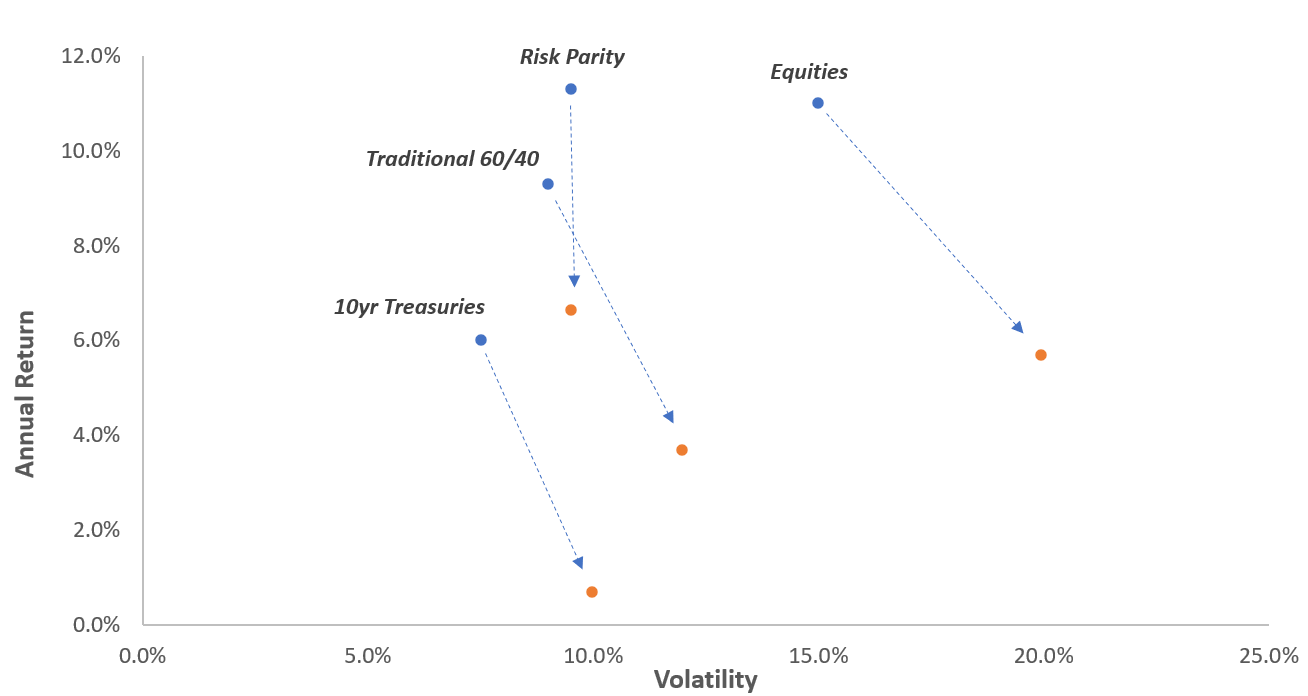
A couple of neat things are happening. All traditional passive assets face lower expected returns, the reasons for which we've already explored, and expected volatility goes up because of increased sensitivity to interest rates alongside increased speculative risk. Though Risk Parity will still lose the same expected risk premia from the underlying passive assets, its shift into volatility management along with its inclusion of commodities keep it steadier and less penalized by the environment.
This highlights why the Hedgewise Risk Parity product is an excellent alternative for parking cash that used to be in bonds. While you are still moving up the risk-scale to a degree (compared to holding cash), you don't have to go nearly as extreme as equities, and you don't incur the same degree of asymmetric downside from rising rates.
A more nuanced question is whether you should increase your current target volatility (a.k.a., use more leverage) in Risk Parity against this backdrop. This largely depends on whether you have room to absorb the additional risk this will entail in terms of your time horizon and personal goals. It also requires the understanding that such a move must be viewed with a long-term lens.
Nothing has gotten inherently "safer" amidst all of this. Hedgewise Risk Parity has clever mechanisms to help neutralize the risk of rising rates, and while that makes it relatively more appealing compared to traditional passive assets, it still faces the same potential for loss that it always has. As such, the trade-offs are pretty similar to what they were before. If you can tolerate the additional risk, and you require a higher target return than is currently expected, then such a move may be sensible. (I'd recommend a single move up on the risk scale to neutralize the impact of the new environment, e.g., from Low to Medium, Medium to High, and so on). However, an unpredictable negative shock is always a possibility, after which you need the capacity and time horizon to remain steady.
A more difficult conundrum faces those who require a higher return but have little risk to spare. Unfortunately, this is precisely what is meant by the danger of "excessive risk taking" with rates near zero. While there isn't an easy answer, Risk Parity is a much better vehicle than the passive alternatives if you require it. For example, if you used to yield 2% in 3mth Treasury Bills, Risk Parity Low/Medium is a much better replacement than 10yr bonds. Likewise, I'd sooner move up risk levels within RP than overweight into pure stocks.
In addition to Hedgewise Risk Parity, other alternative, more "active" investment vehicles gain relative appeal amidst this. Any strategy that can gain north of 5% independently of interest rates is suddenly much more valuable, especially with the availability of such cheap financing. This should be somewhat intuitive given the goals of the Fed: ideally, it would like everyone to gain a return by investing capital in real projects using real people. If you have access to the opportunity, the best risk/reward ratio will likely come from this kind of "sweat equity".
Wrapping Up: Preparing for a Strange Ride Ahead
Hopefully this provides a useful template for many of the contradictions of 2020, including the growing separation between the "real" economy and stock market, the "K-shaped" performance of growth versus non-growth stocks, the appearance of "bubble-like" speculative behavior in both individuals and asset prices, and confusing desires to invest in either the safest or the riskiest instruments. These are the results of the Fed's experiment with negative real yields, and will continue to have an influence that goes far beyond the pandemic itself.
Market behavior will remain strange. You could easily see short run-ups of 10-20% in the S&P 500 just as quickly reversed, with the same behavior amplified in high-growth stocks, and little of it may seem connected to fundamentals. Bonds will be a sleepy non-factor so long as the Fed is explicitly controlling yields, but underneath the calm veneer is a new source of "return-free risk" that eliminates the utility of traditional stock/bond diversification and lowers the expected future return of all passive asset classes.
The Fed may have no real choice in seeking its mandate of 2% inflation and maximum employment, but it is treading in very dangerous water. Negative real yields create systemic price inflation and instability, and simply returning to the world as of mid-2019 will risk cross-asset meltdowns. It has also removed any future buffer against economic shocks, which eliminates a key crutch that investors have relied on for almost 40 years.
Against this backdrop, most traditionally "safe" investments are no longer viable, which makes alternatives such as Hedgewise Risk Parity even more valuable as an option. While many investors are stuck deciding between cash and excessive risk-taking, Risk Parity provides a more balanced, independent, and inflation-hedged substitute for shorter-term money that may have previously been parked in Treasury bills or bonds.
In long-term portfolios, passive equities should retain a similar role as they had previously, but they are too dangerous to overweight any further. They are still the best source of passive risk premia available, but this new environment will exacerbate the risks of timing or shifting portfolio weights in the midst of it.
If these new conditions have pushed you below your ideal target return, there's no easy answer for how to improve your outlook, but some options are more appealing than others. Investments with less exposure to interest rates, and more opportunity for independent, "active" gains, should be the first choice if available. Increasing your risk level within Risk Parity is another option, if you have the tolerance, given its built-in volatility management and exposure to alternative assets. However, any changes should be handled with care, and with a recognition that they need to align with a long-term plan and weather near-term drawdowns.
Looking forward, the healthiest path for the world would likely be one in which the pandemic passes, and both productive growth and inflation pop right back up to 2%. The Fed would return rates to normal levels, and remove all these sources of dysfunction. Ironically, doing so would cause asset price deflation, but this would be a good thing and not too difficult to weather with the advice of this article in mind. In the meantime, let's hope for peaceful and positive economic developments - but I wouldn't construct your portfolio to count on it.
Disclosure
This information does not constitute investment advice or an offer to invest or to provide management services and is subject to correction, completion and amendment without notice. Hedgewise makes no warranties and is not responsible for your use of this information or for any errors or inaccuracies resulting from your use. Hedgewise may recommend some of the investments mentioned in this article for use in its clients' portfolios. Past performance is no indicator or guarantee of future results. Investing involves risk, including the risk of loss. All performance data shown prior to the inception of each Hedgewise framework (Risk Parity in October 2014, Momentum in November 2016) is based on a hypothetical model and there is no guarantee that such performance could have been achieved in a live portfolio, which would have been affected by material factors including market liquidity, bid-ask spreads, intraday price fluctuations, instrument availability, and interest rates. Model performance data is based on publicly available index or asset price information and all dividend or coupon payments are included and assumed to be reinvested monthly. Hedgewise products have substantially different levels of volatility and exposure to separate risk factors, such as commodity prices and the use of leverage via derivatives, compared to traditional benchmarks like the S&P 500. Any comparisons to benchmarks are provided as a generic baseline for a long-term investment portfolio and do not suggest that Hedgewise products will exhibit similar characteristics. When live client data is shown, it includes all fees, commissions, and other expenses incurred during management. Only performance figures from the earliest live client accounts available or from a composite average of all client accounts are used. Other accounts managed by Hedgewise will have performed slightly differently than the numbers shown for a variety of reasons, though all accounts are managed according to the same underlying strategy model. Hedgewise relies on sophisticated algorithms which present technological risk, including data availability, system uptime and speed, coding errors, and reliance on third party vendors.