Summary
- Since the lows of October 2022, the Hedgewise Risk Parity “Max” strategy has gained over 30%. Additional gains of ~25% are expected in the next 1-2 years, and the path to realizing them is straightforward.
- This is because the net prices of the underlying assets in the portfolio remain quite cheap. Bonds remain down 30% since the peak in January 2022, and a passive version of the Risk Parity portfolio remains down 20%.
- Despite this, Hedgewise is close to breakeven over the same timeframe due to the success of its risk management techniques. This differential is expected to drive net new gains as the underlying assets continue to recover.
Introduction: It’s All Gone to Plan, But This Part Is More Fun
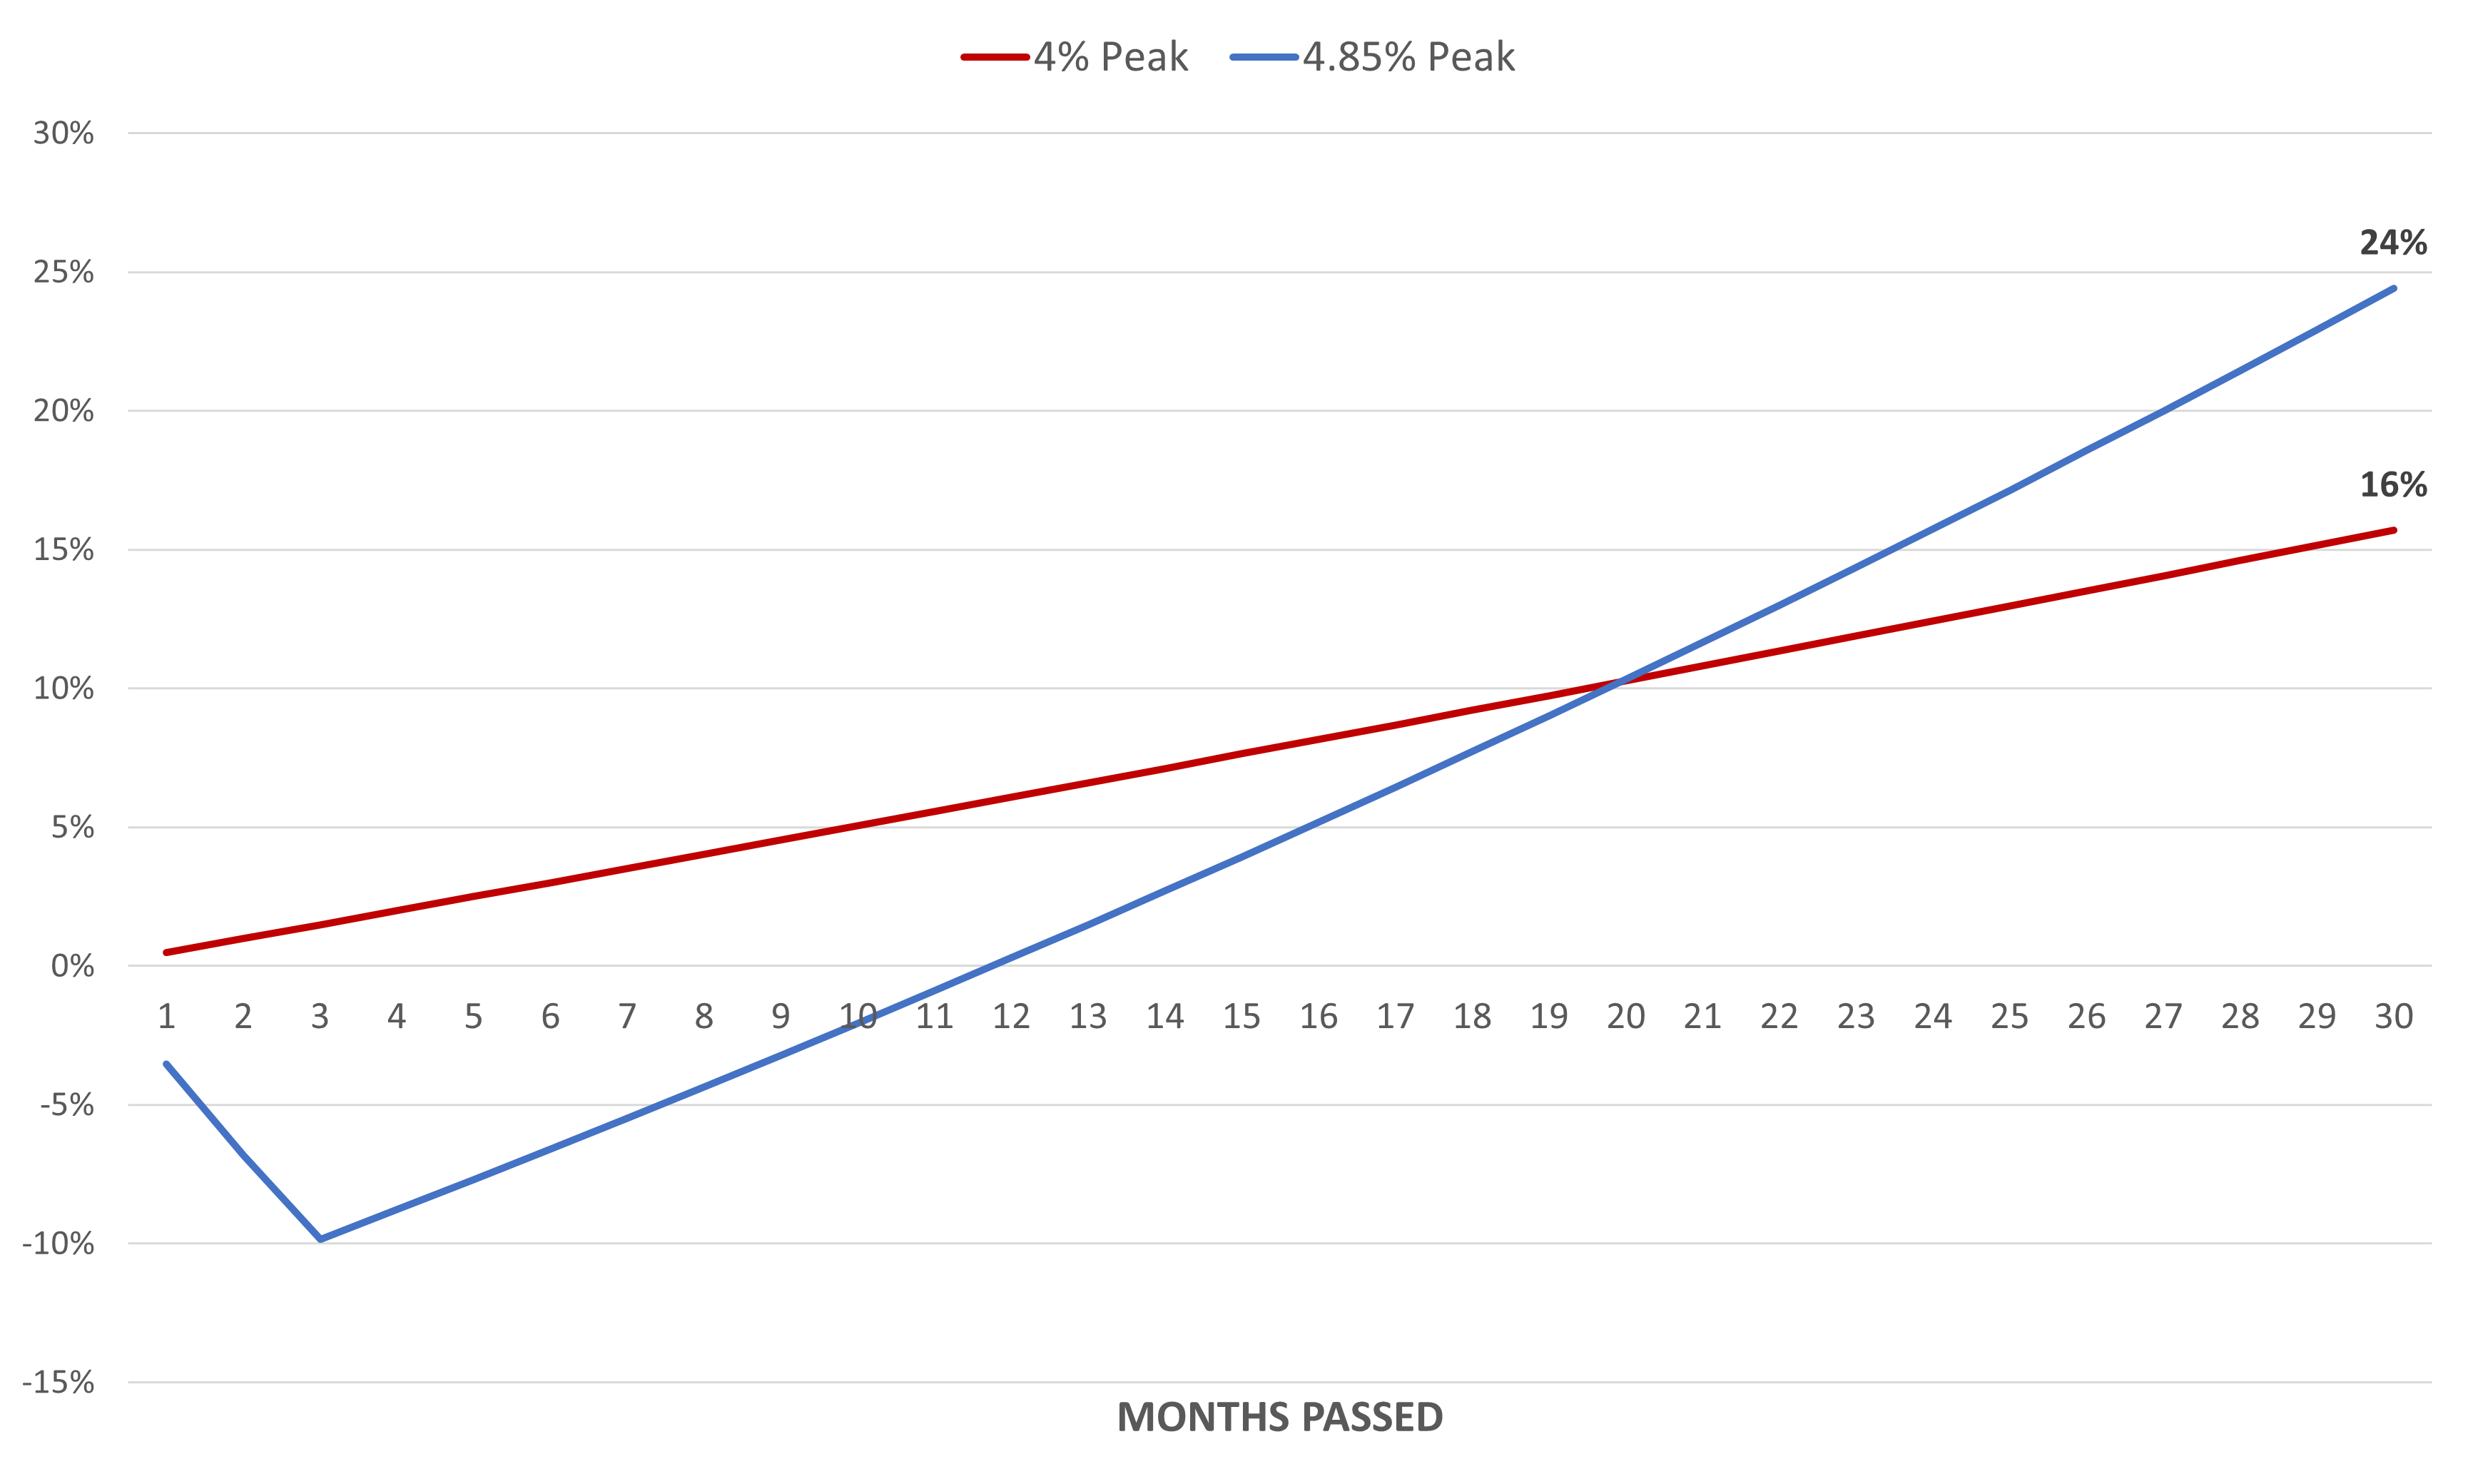
All the way back in July 2022, Hedgewise made a couple of bold claims. It predicted that the drawdown of that year would eventually result in "free" gains of 15-25%, and it also advised clients that it presented a great opportunity to either add funds or increase risk levels. Fast forward to today, and these claims have largely been validated.
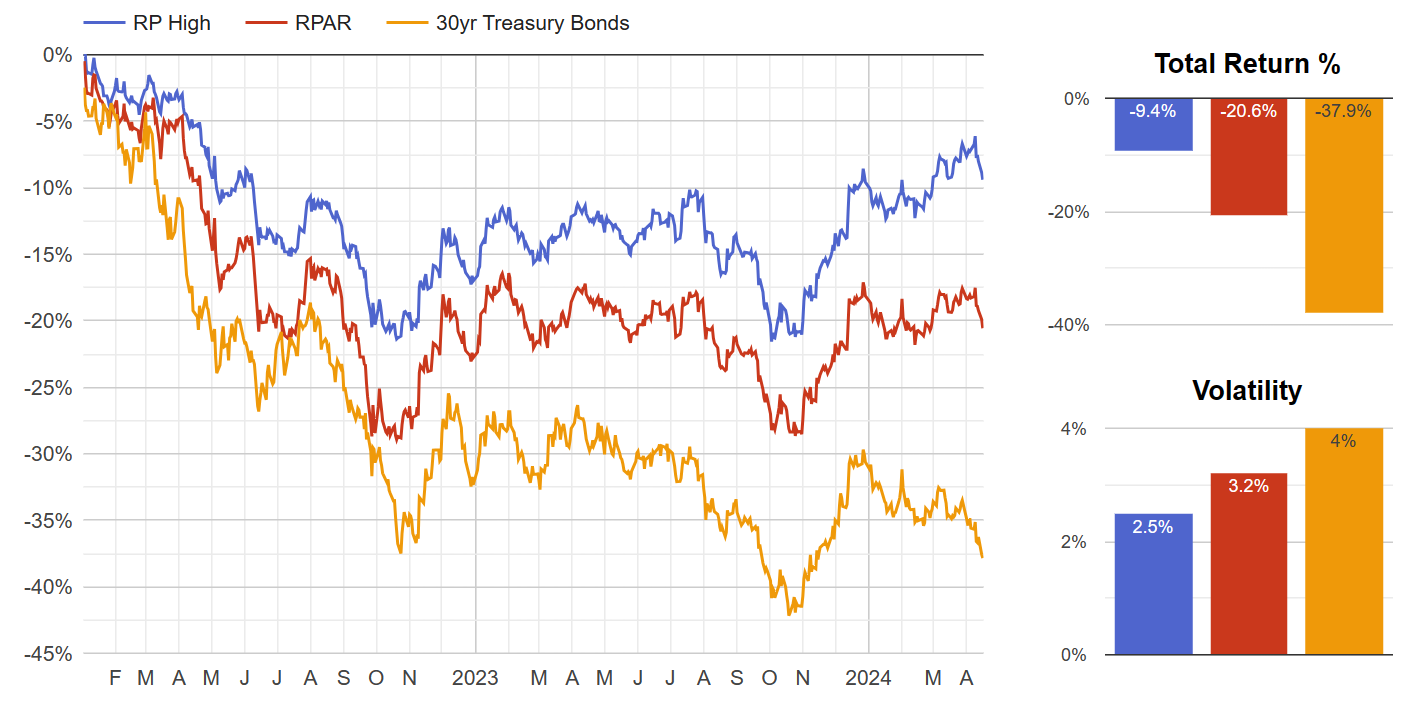
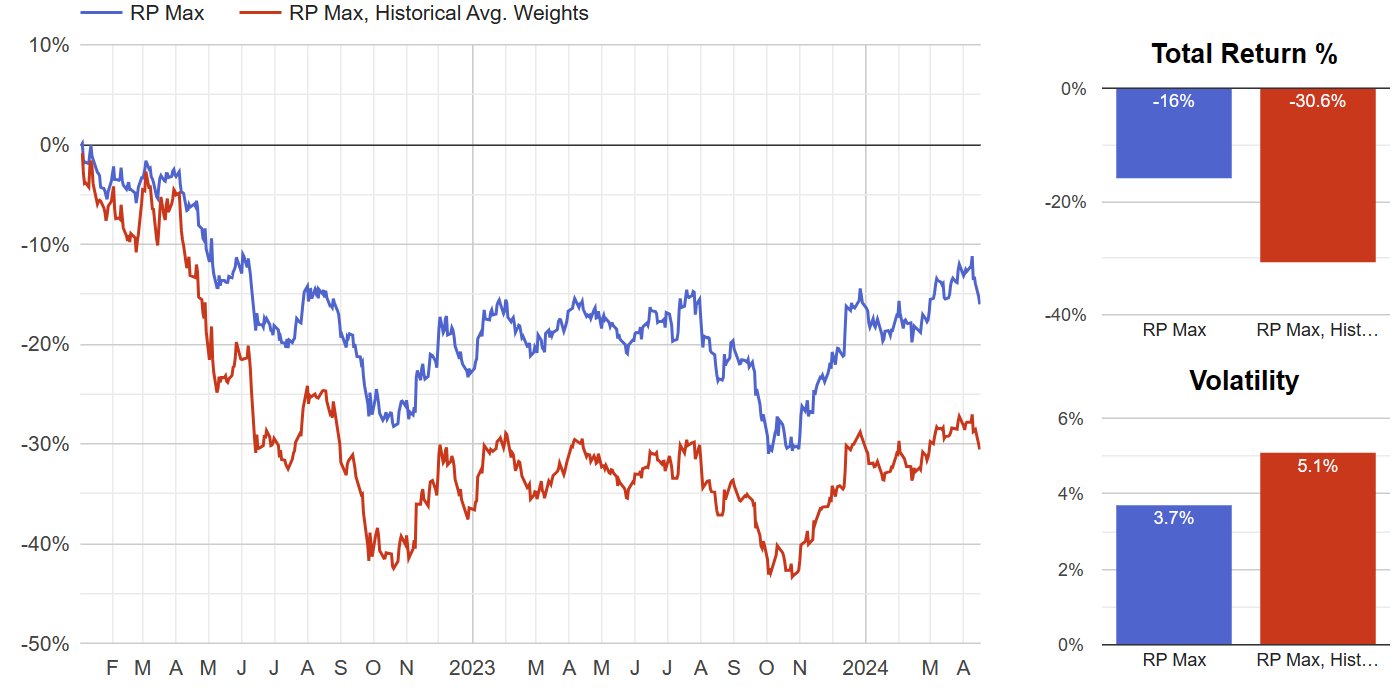
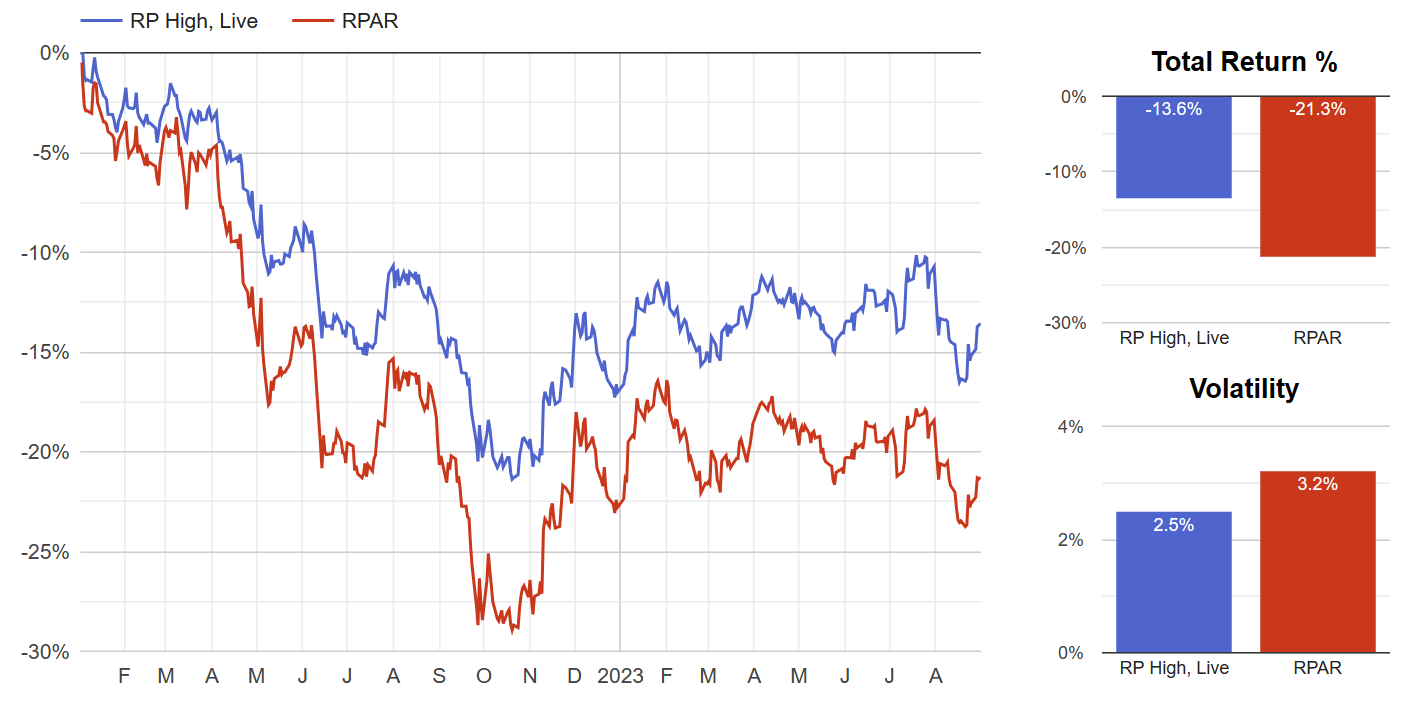
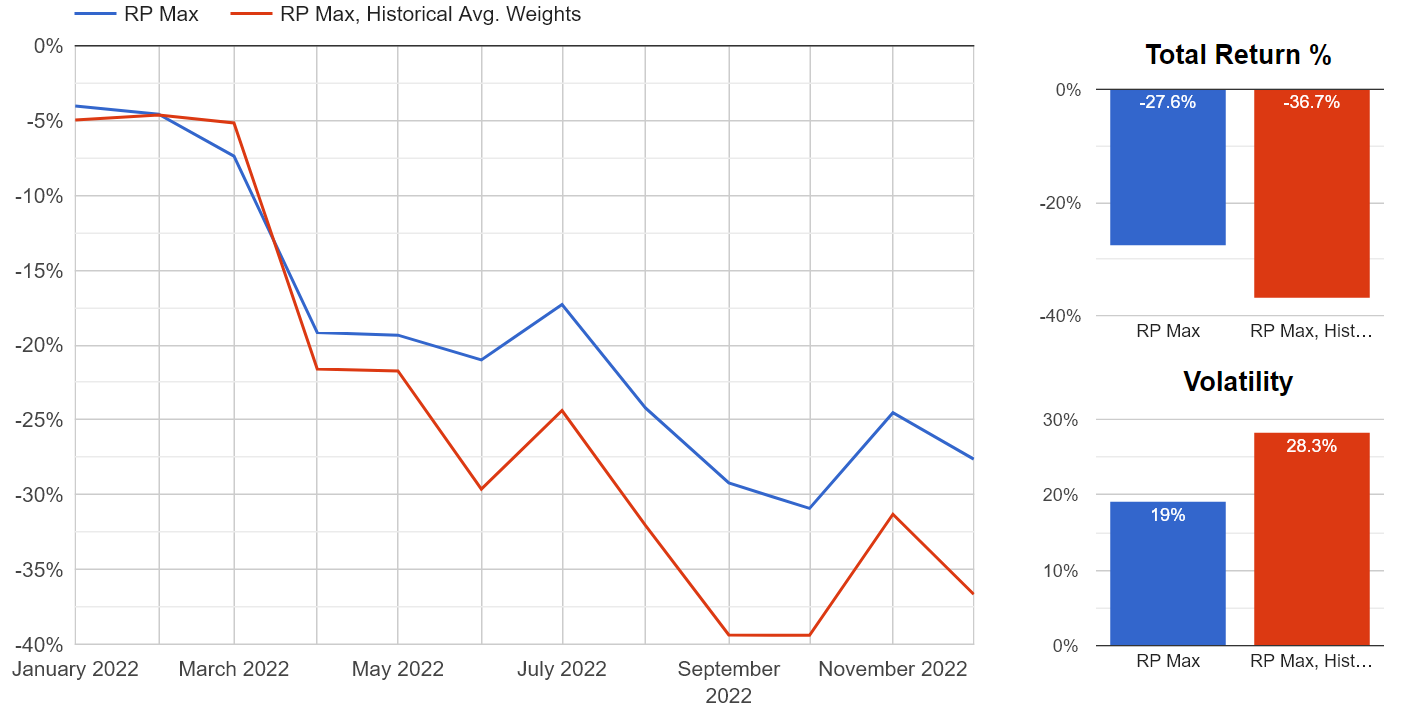
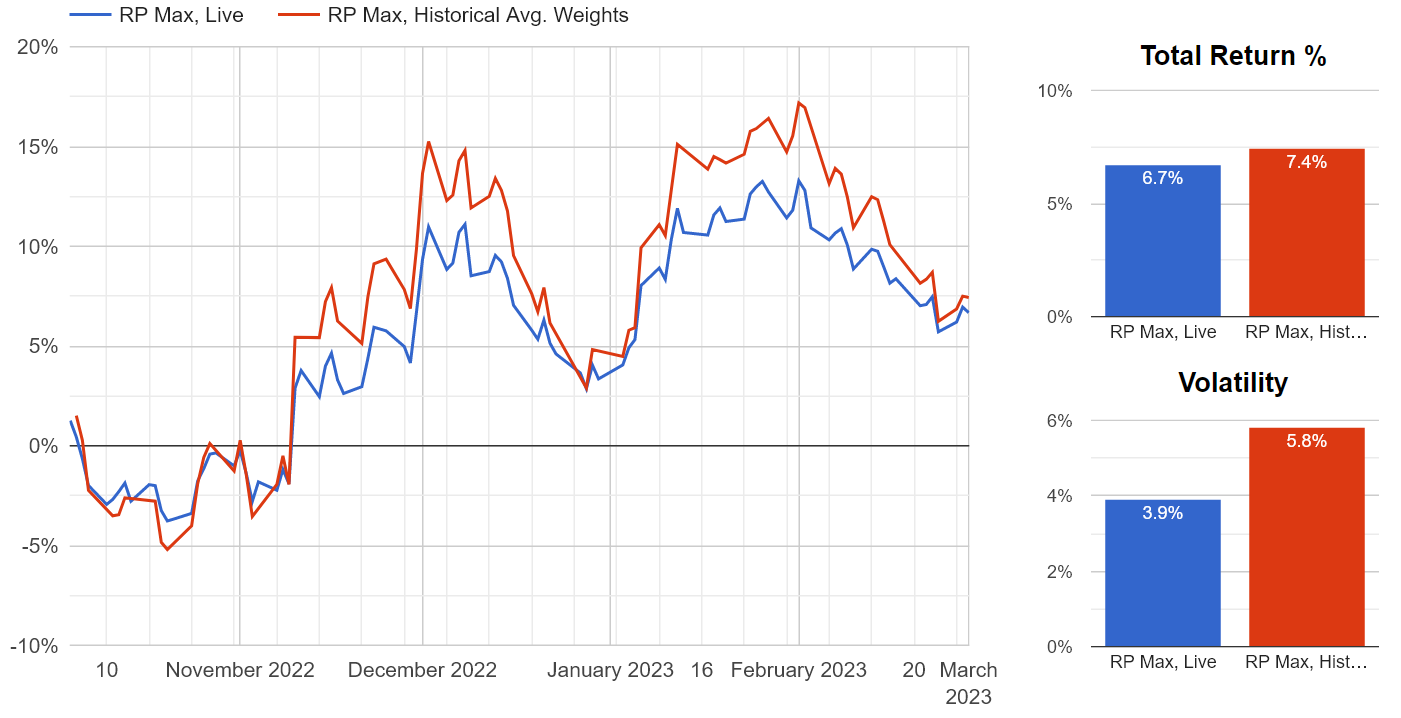
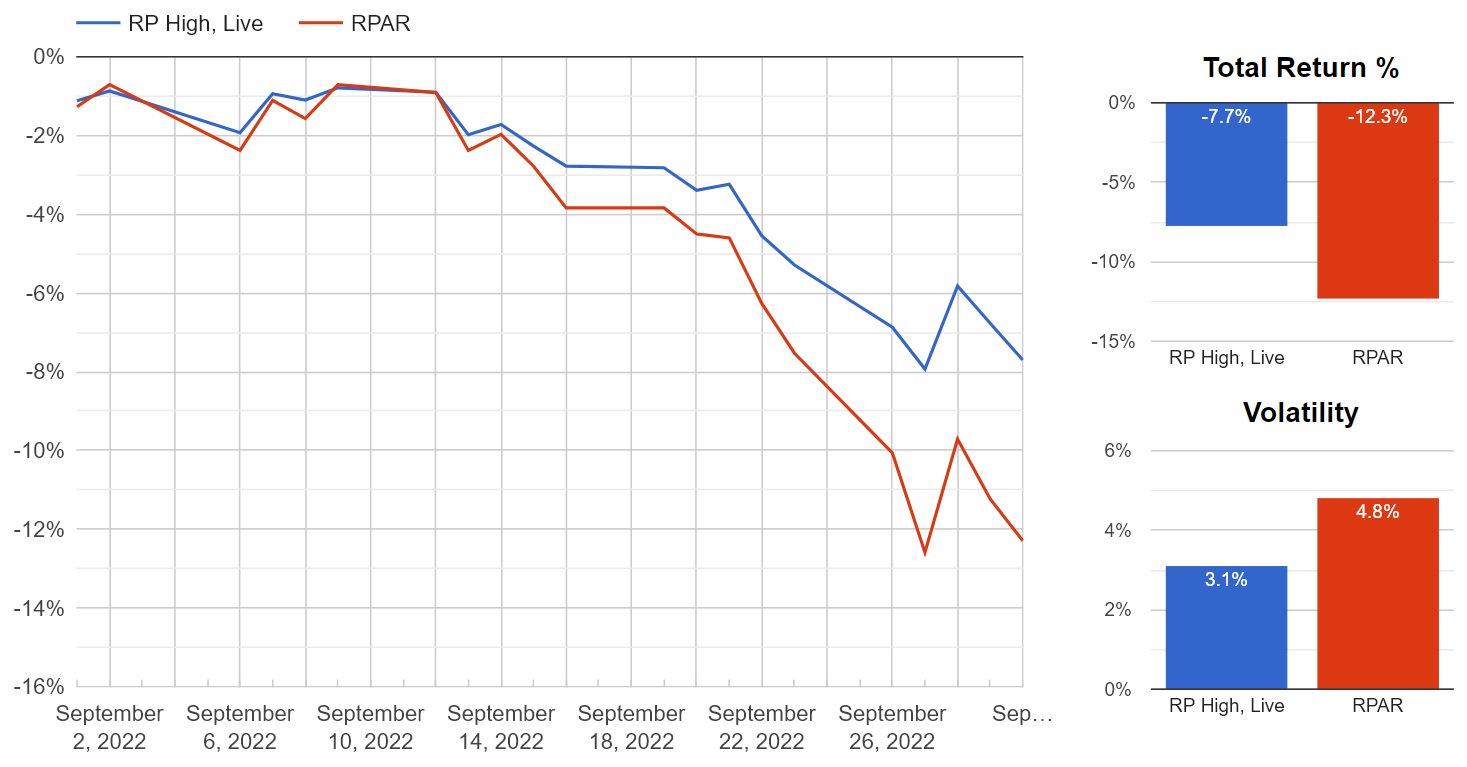
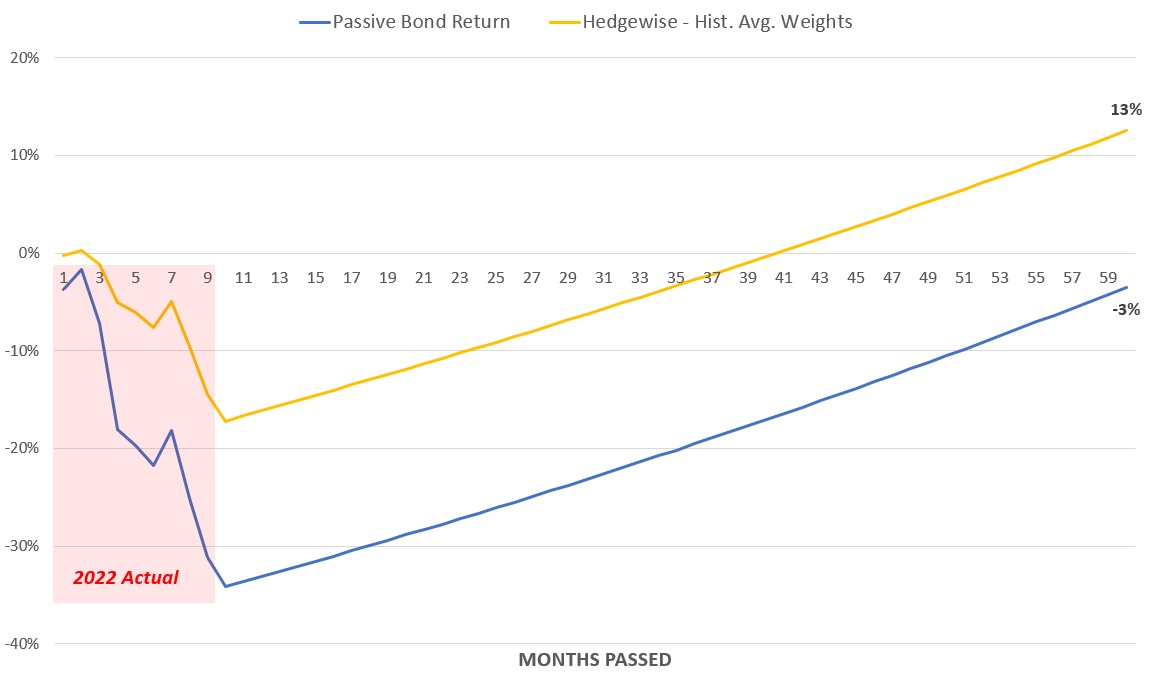
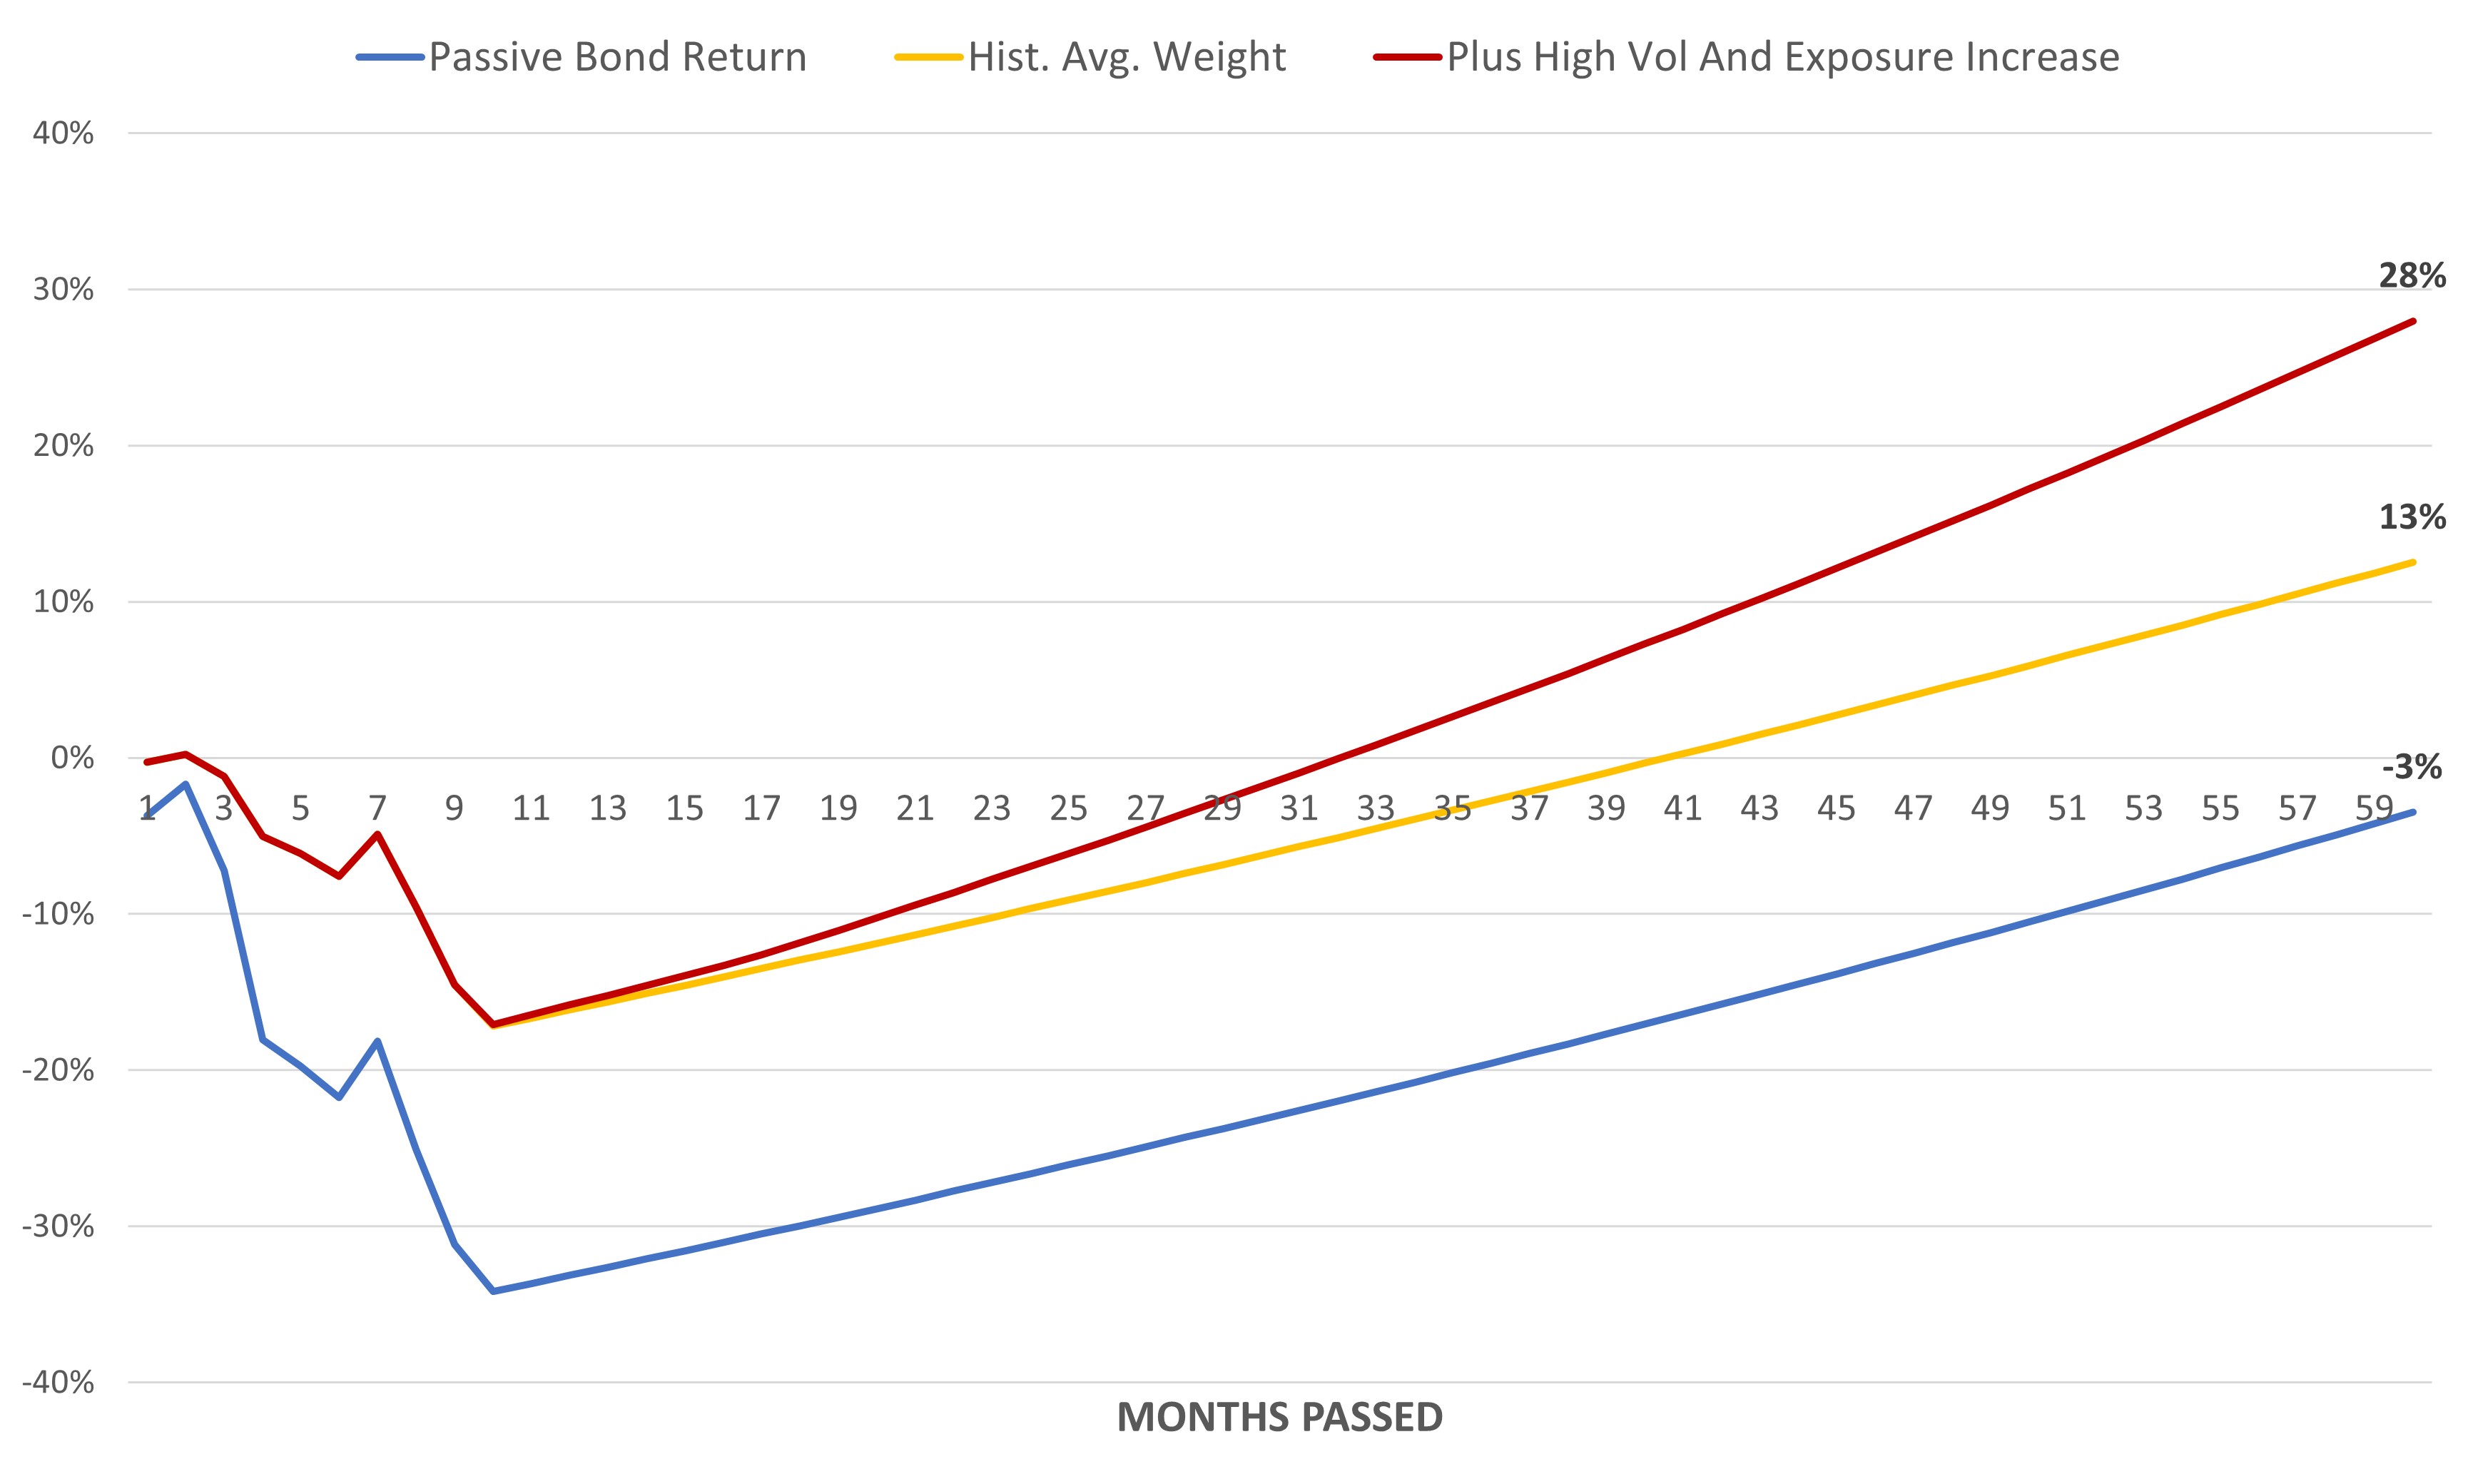
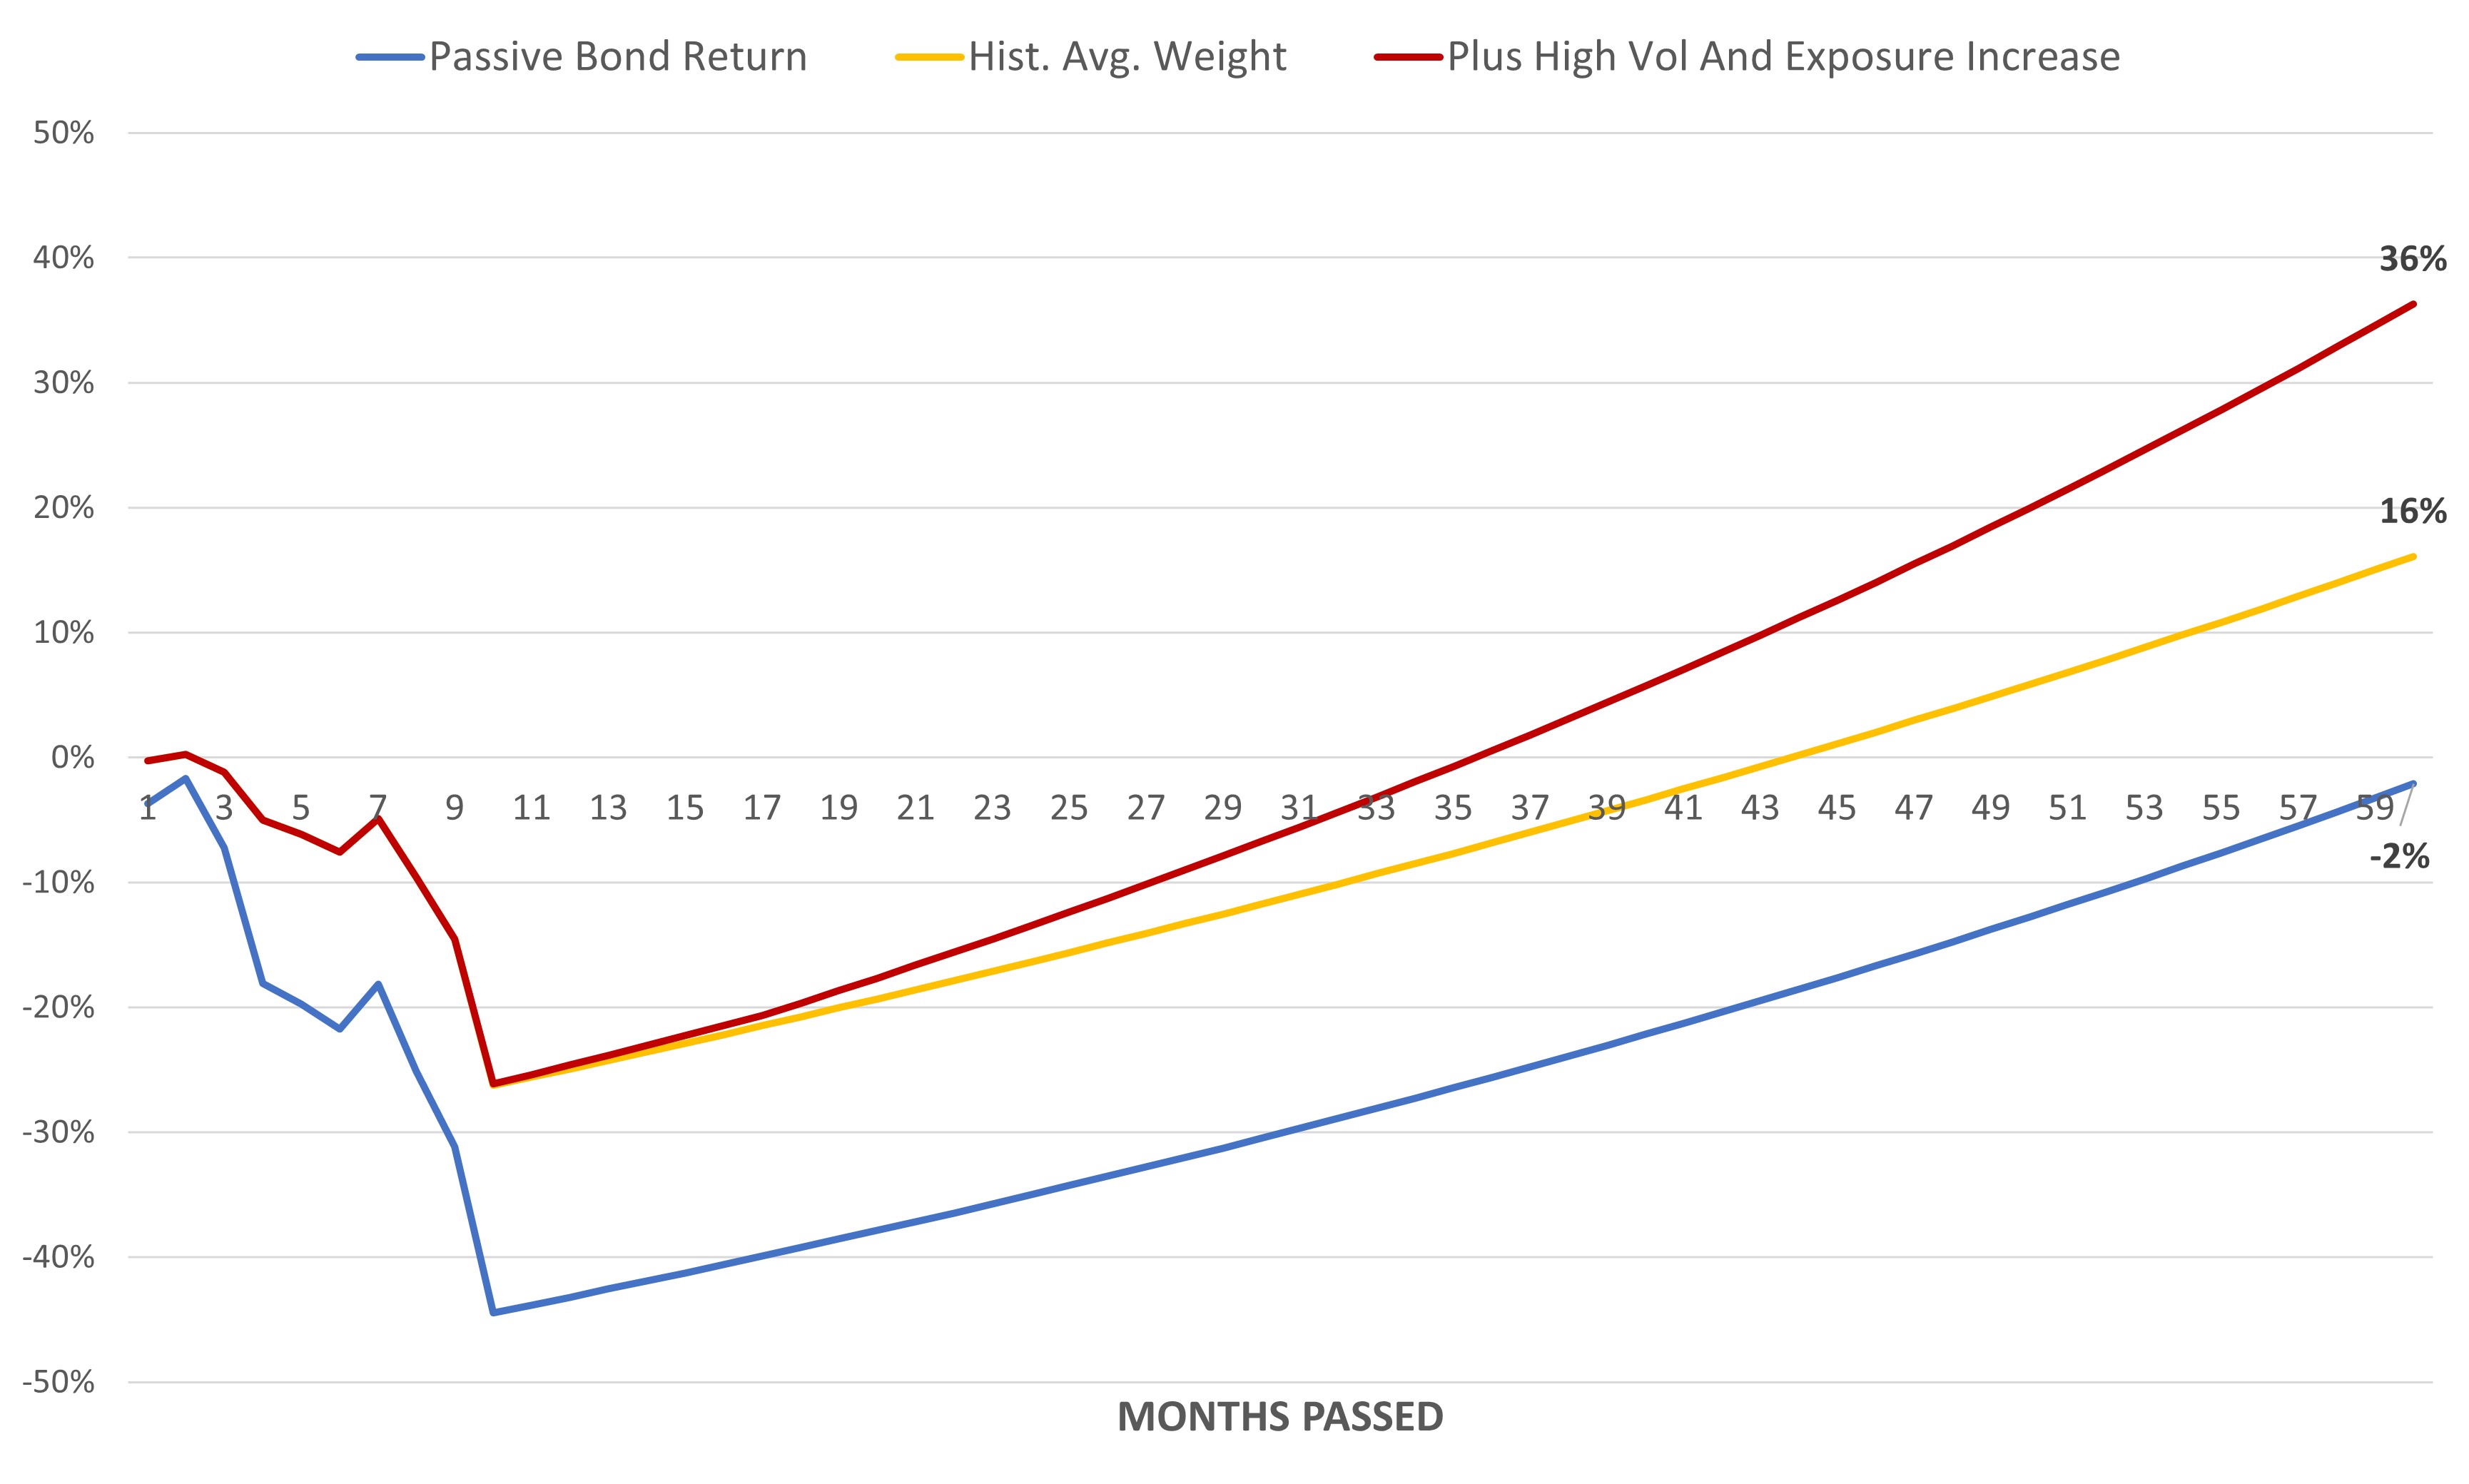
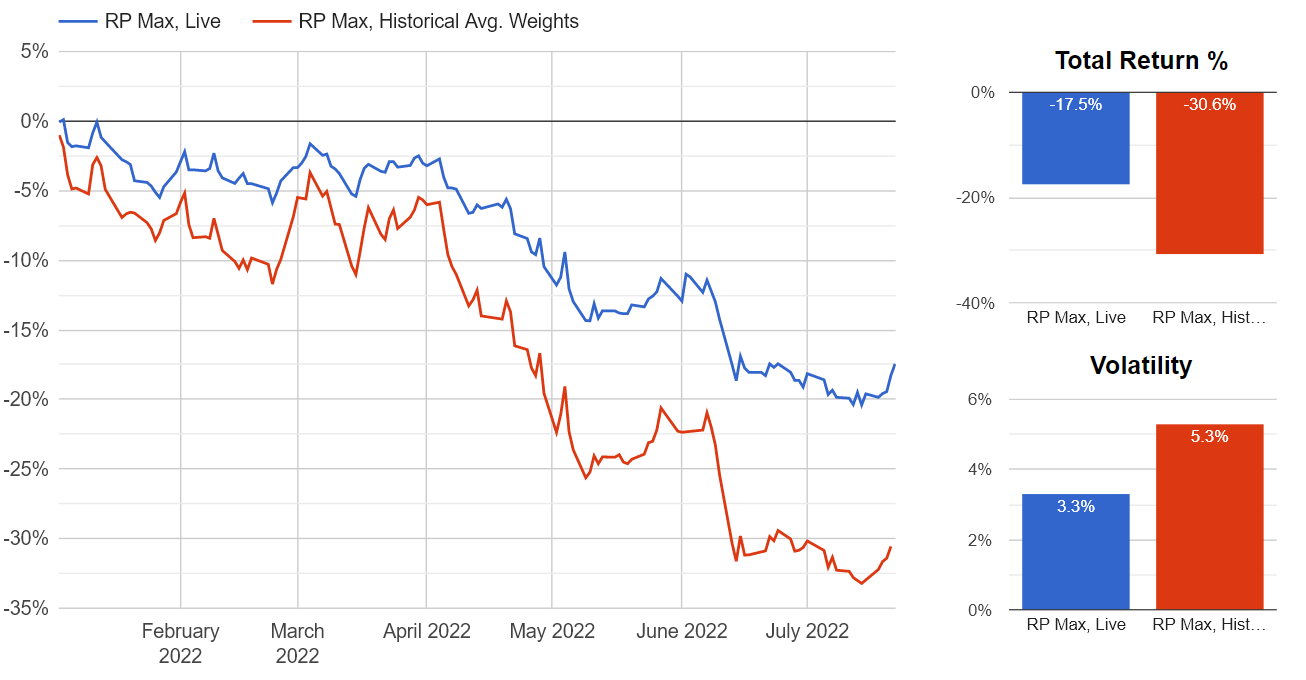
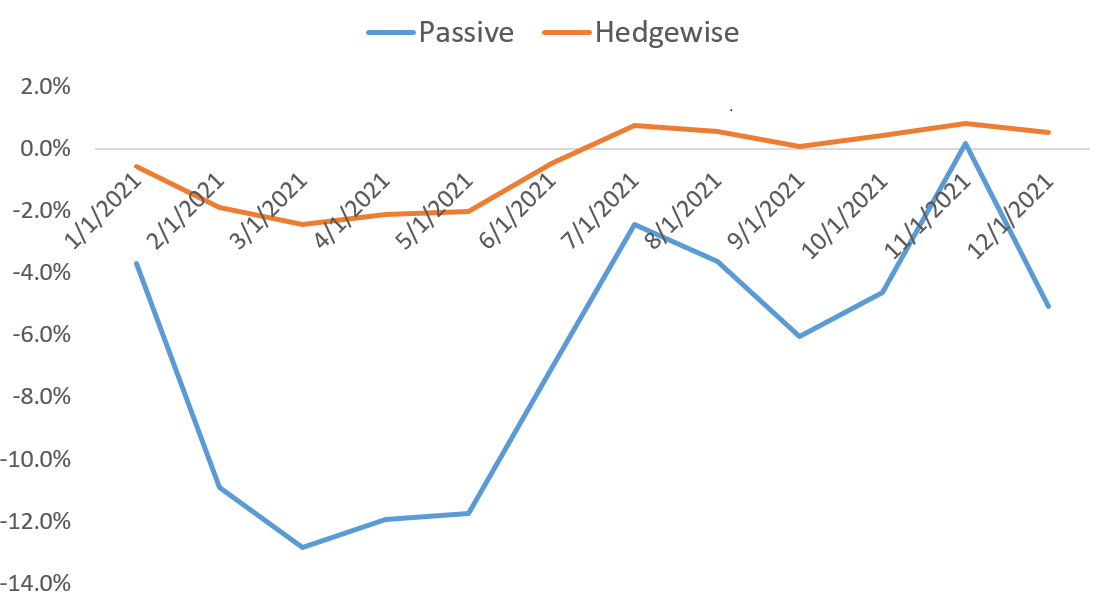
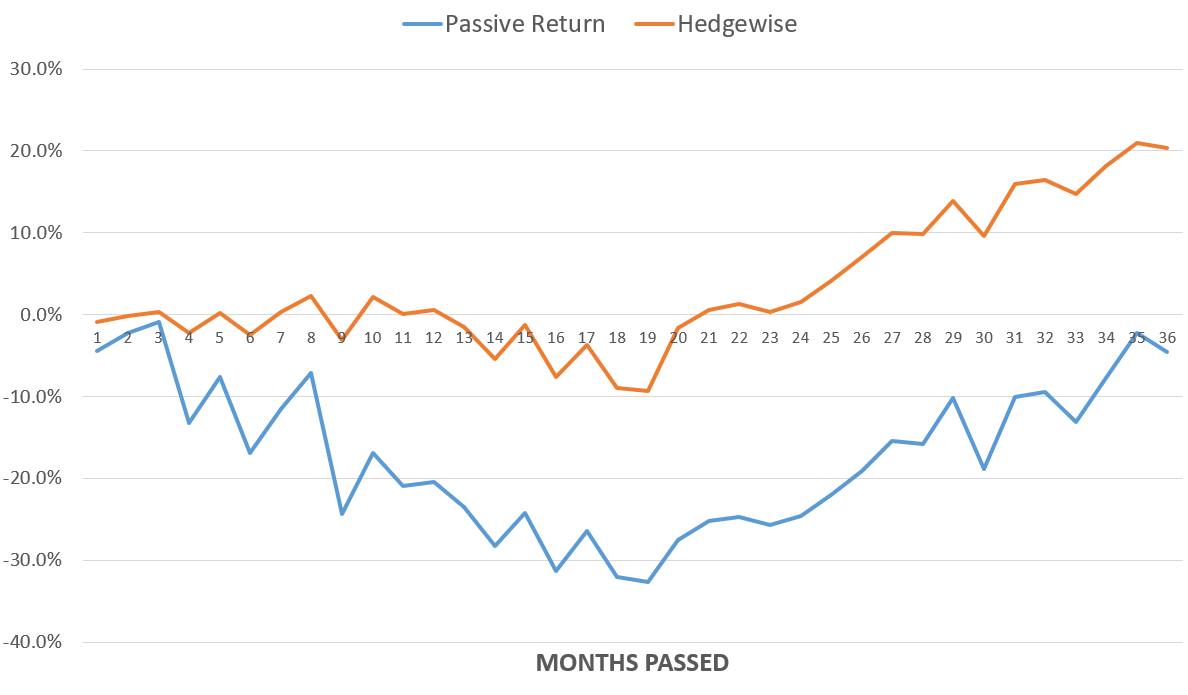
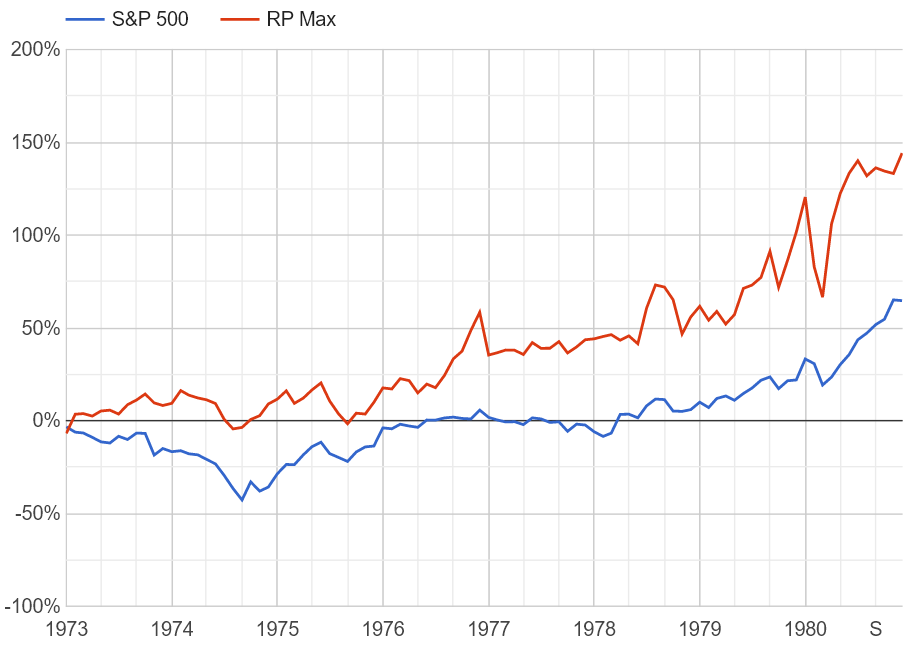
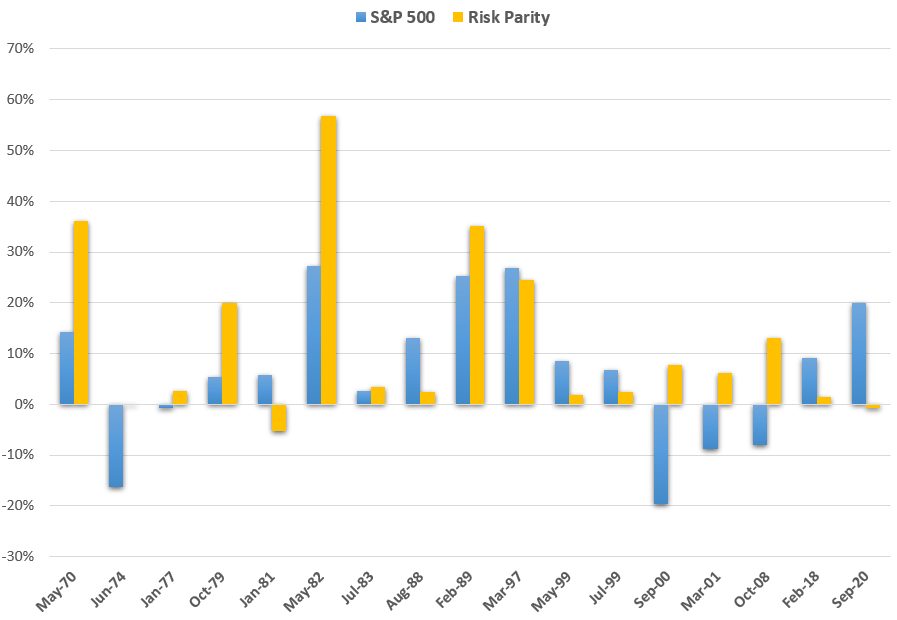
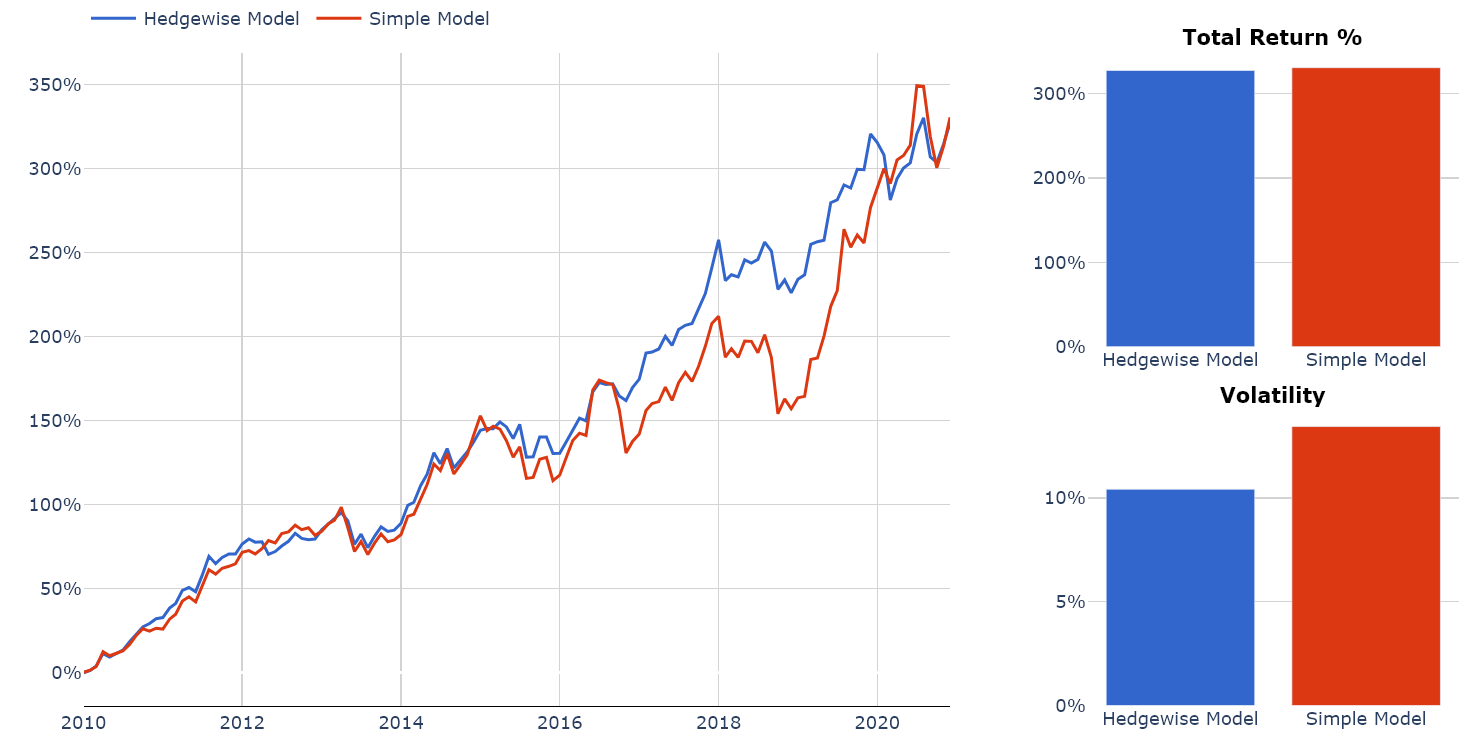
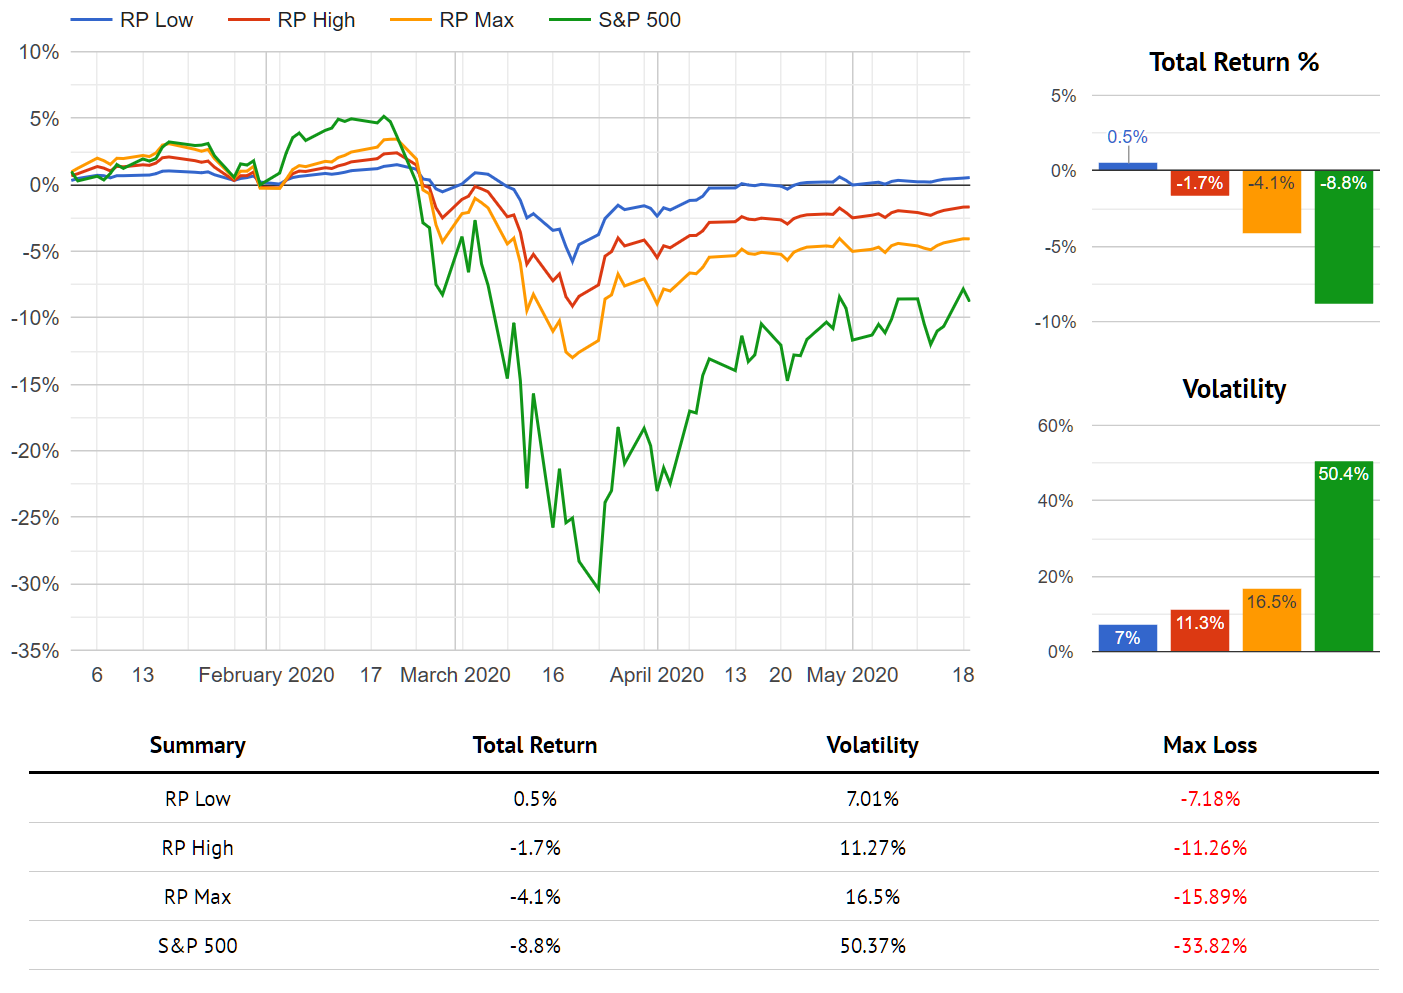
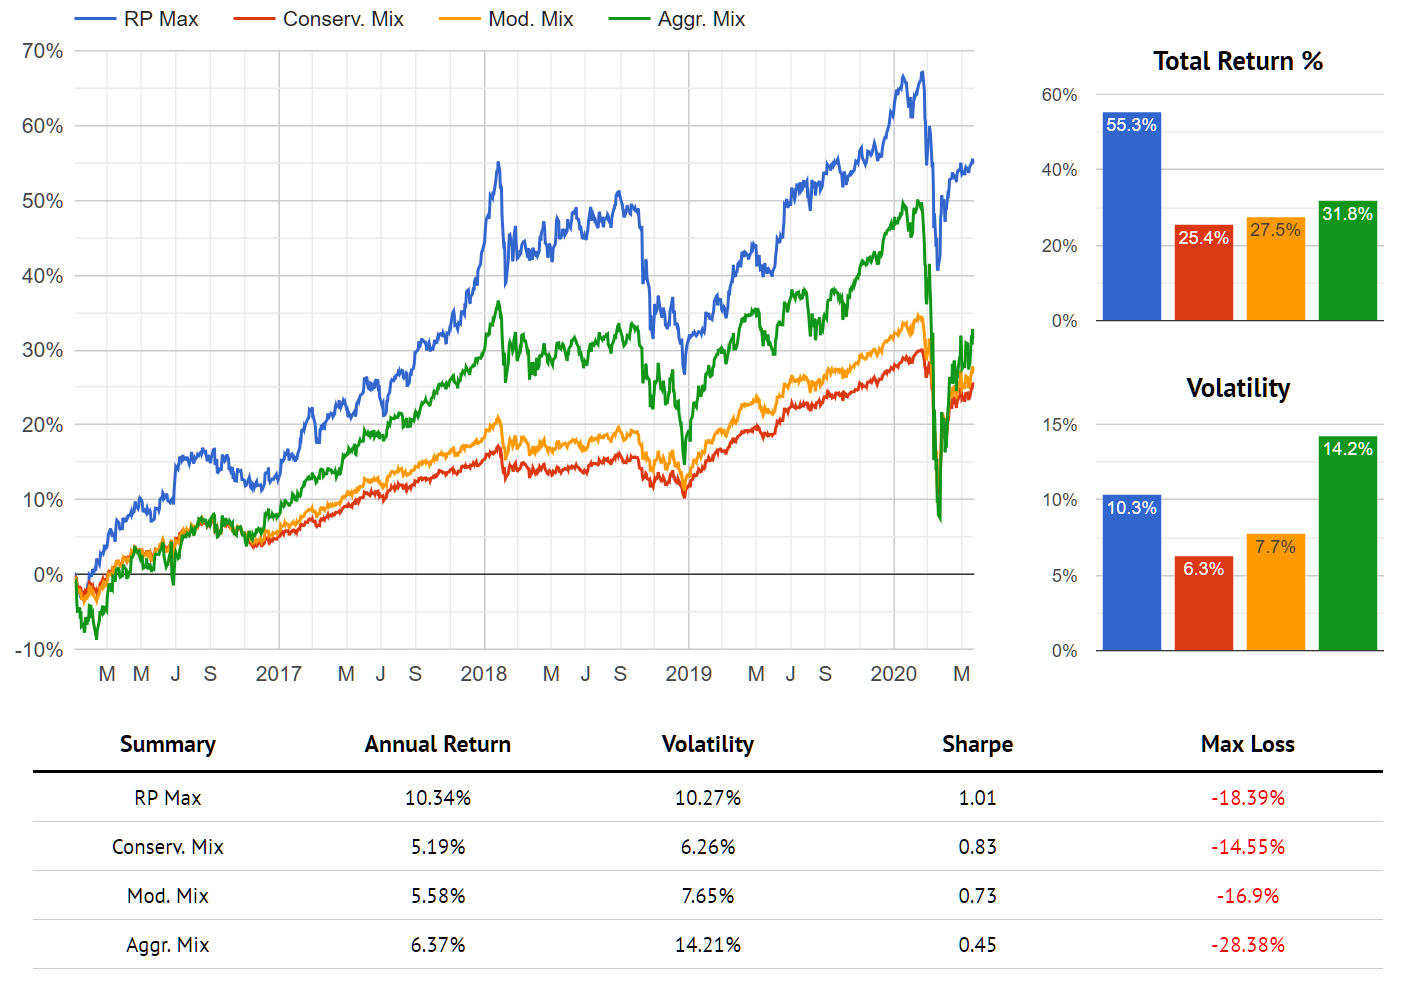
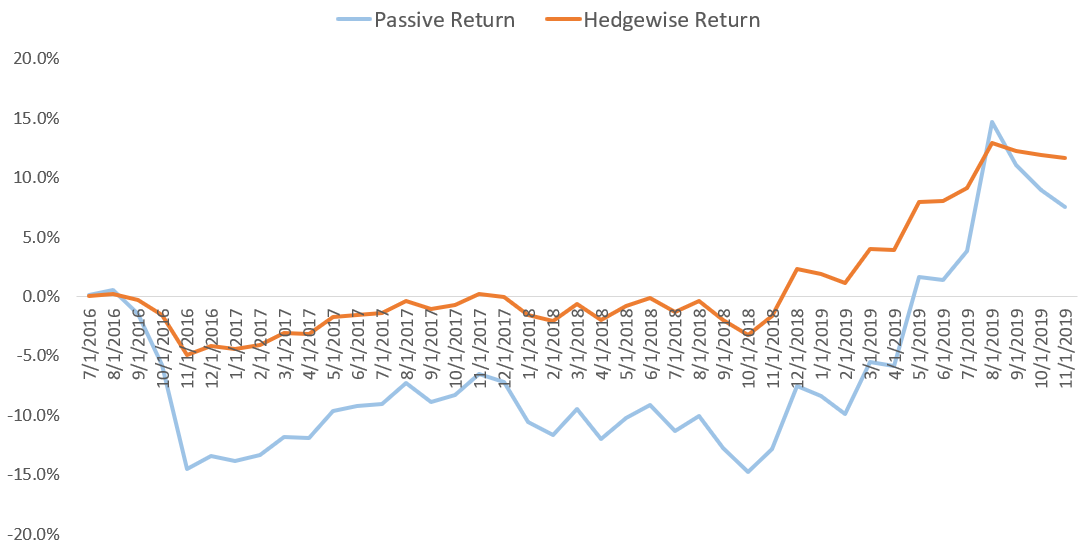
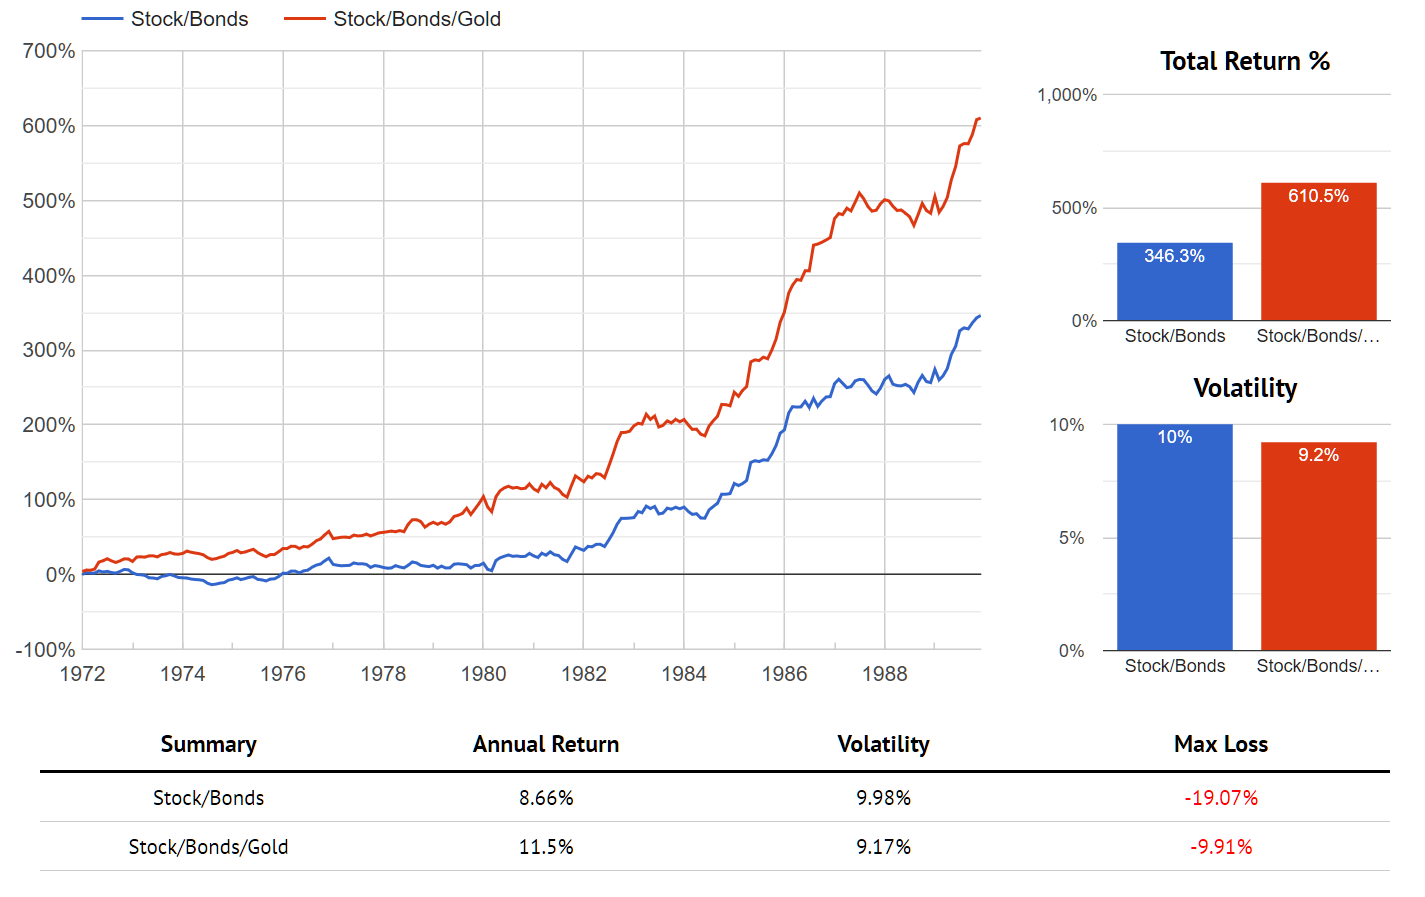
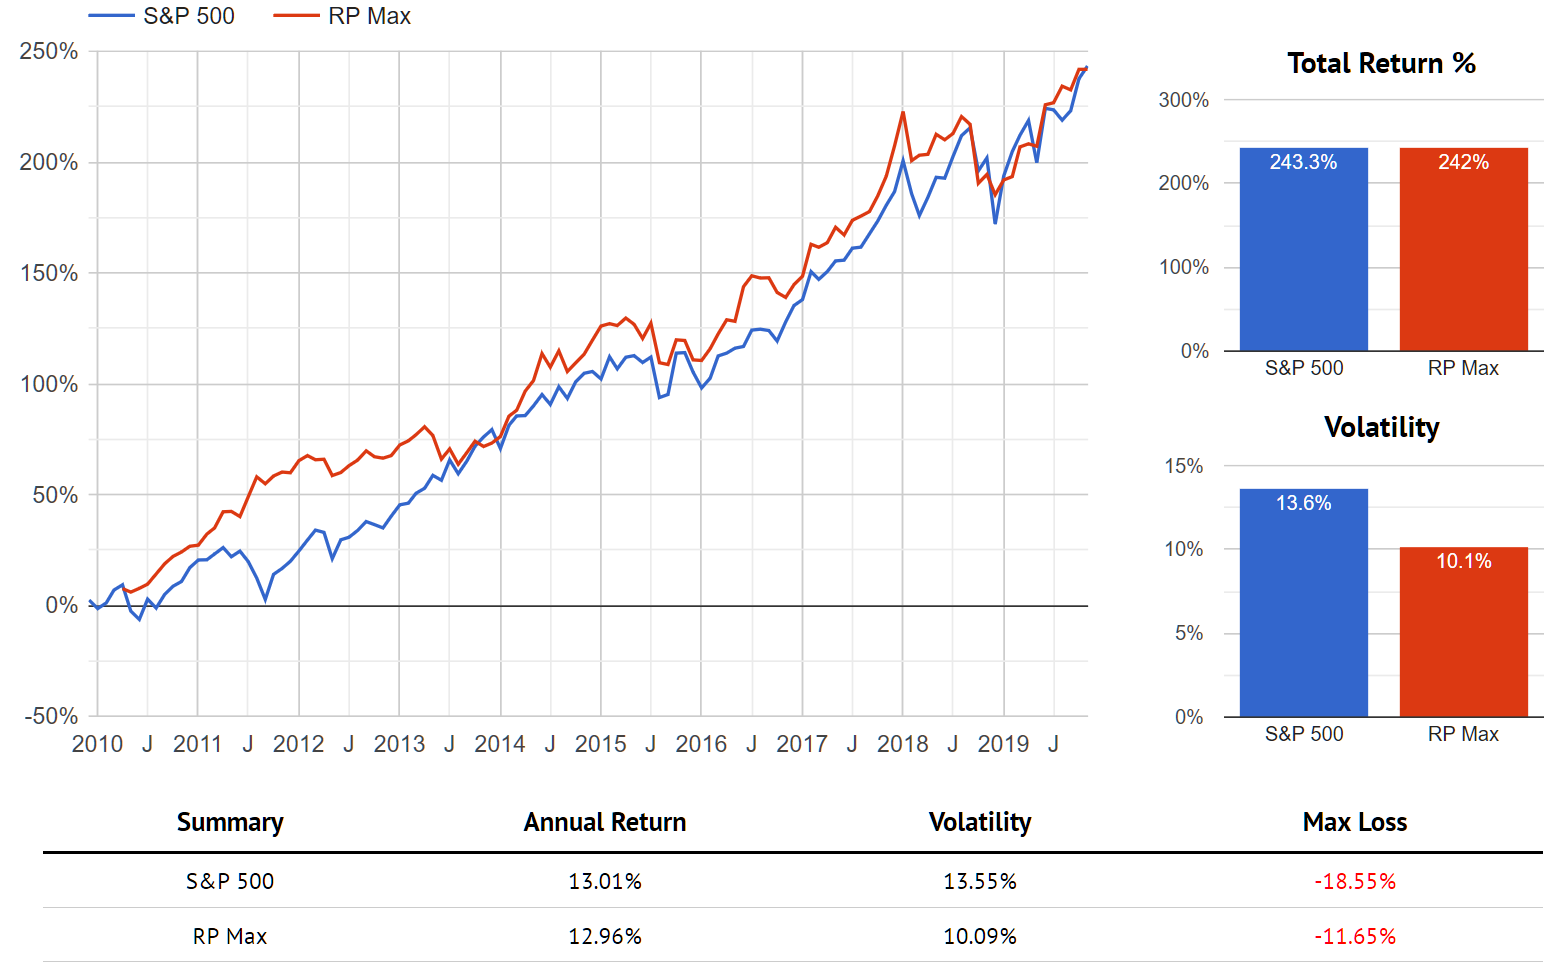
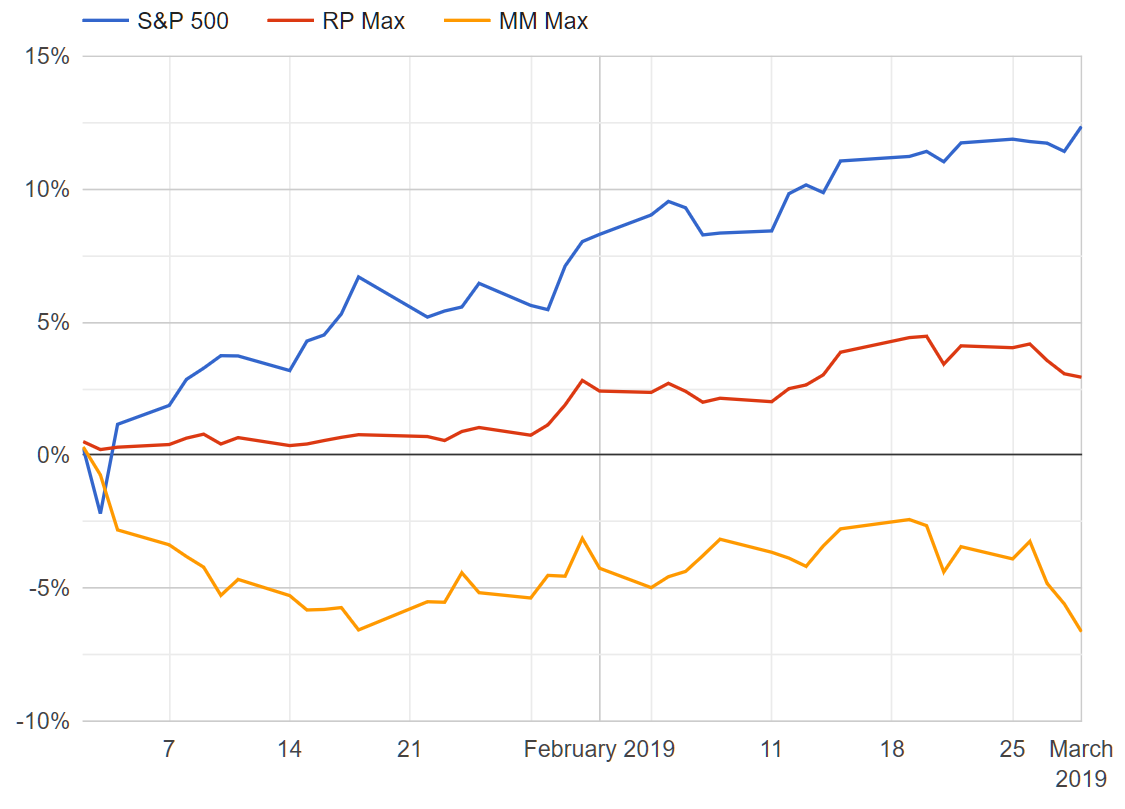
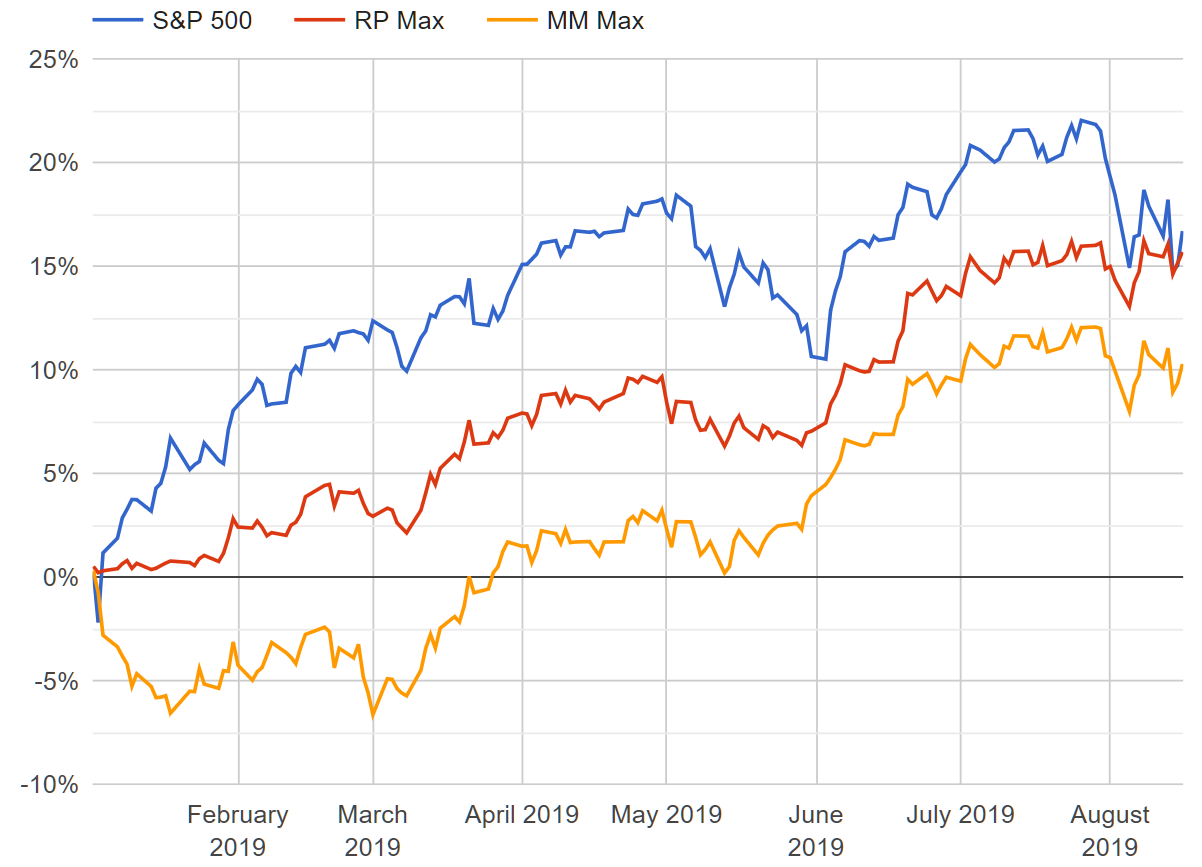
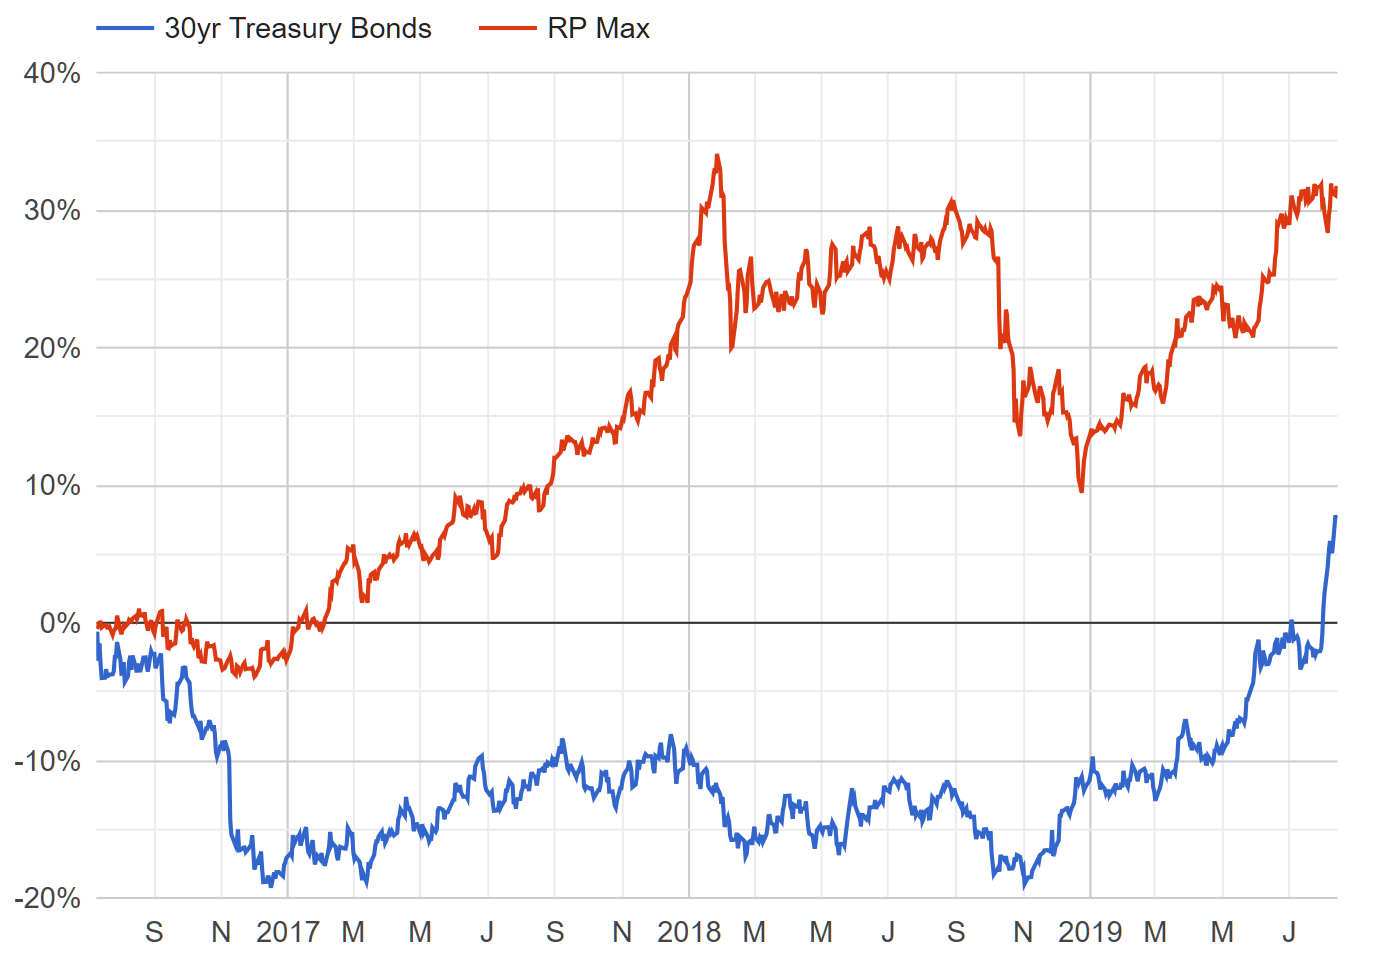
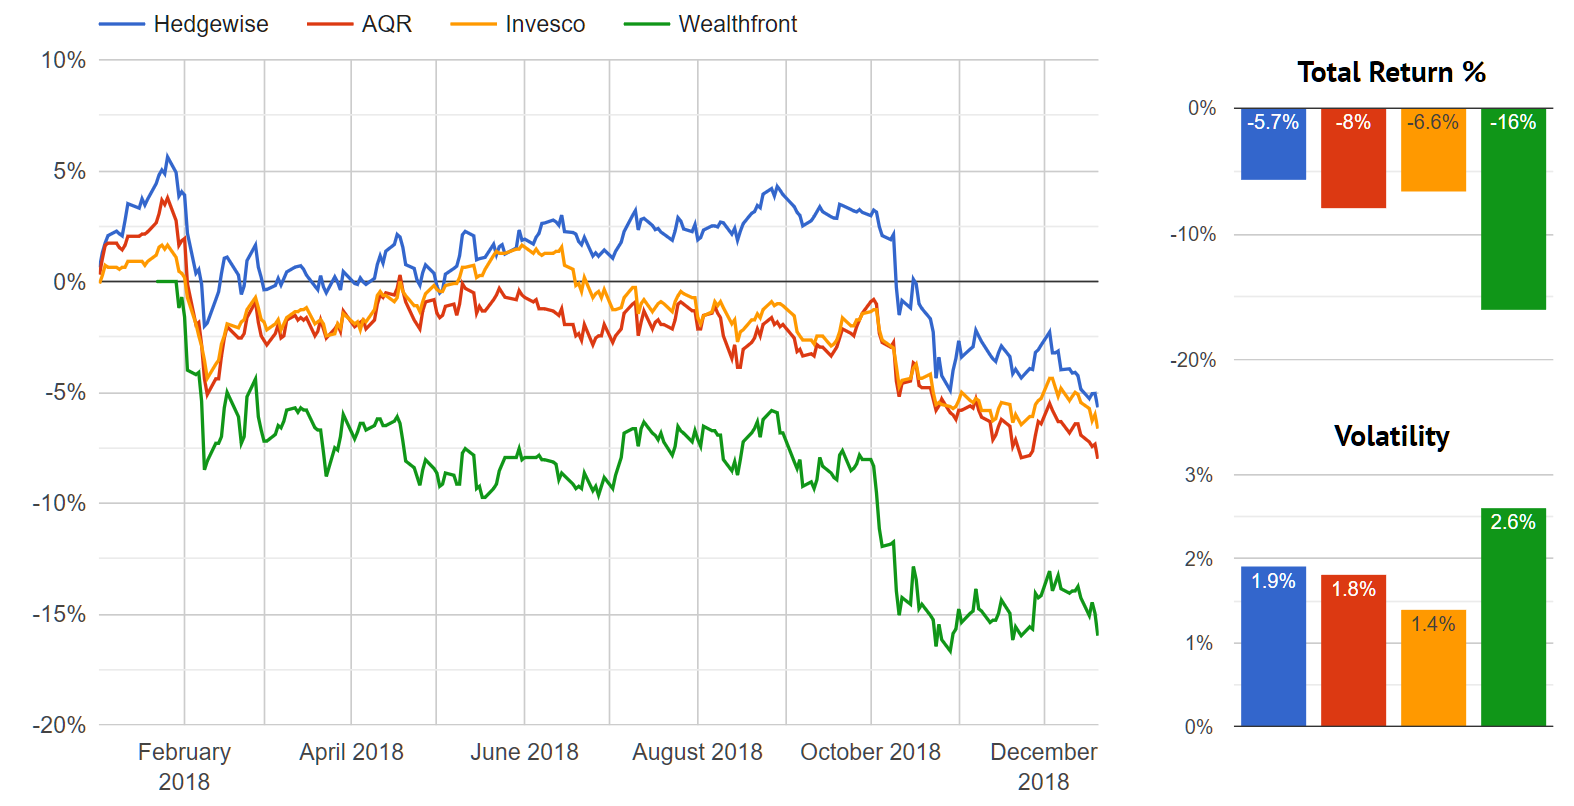
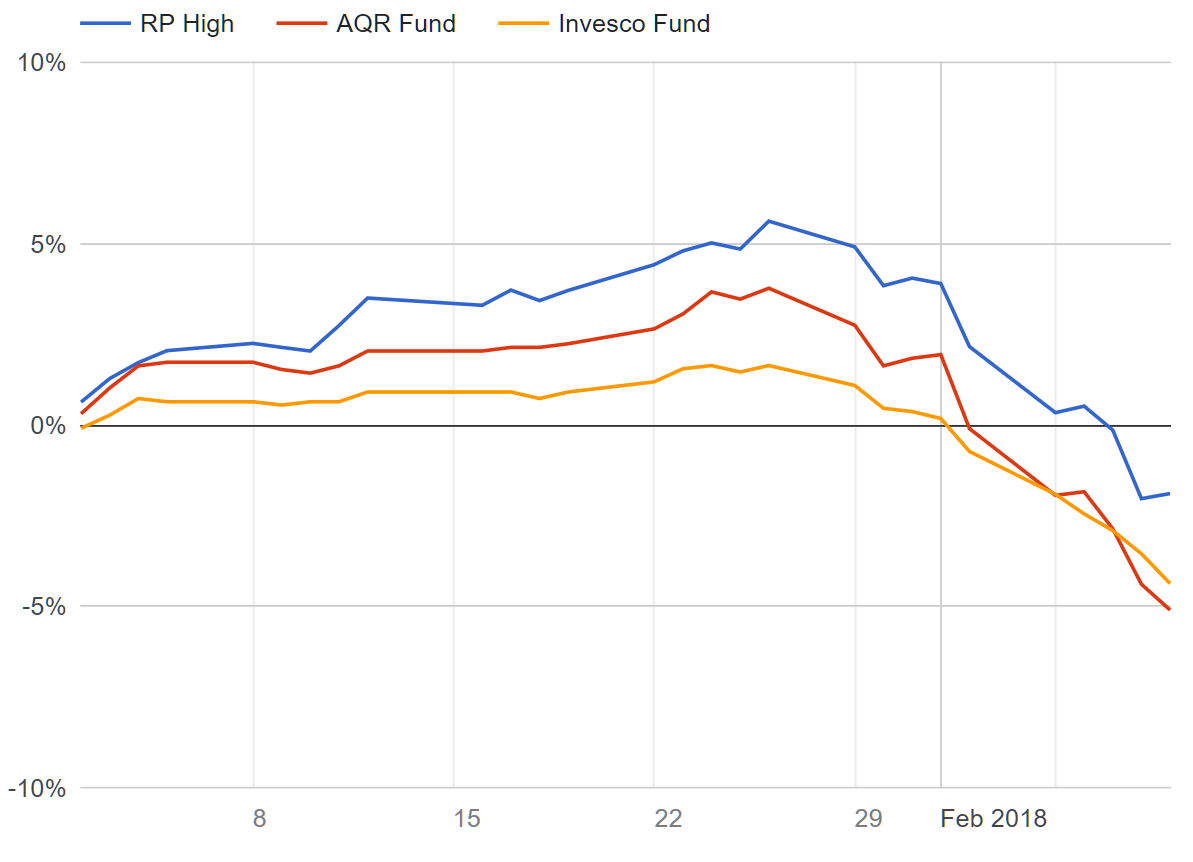
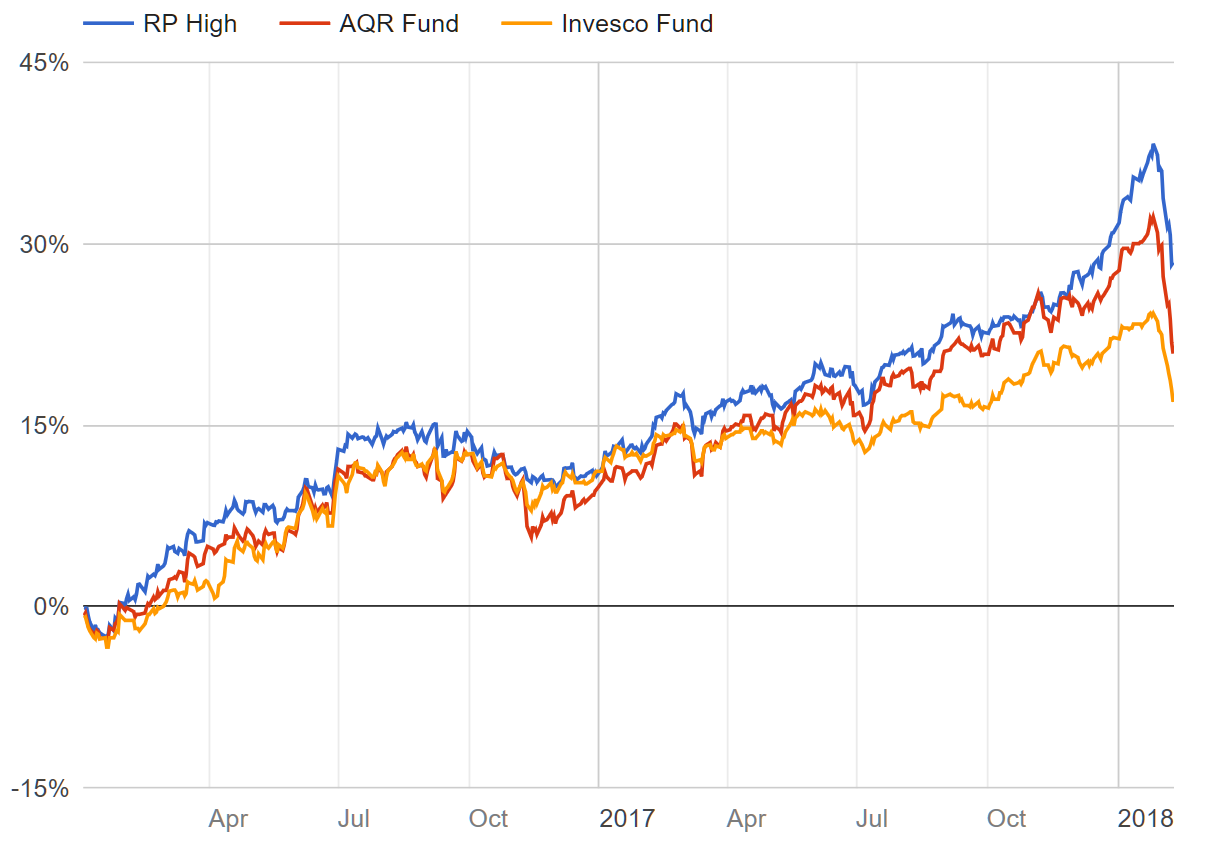
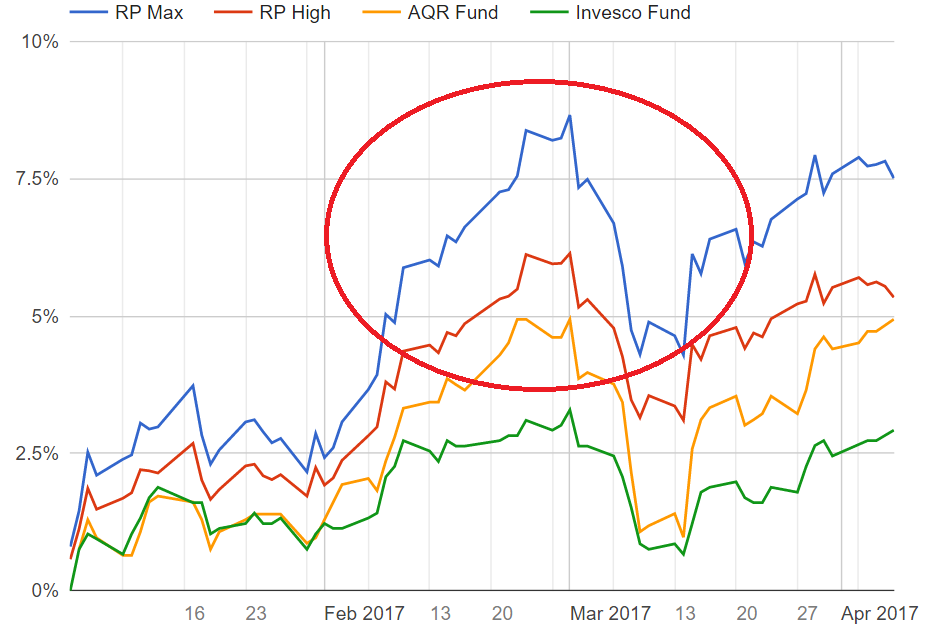
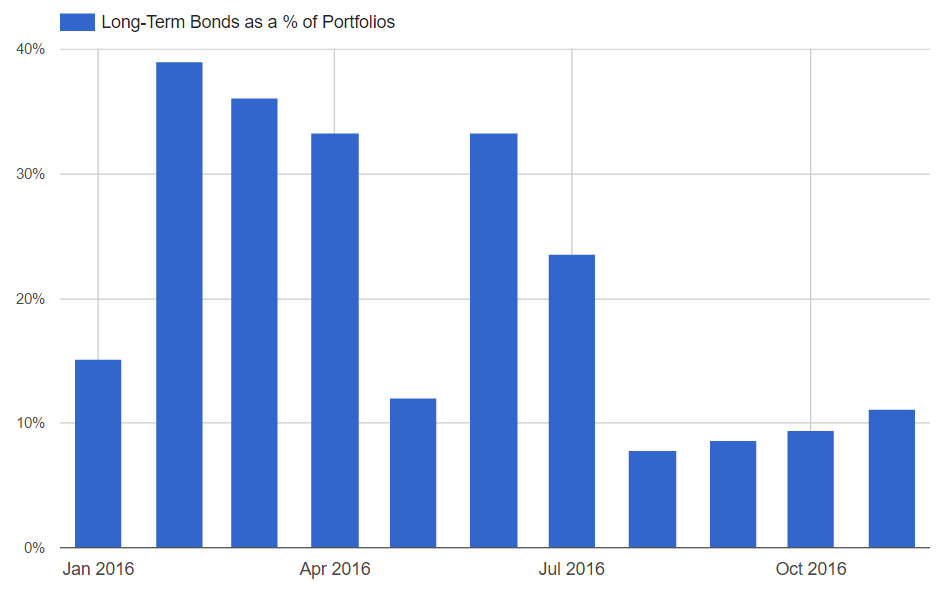
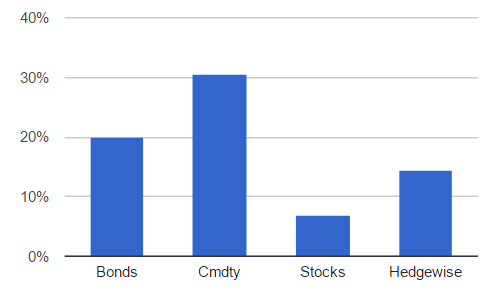
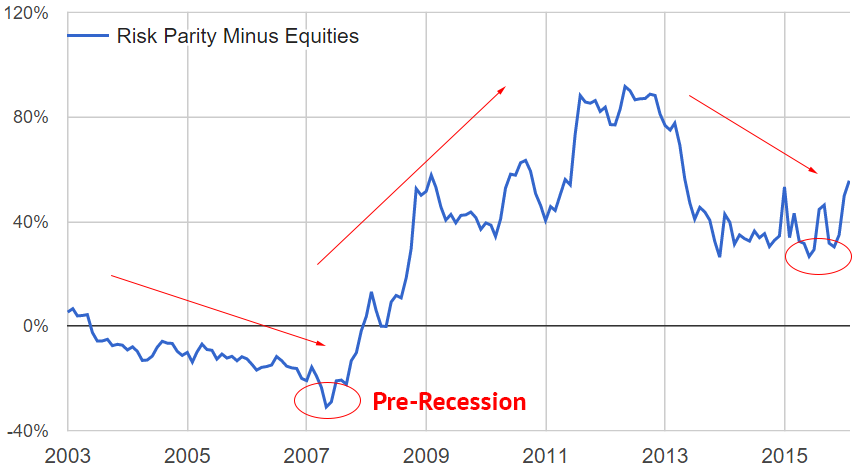
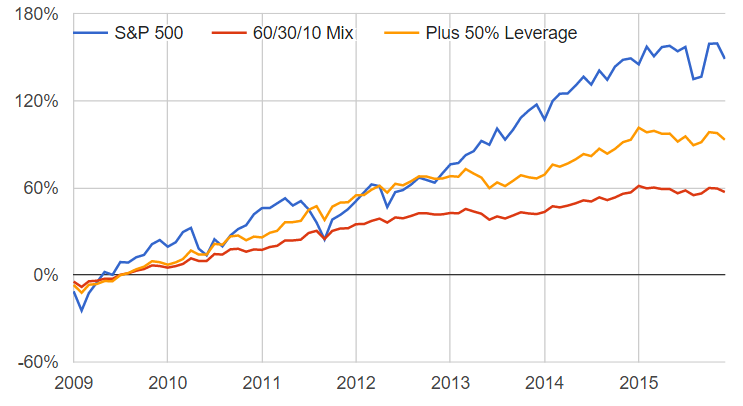
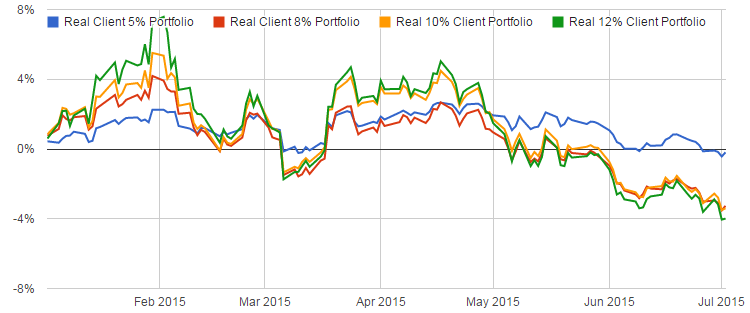
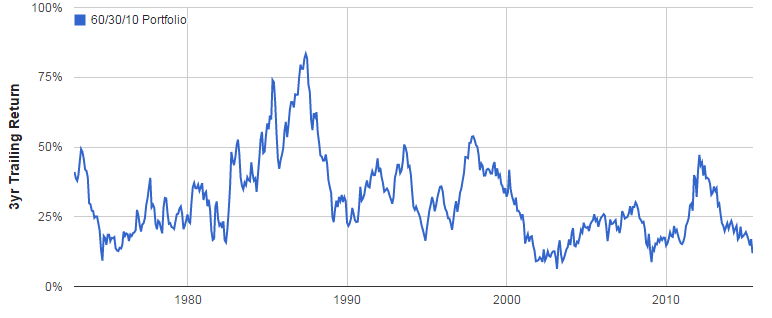
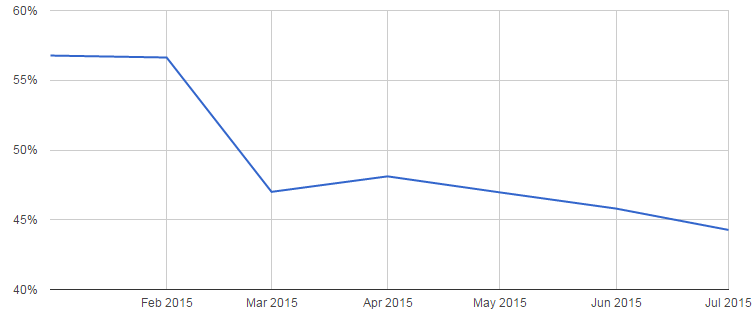
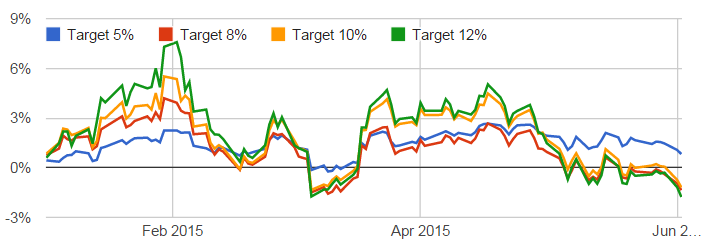
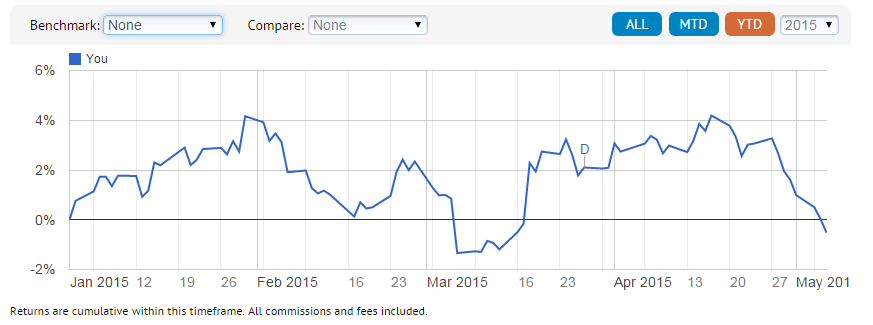
The easiest way to visualize this is to compare the live Hedgewise Risk Parity "Max" portfolio to a passive version of Risk Parity, which is represented in two ways in the following graph. The first is a model with simple static weights for each asset class based on historical averages, and the second is the live performance of the UPAR ETF, which is broadly similar.
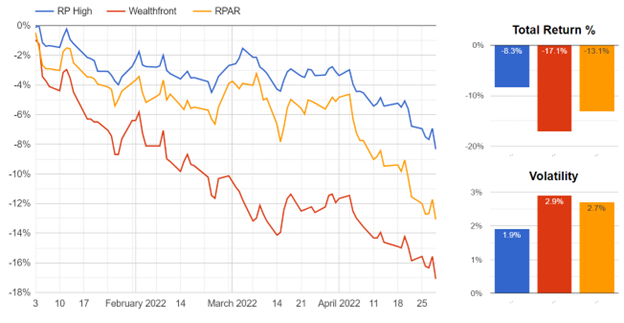
Hedgewise RP Max vs. Passive Risk Parity Benchmarks, 2022 to Present
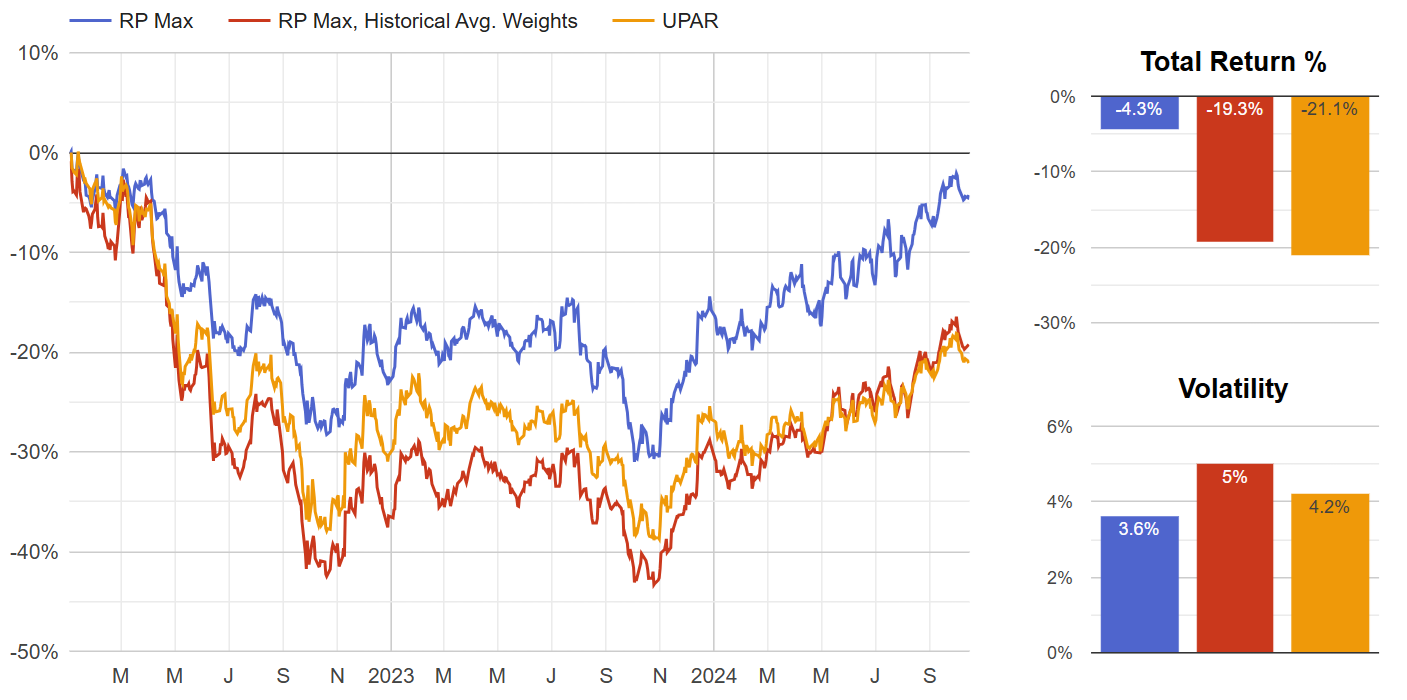
The Hedgewise portfolio is now just a few percent from breakeven despite losses of closer to 20% in the passive benchmarks. On a relative basis, this is a fantastic outcome, especially given it was driven purely by systematic risk management. Imagine if you could beat the S&P 500 by 20% every few years with no downside! This is essentially what Hedgewise has accomplished viz-a-viz Risk Parity. But it is important to acknowledge that it has not yet 'felt' very successful because the underlying strategy remains underwater. Of course, this also means that the underlying assets remain incredibly cheap.
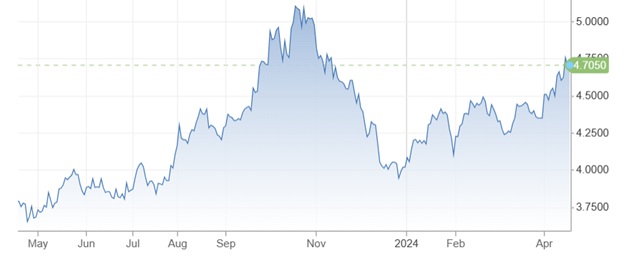
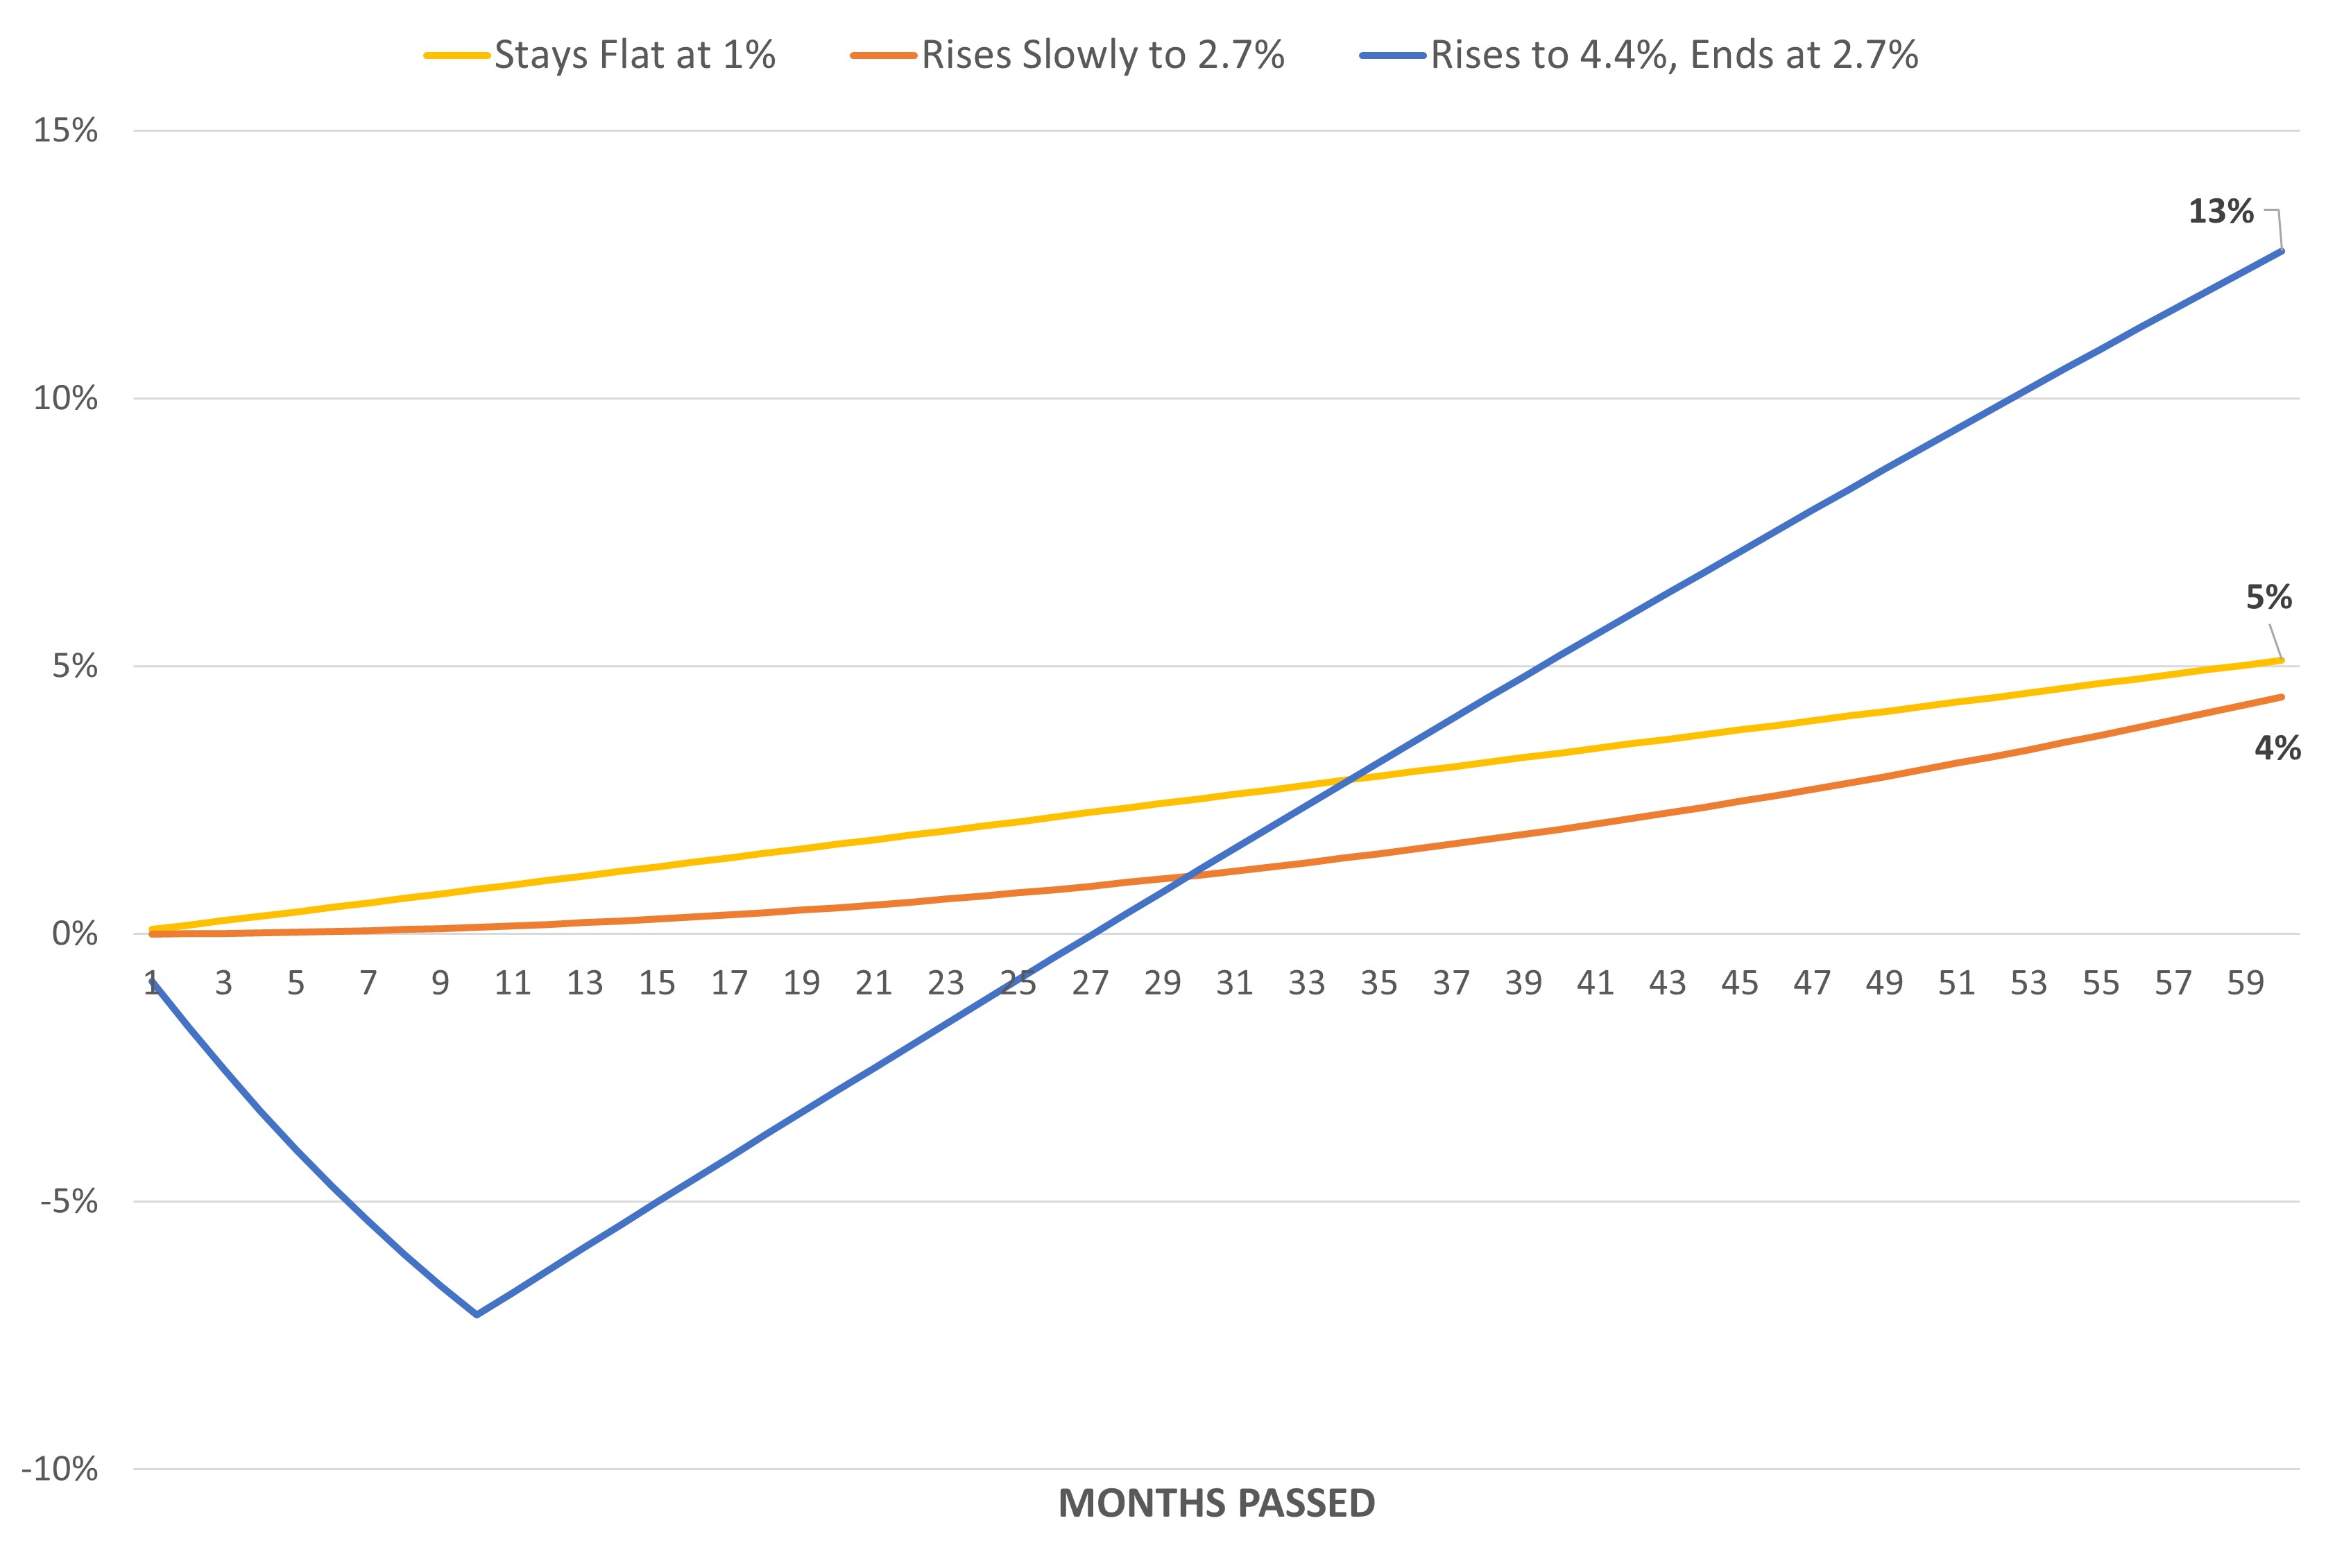
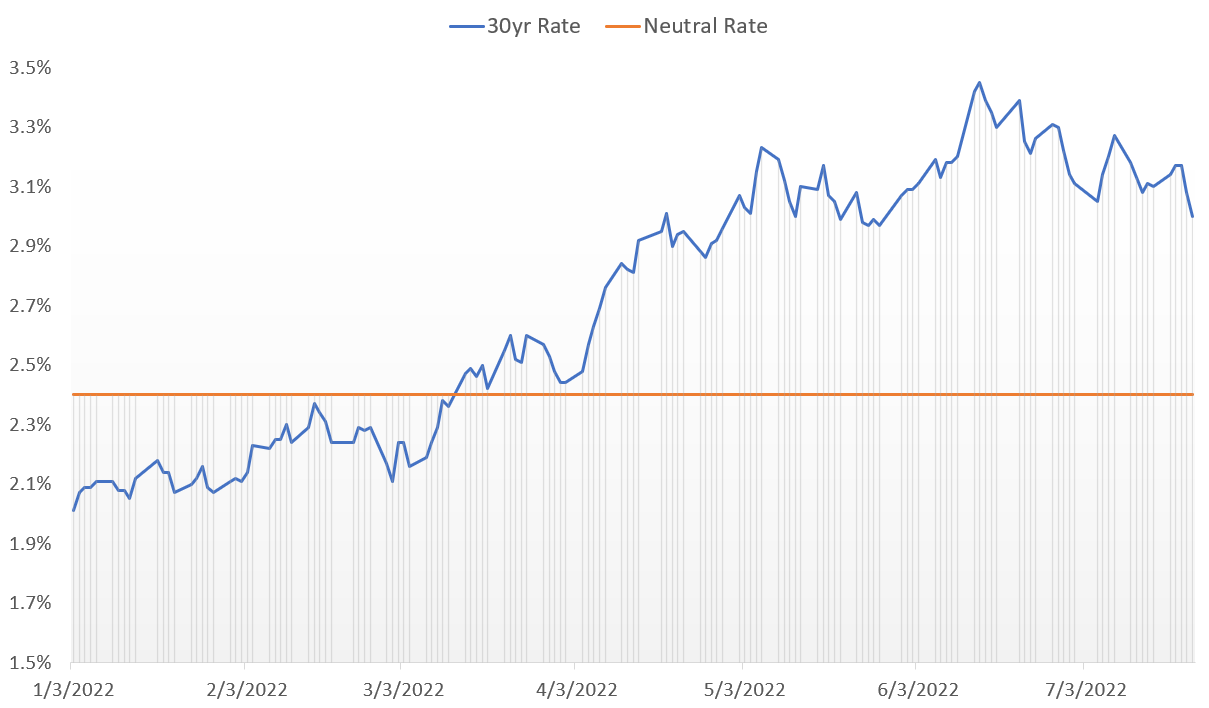
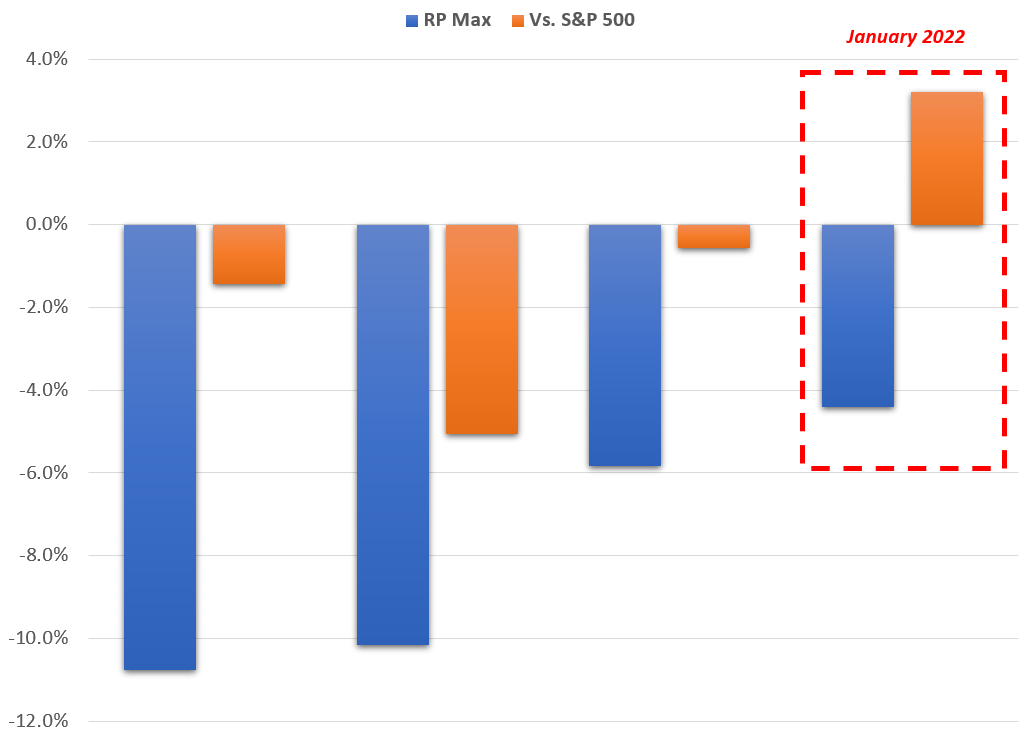
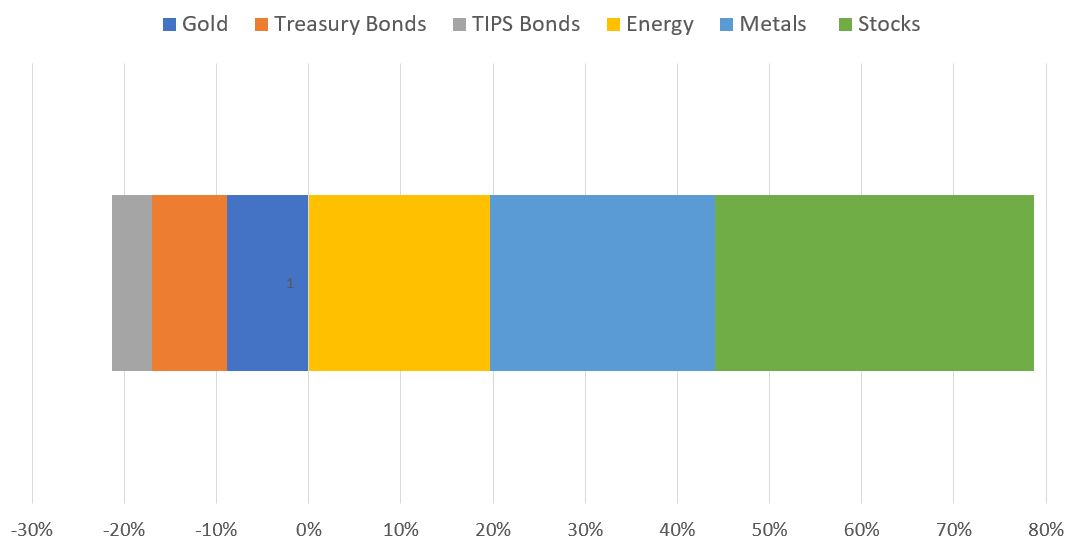
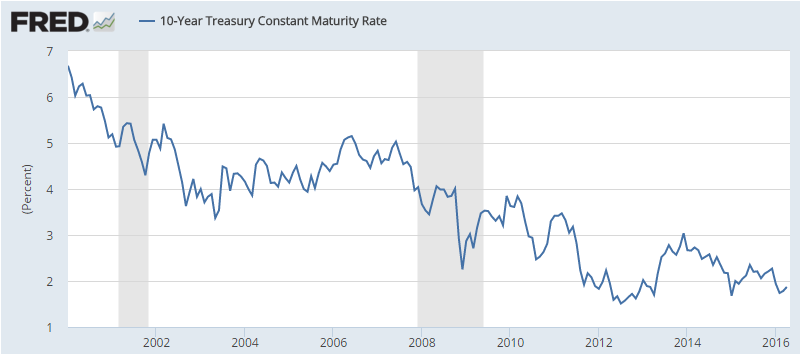
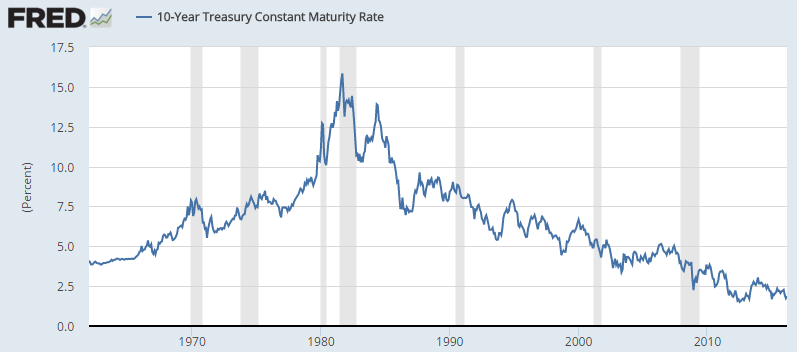
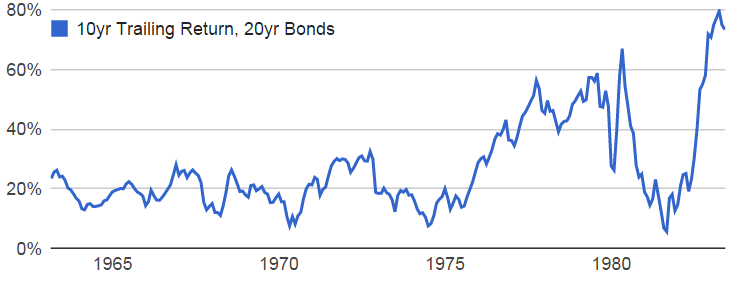
Recall that Risk Parity in its passive form is not complicated - it is something like 50% equities, 80% bonds, and 30% commodities (which implies about 60% leverage for the portfolio). The current drawdown persists primarily because bonds are still down over 30% since January 2022, with yields rising from 2% to over 4.4% today. The takeaway may seem like this entire stretch was a bad time to invest in Risk Parity, but that's not true. For example, the following table shows returns for the RP Max strategy at various entry points over this time.
Hedgewise RP Max Returns, Various Entry Points Since 2022
| Start Date | RP Max Return |
|---|---|
| January 2022 | -4.3% |
| June 2022 | 9.5% |
| October 2022 | 31.4% |
| June 2023 | 19.1% |
| January 2024 | 13.8% |
Any client that added funds or increased their risk level after the initial drawdown in January 2022 has now made a healthy return. While it is easy to get hung up on how to have maximized this - obviously October 2022 was a better entry point than June - the more important takeaway is that it has all been a good investment even though rates continued rising for much of this stretch. It hasn't been necessary for bonds to recover or for yields to plateau to achieve solid returns.
This is because Risk Parity is not about a single asset class, but all of them together. A drawdown of this diversified mix, no matter the cause, almost always represents an excellent investment opportunity, and that has been the case for the past two years as well.
What is most striking about the prior numbers is that we are not even far along the expected recovery path. Yields are still at 4.4%, and the net underlying asset prices are still cheap. In the next 12 to 24 months, an additional 25% gain is a reasonable expectation, and there are many economic pathways to achieve it.
The Many Paths to Another 25%
On a basic level, the math is easy. As shown in the first graph, the passive Risk Parity portfolio remains down around 20% since January 2022. For that to get back to breakeven, it would need to gain 25% from here (i.e., 0.8*1.25=1). Hedgewise has been regularly outperforming this passive portfolio since that date and should continue to do so. As more time elapses, it becomes fundamentally more likely that this recovery will occur.
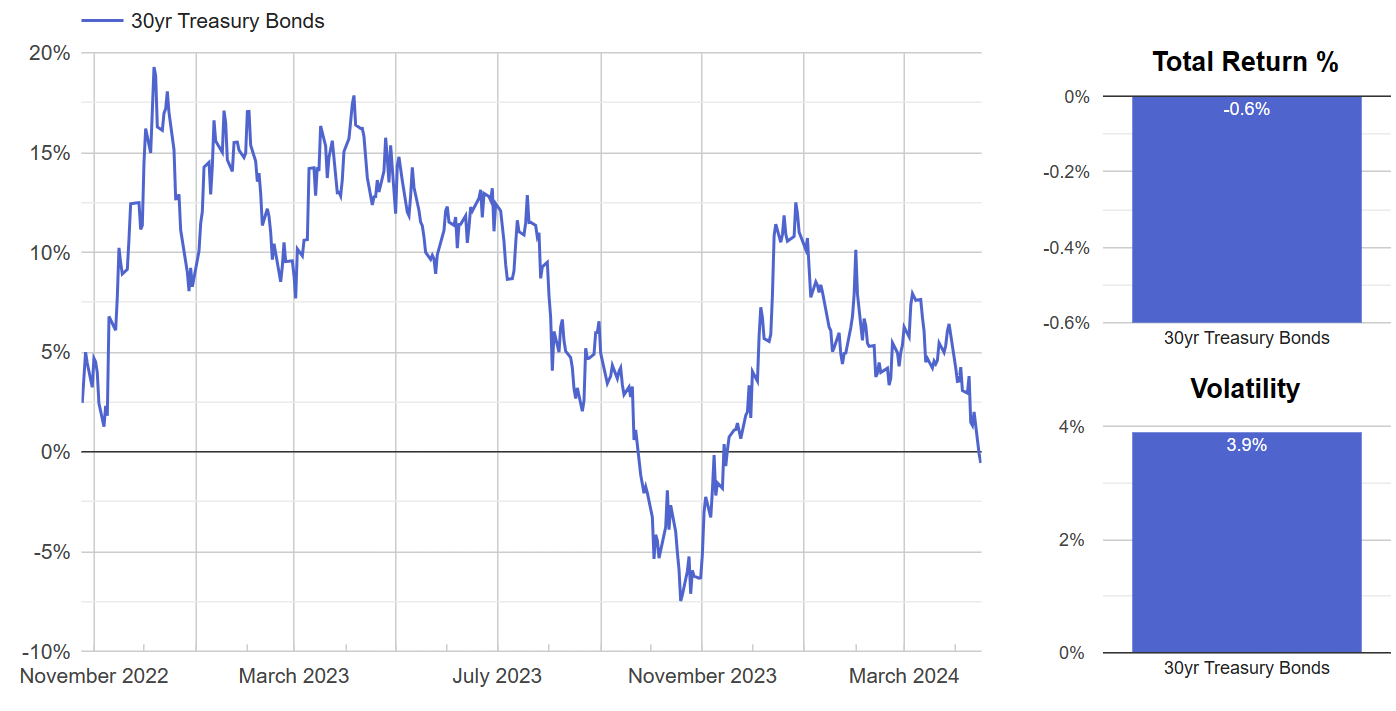
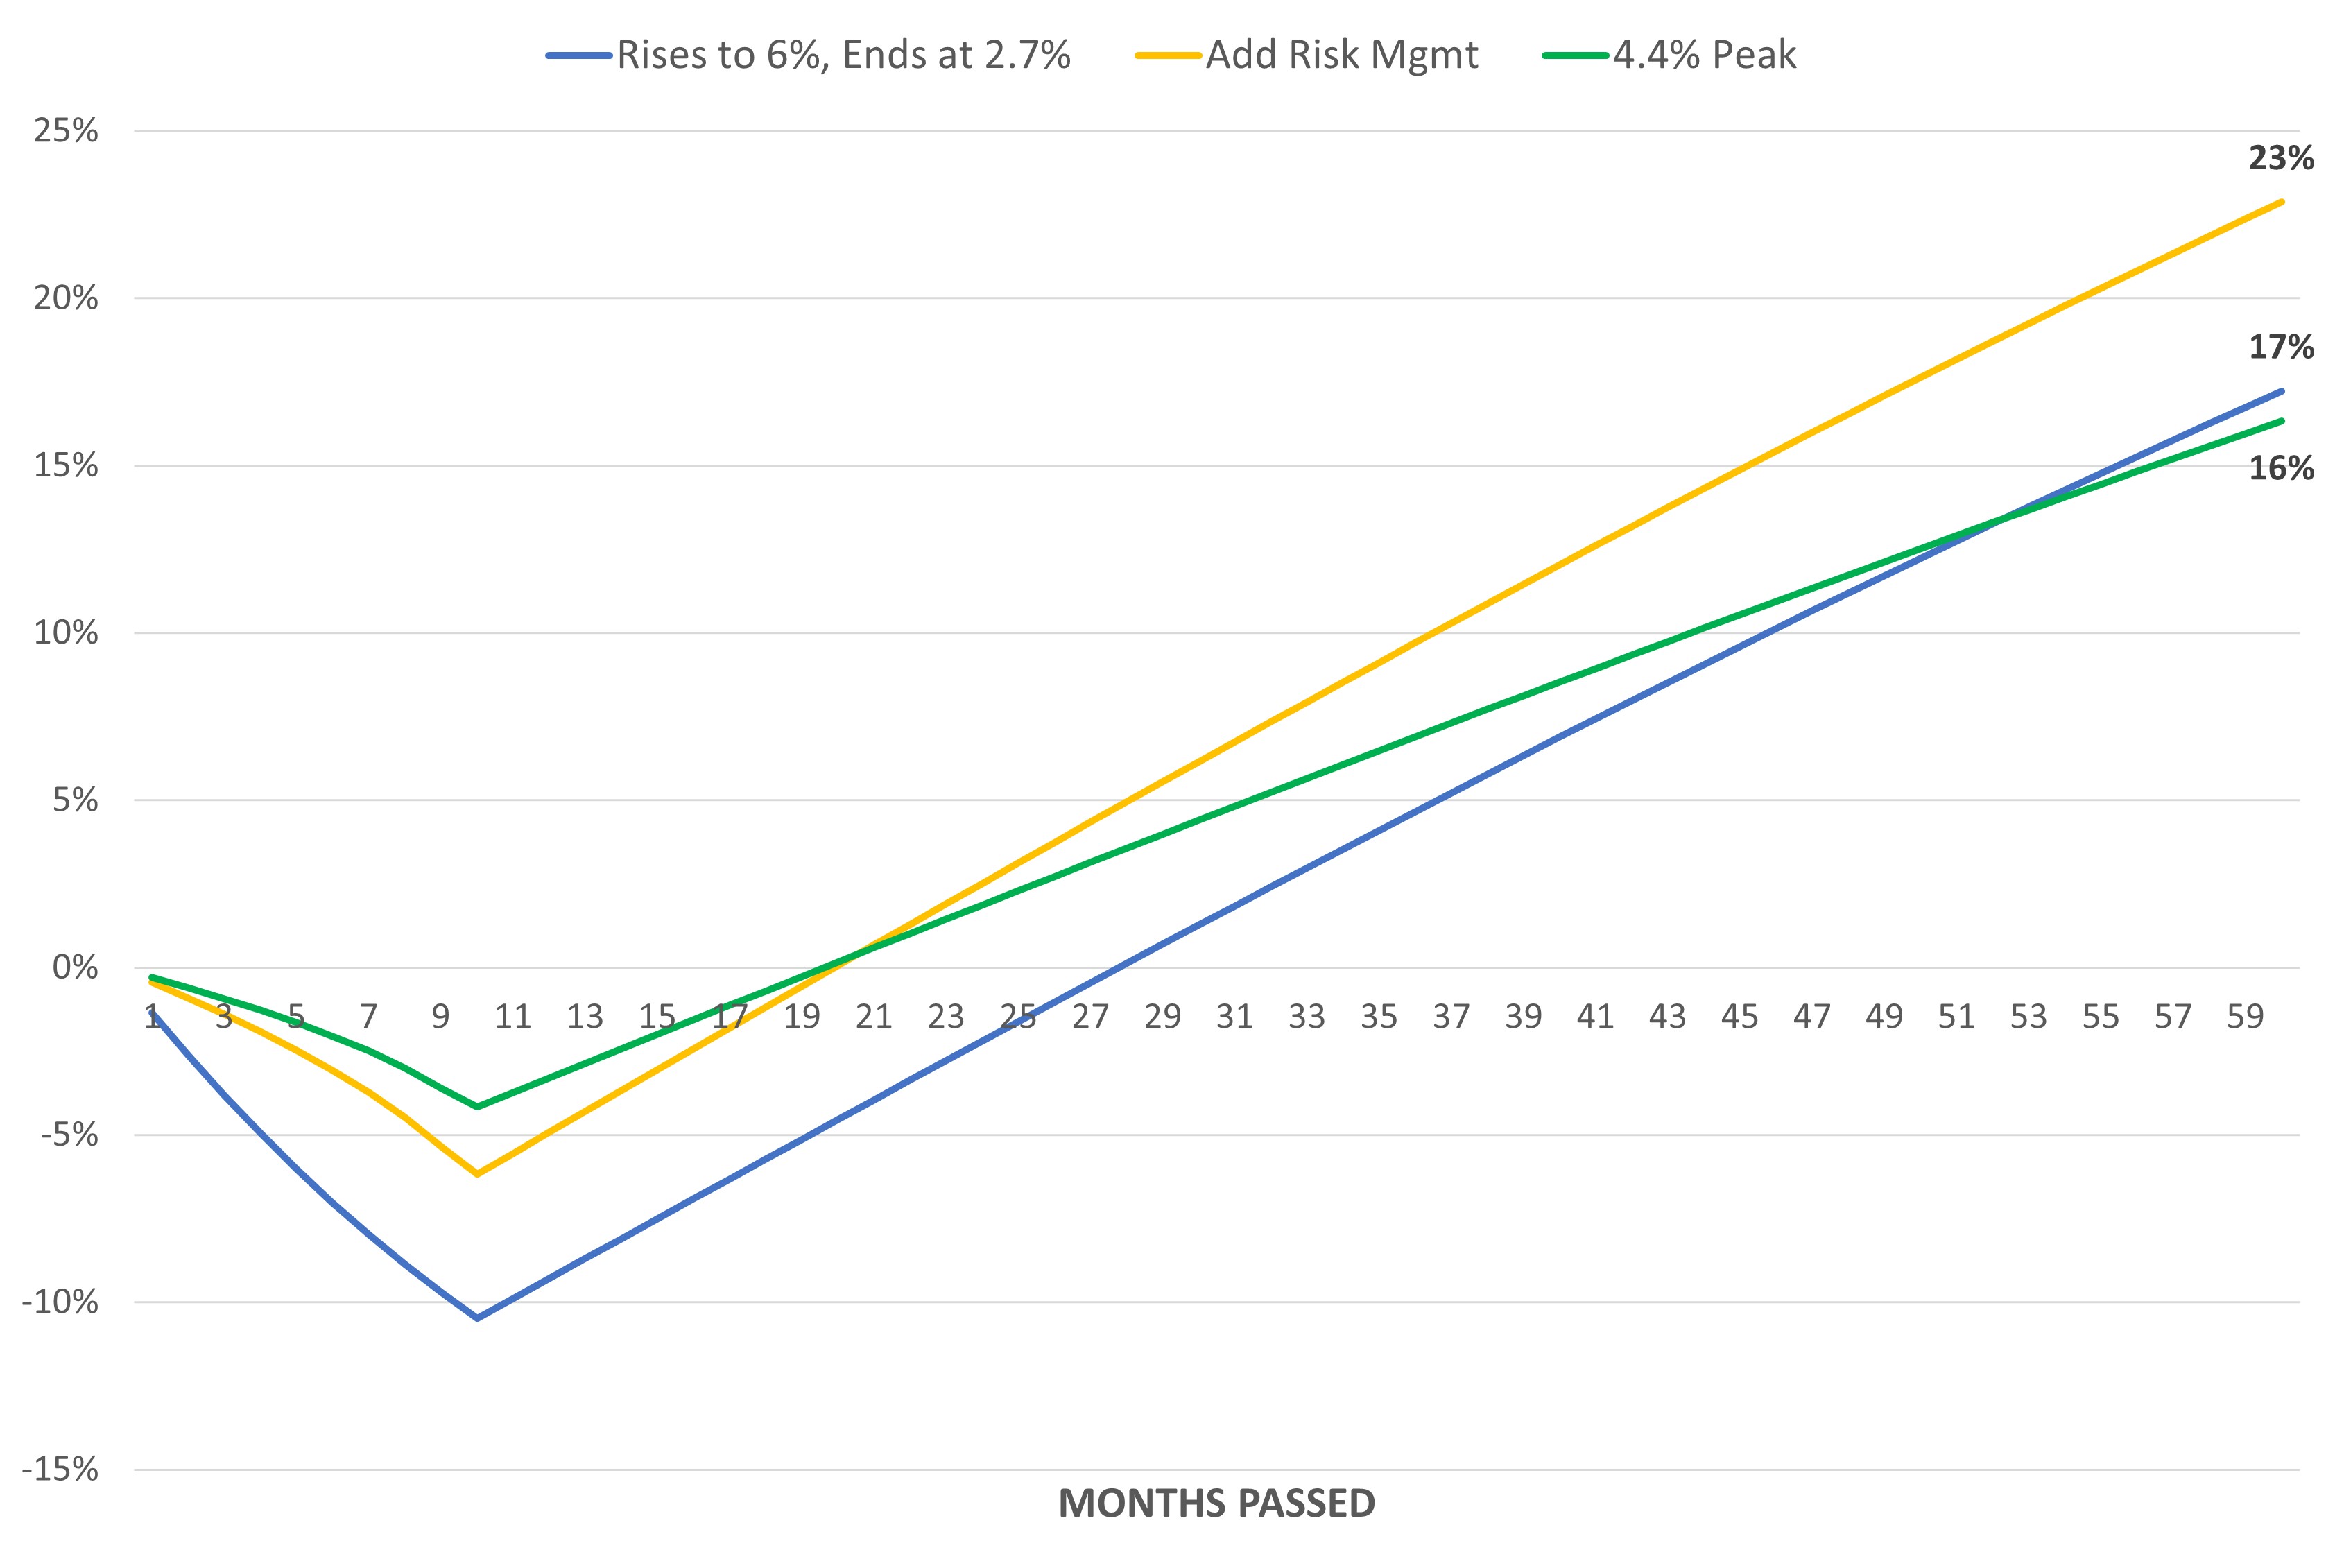
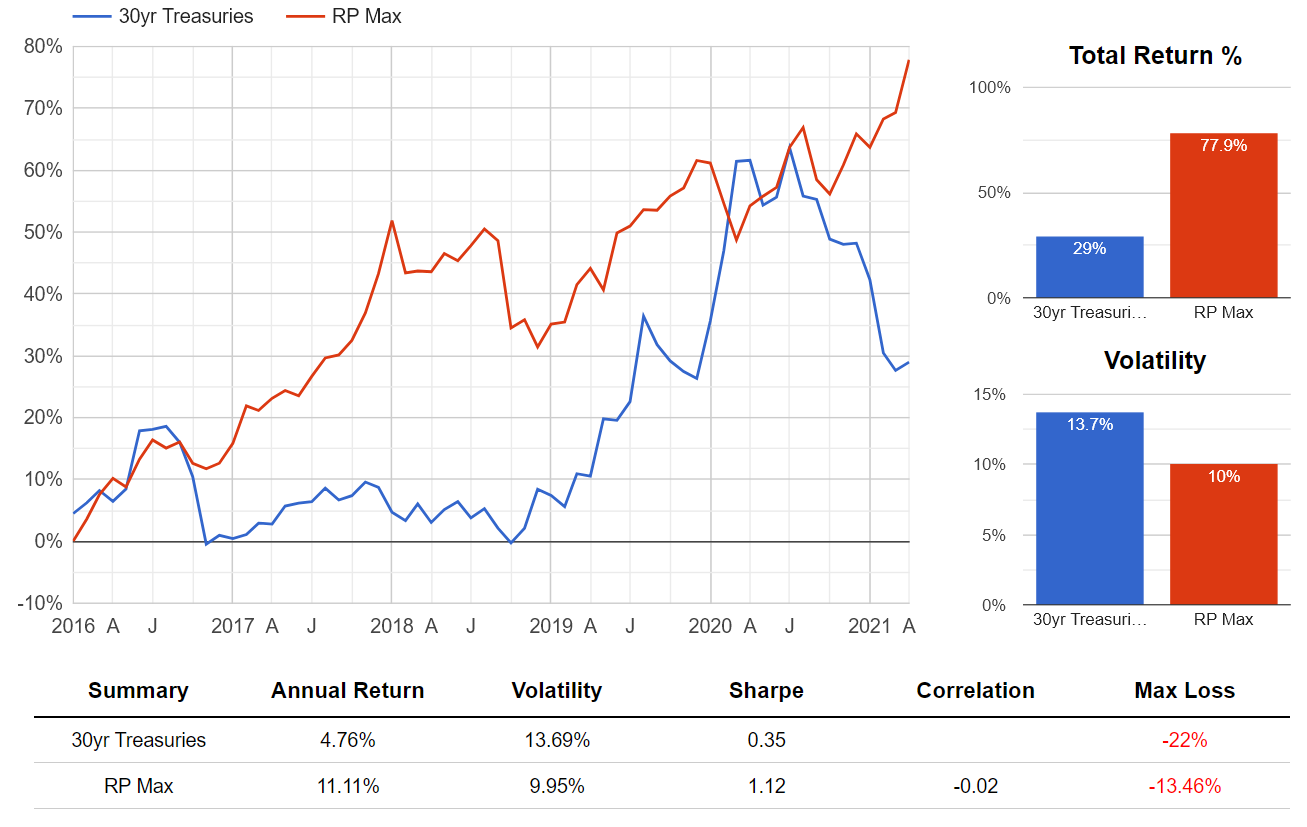
This is because the assets in the portfolio literally pay out money over time, in the form of dividends for equities and coupons for bonds. These payments do not affect the current prices of those assets, which are always forward-looking. As a result, the bar to achieve the same recovery gets lower and lower every year. For example, a 30yr Treasury bond has been a breakeven investment since October 2022. As of today, it would gain ~20% if yields dropped to 3.2%. In October 2022, the same gain would have required yields to drop to 2.7%. This effect accumulates further with every year that passes. In a purely mathematical sense, the path to recovery today is much easier than it was two years ago.
Taking this into account, it is surprising that this drawdown has lasted this long. In addition to the automatic lift from coupon and dividend payments, these assets will tend to hedge each other via fundamental economics. Interest rates have only gone up so much due to a mix of runaway inflation and strong growth. In theory, this should benefit both stocks and commodities enough to offset the weakness in bonds. To the extent that this has not happened, it suggests that one or more assets remains underpriced.
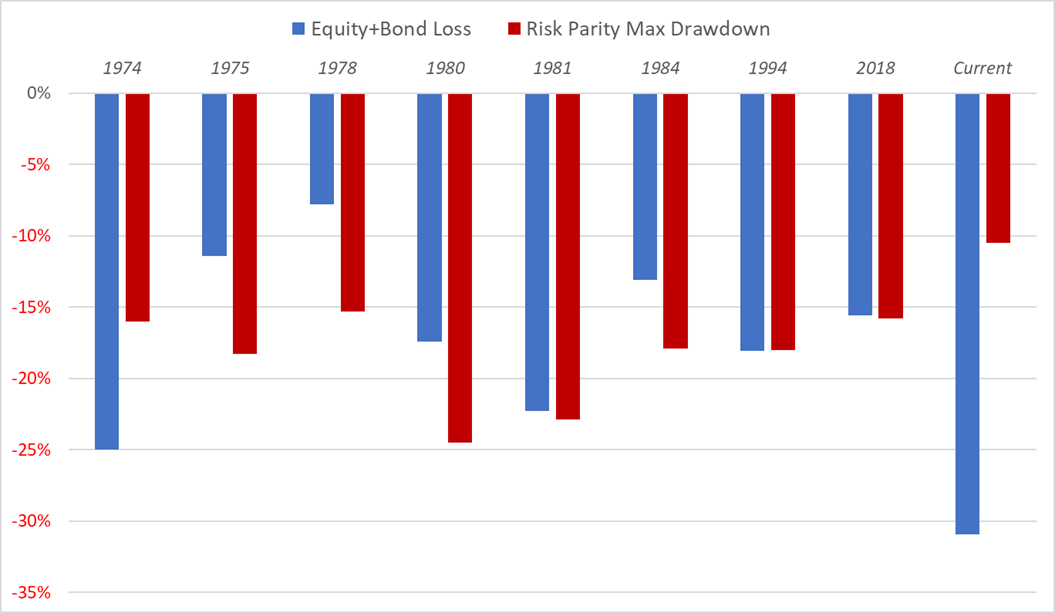
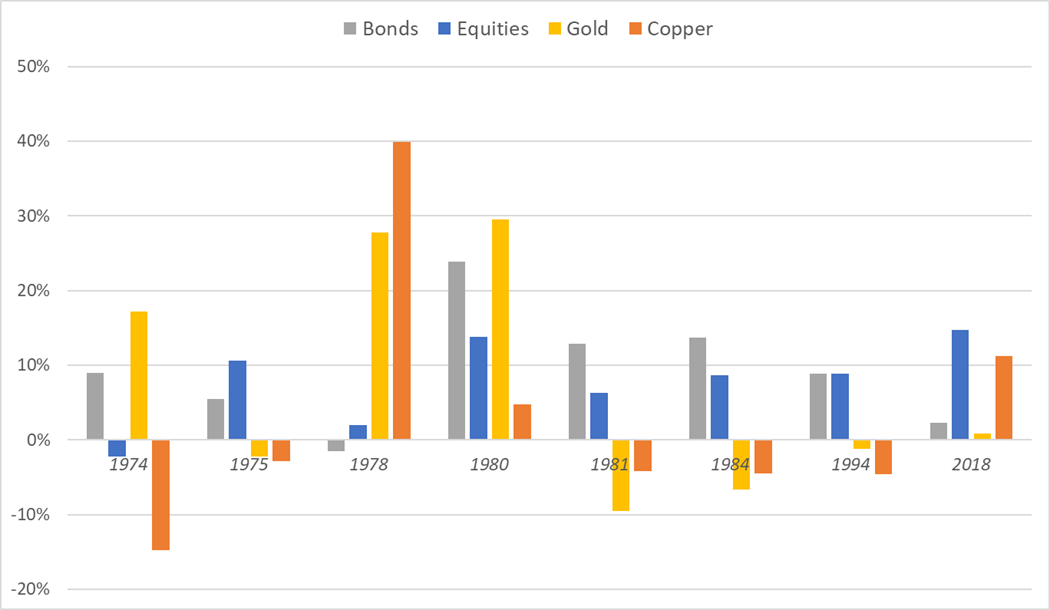
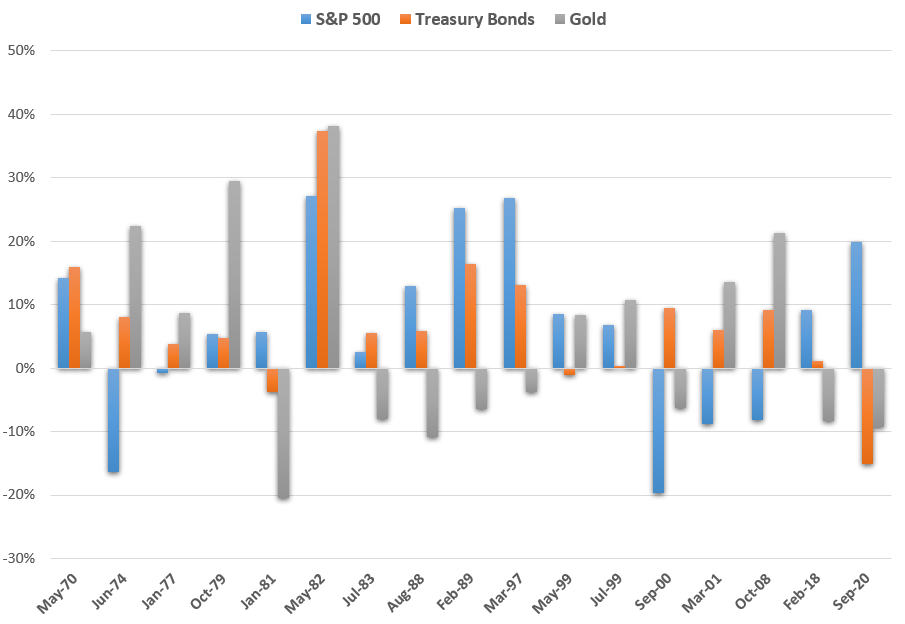
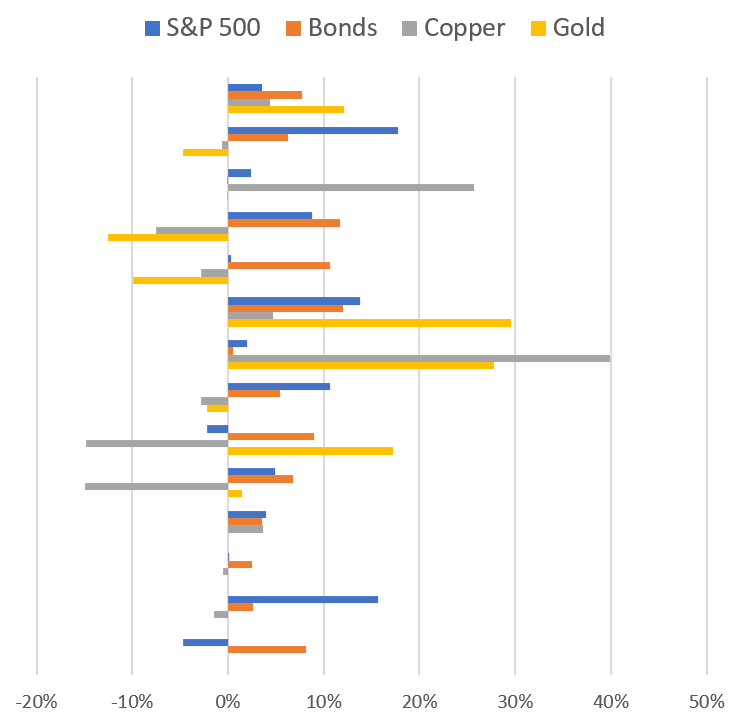
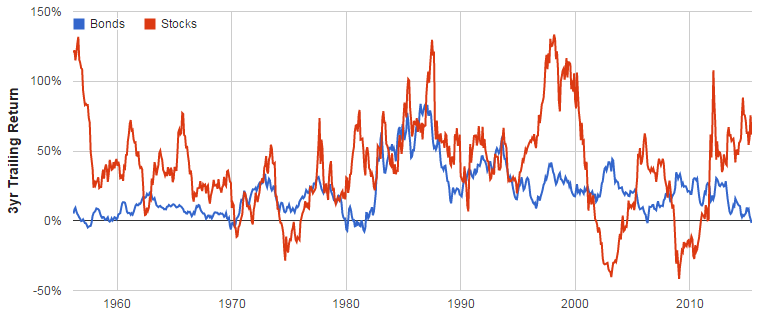
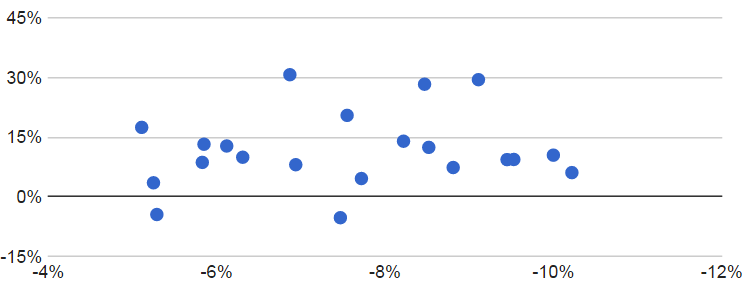
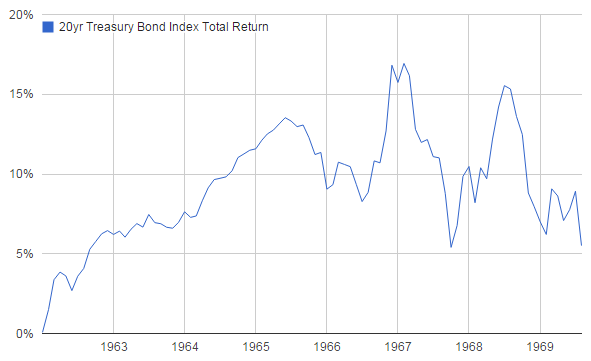
A quick look at history helps to highlight this. The following table is a list of every bond drawdown of 15% or more since the 1970s, along with the cumulative returns of the other major asset classes over the same timeframes.
Performance of Various Asset Classes in Every Major Bond Drawdown Since 1970
| Timeframe | S&P 500 | Bonds | Gold | Copper |
|---|---|---|---|---|
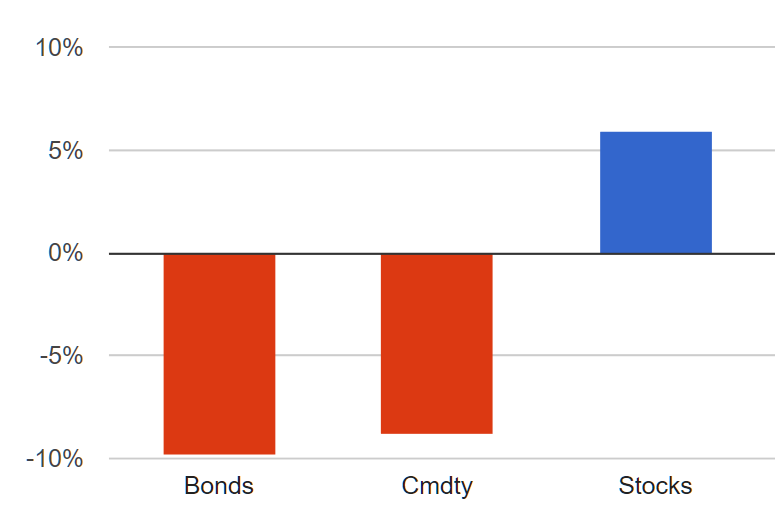
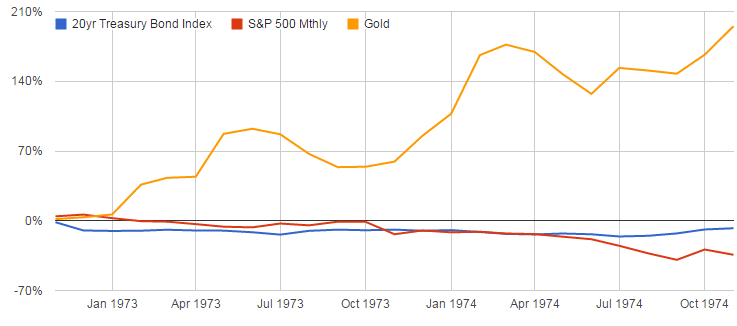
| Nov 1972 - Aug 1974 | -33% | -15% | 148% | 41% |
| July 1979 - Sept 1981 | 29% | -23% | 55% | -1% |
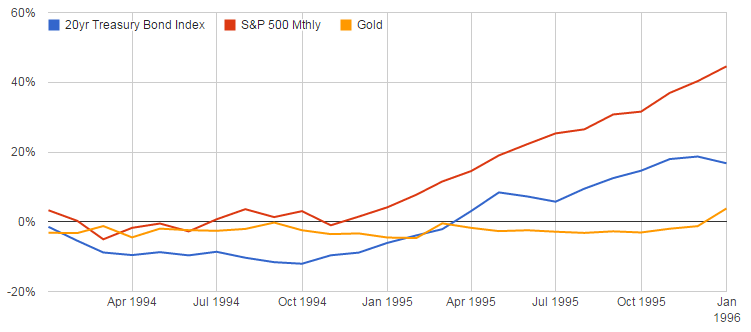
| Oct 1993 - Oct 1994 | 5% | -17% | 9% | 68% |
| Oct 1998 - Dec 1999 | 50% | -16% | -5% | 15% |
| Jan 2009 - Nov 2011 | 46% | -22% | 52% | 214% |
| June 2012 - Dec 2013 | 48% | -20% | -24% | 4% |
| Sept 2016 - Oct 2018 | 32% | -16% | -6% | 32% |
| Present | 24% | -27% | 49% | 3% |
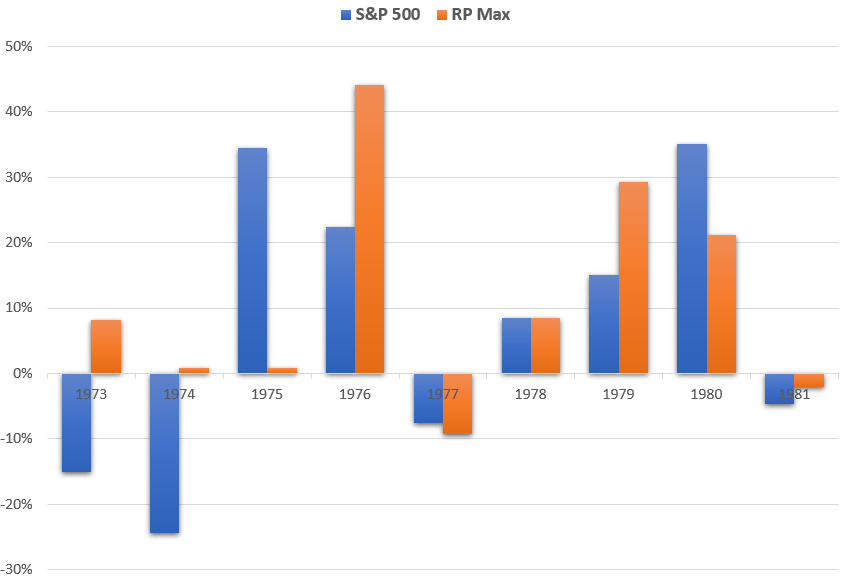
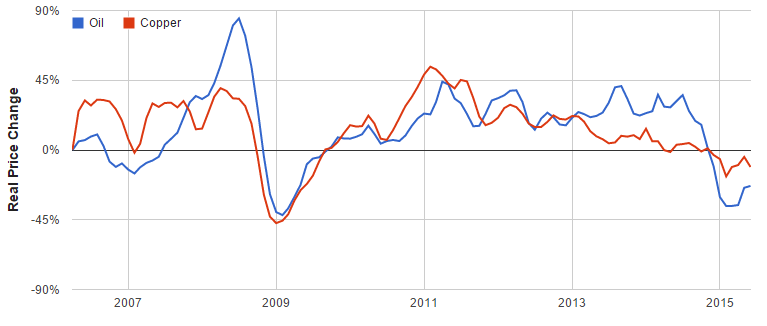
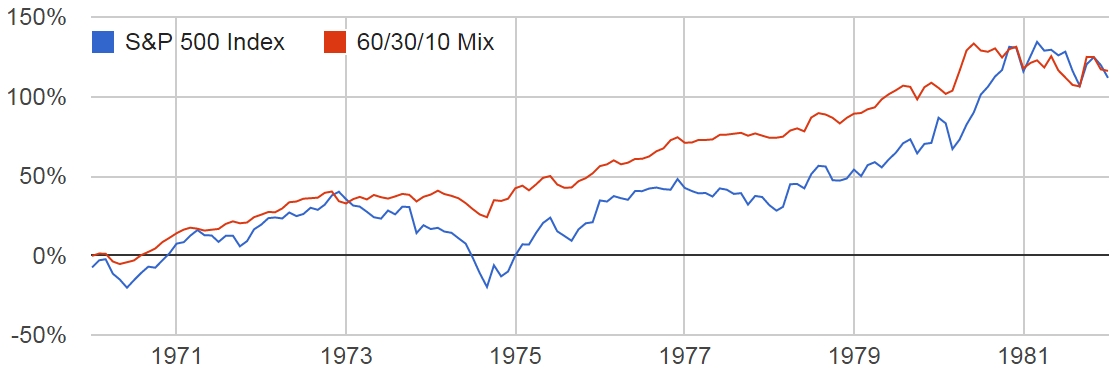
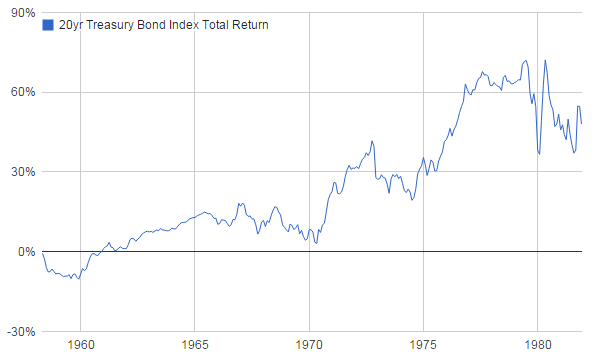
Bonds have already lost more than any other time in recent history, and they were down as much as 40% at one point. Given this, a couple of observations stand out. When interest rates have risen during periods of strong economic growth, which applies to all the timeframes from 1998 through 2016, stocks have generally returned 20-25% more than they have in the present episode. When this is accompanied by strong inflationary pressure, such as in the early 70s and 90s, both gold and industrial commodities like copper have outsized returns as well. Yet copper has remained flat since January 2022.
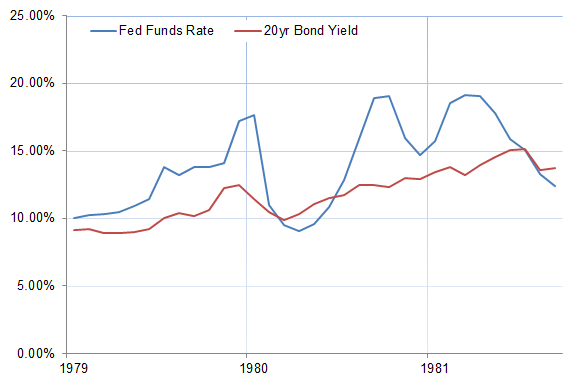
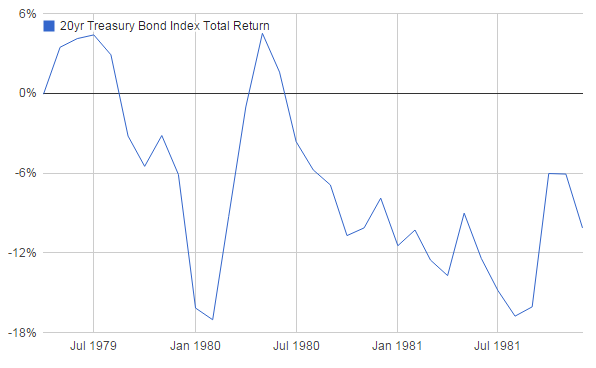
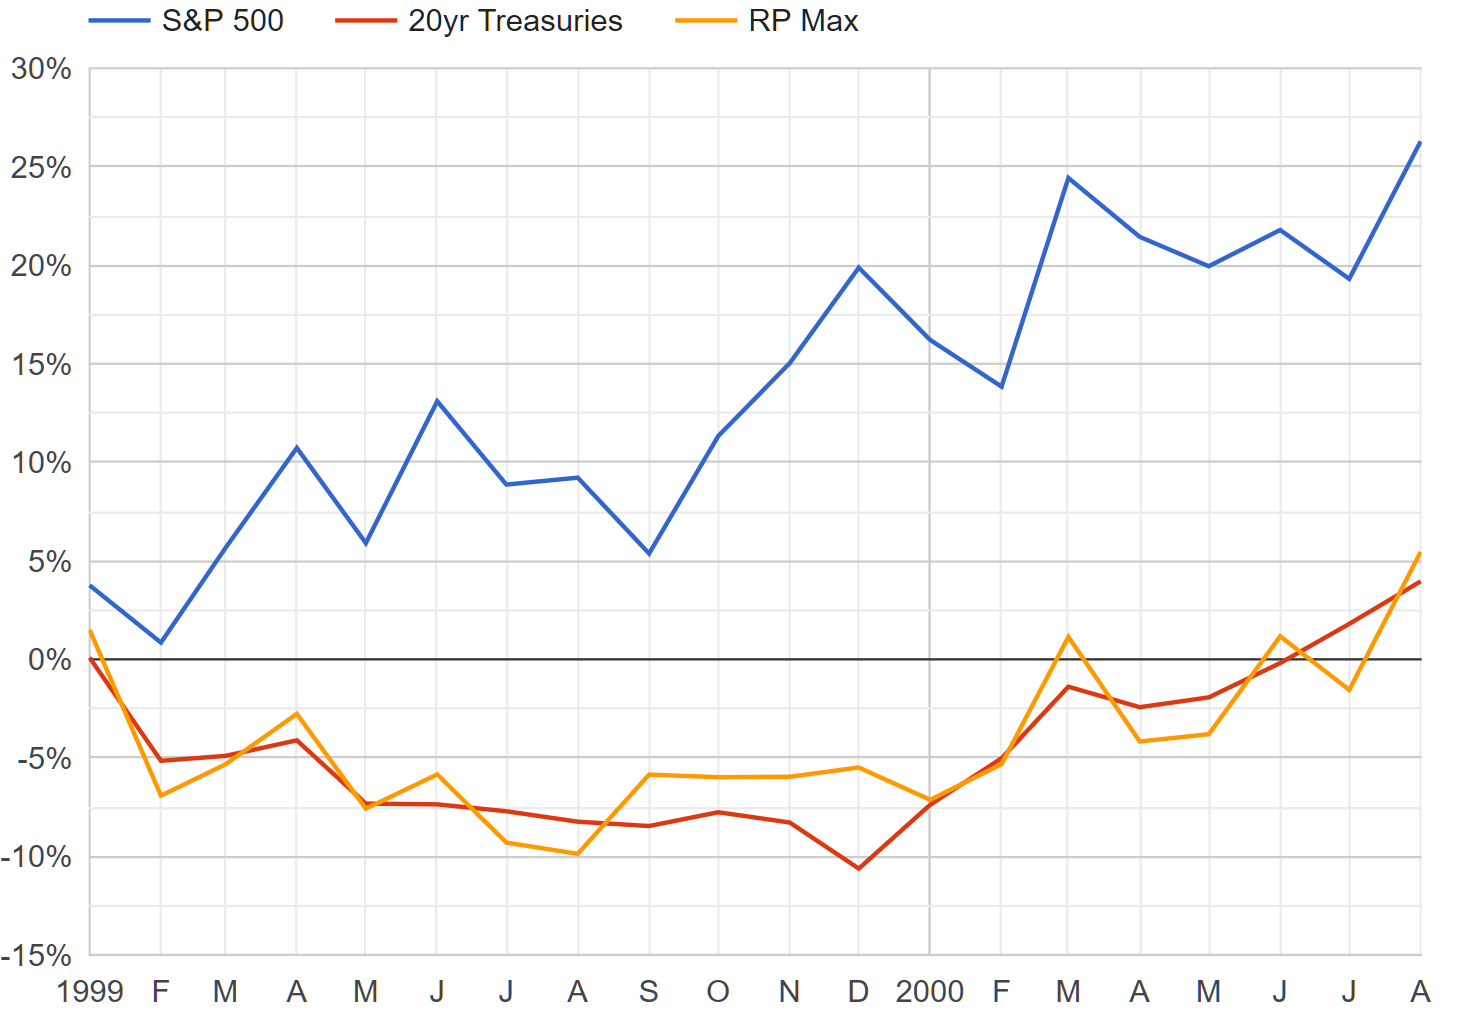
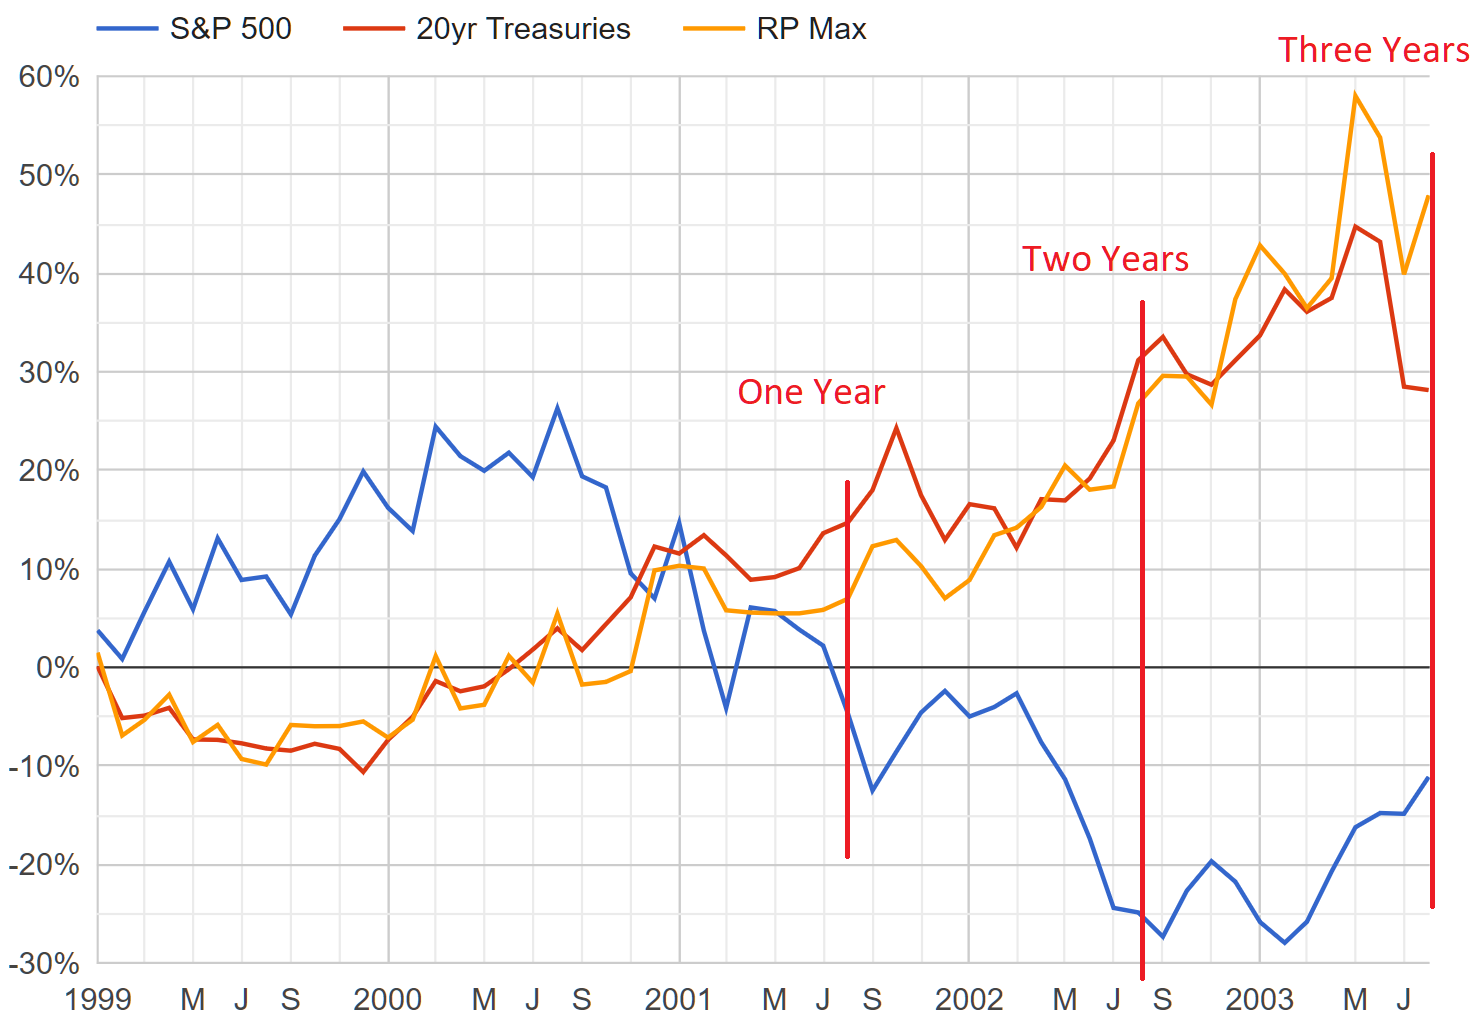
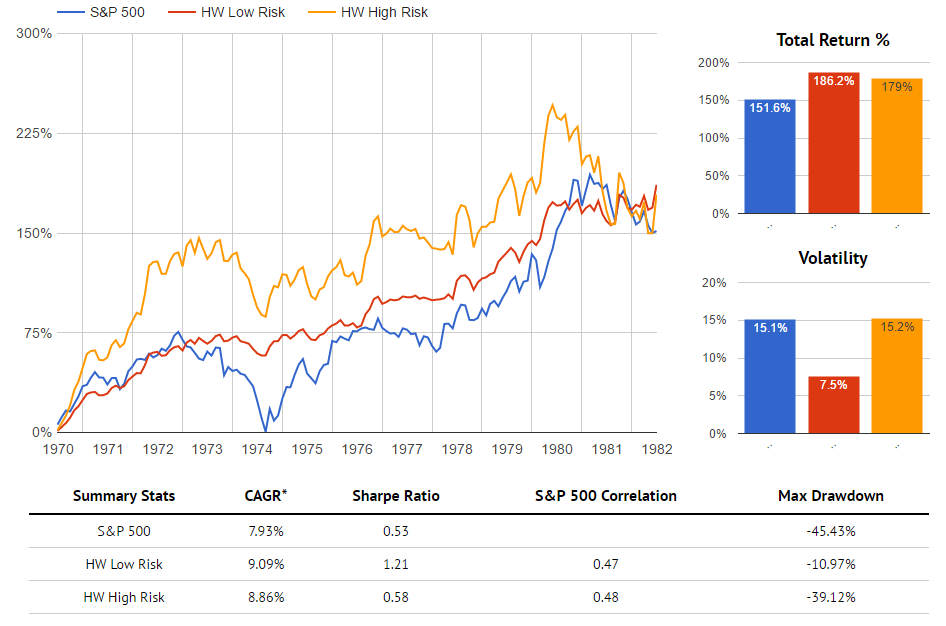
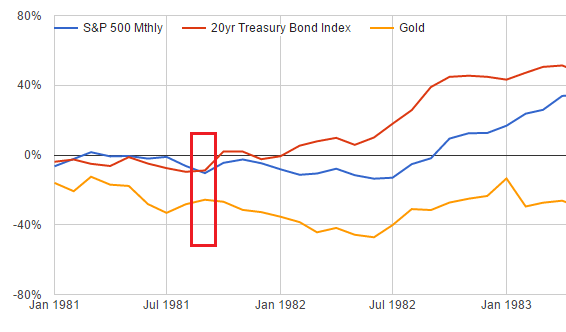
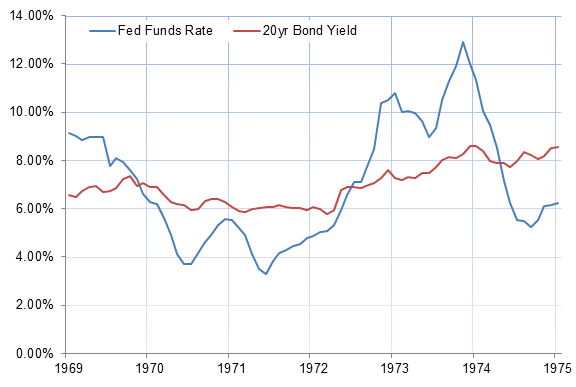
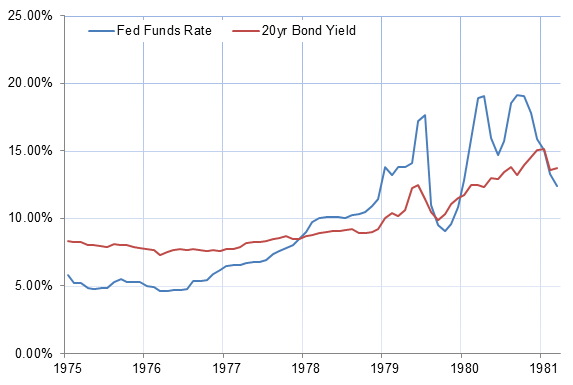
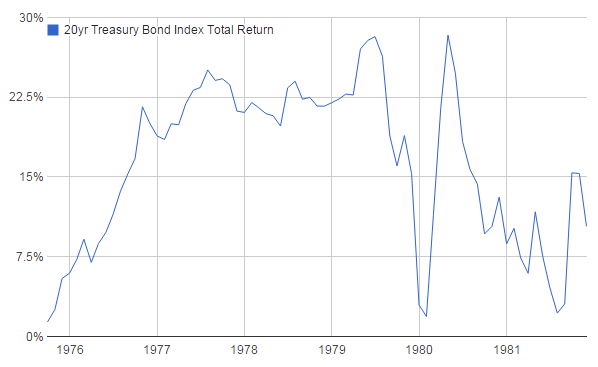
The closest historical analog is the period from 1979 to 1981, when Paul Volcker prioritized squashing inflation above all else. In that environment, there was just so much uncertainty about how high rates would have to go and how long they would have to stay there. This basically depressed asset prices across the board, outside of gold, which served as a catch-all safe haven. It's a reasonably good proxy for today, in the sense that asset prices back then didn't really make sense either. If economic weakness was on the way, rates were going to come back down. If it wasn't, stocks were undervalued. Once the inflation scare was more firmly settled, the removal of uncertainty alone would probably lift both asset classes, though gold would probably lose its luster.
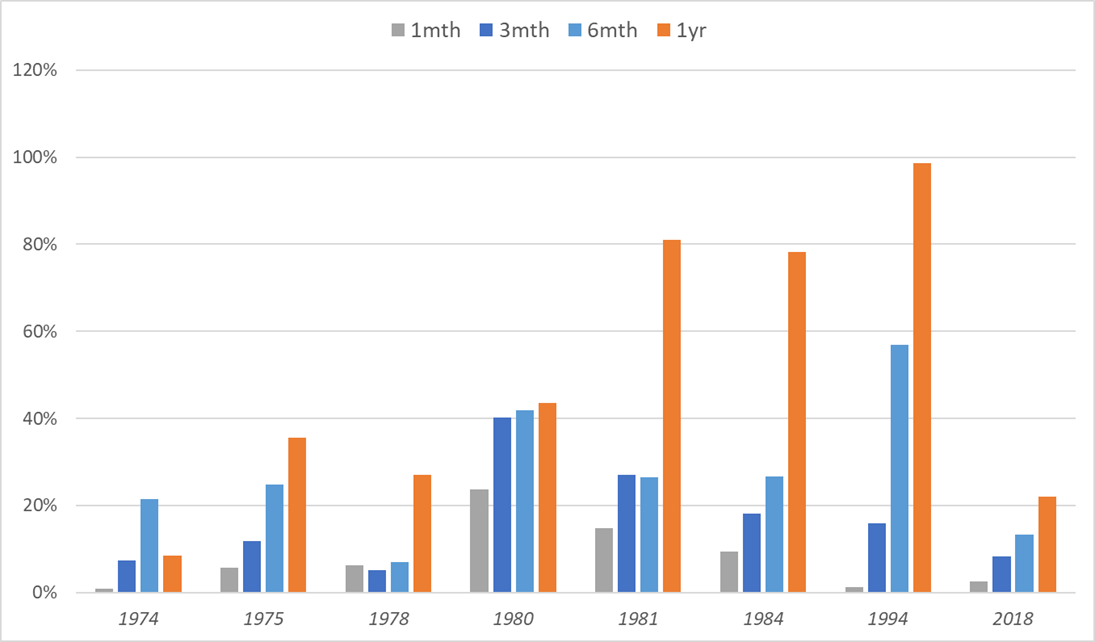
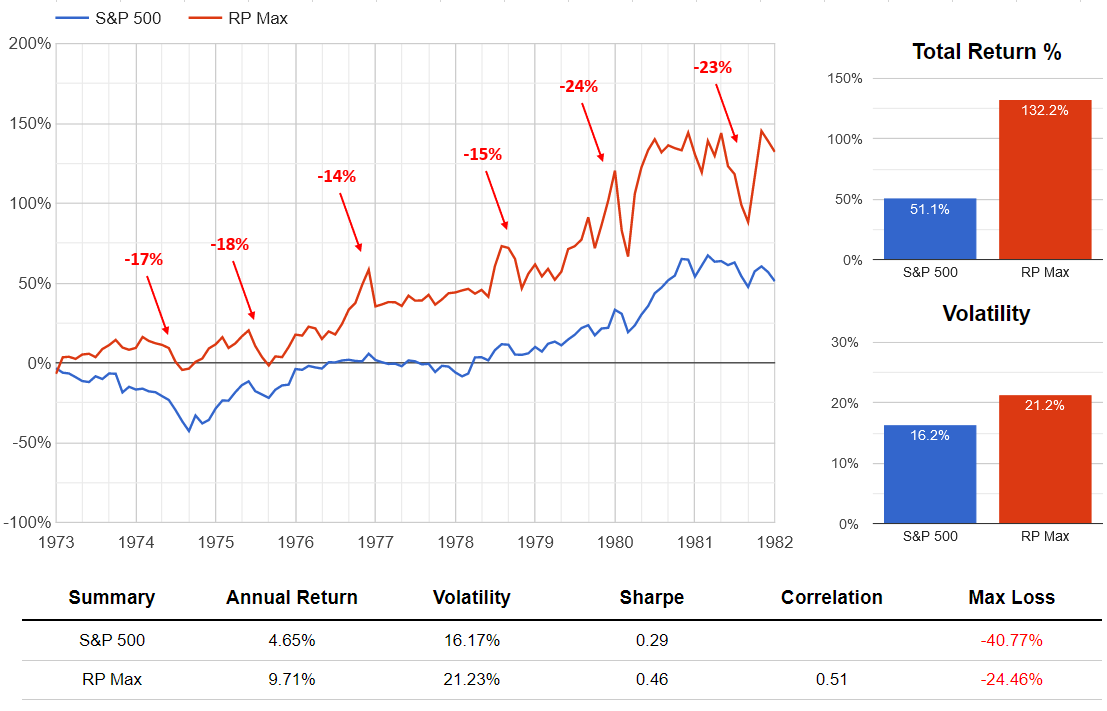
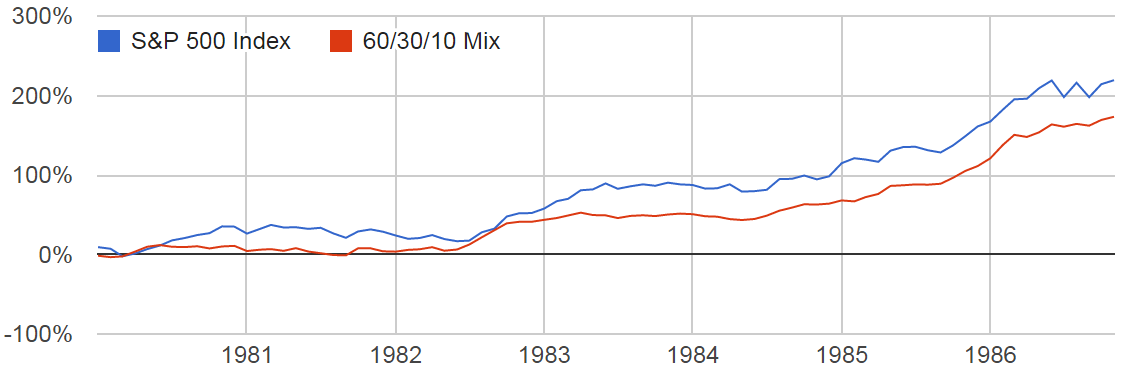
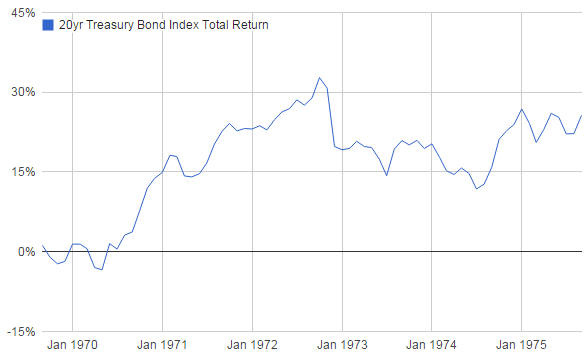
Fortunately, we can see exactly what happened in the years immediately following.
One, Two, and Three Year Returns by Asset Class After September 1981
| Years Following | S&P 500 | Bonds | Gold | Copper |
|---|---|---|---|---|
| One Year Return | 10% | 47% | -8% | -21% |
| Two Year Return | 56% | 66% | -11% | -17% |
| Three Year Return | 61% | 74% | -21% | -25% |
In this case, both stocks and bonds had plenty of room to run once inflation was broken, and more than offset the corresponding weakness in commodities. In retrospect, both assets presented incredible value in September 1981. But investors had to tolerate a great deal of volatility and misvaluation leading up to that point.
The story today is not the same, but it very likely rhymes.
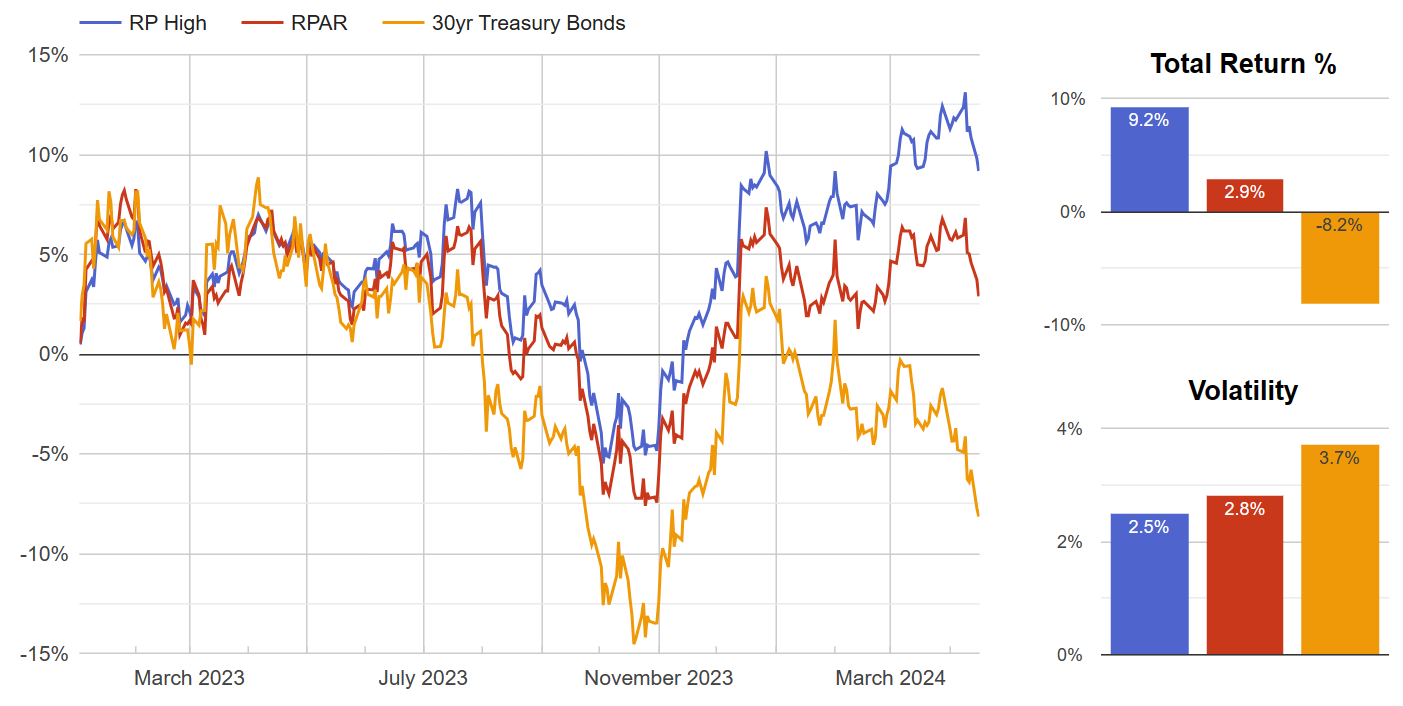
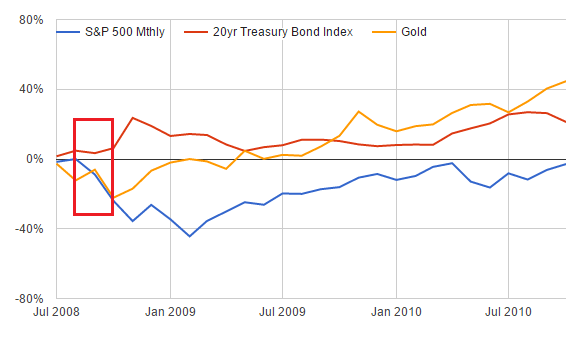
Back to the Present
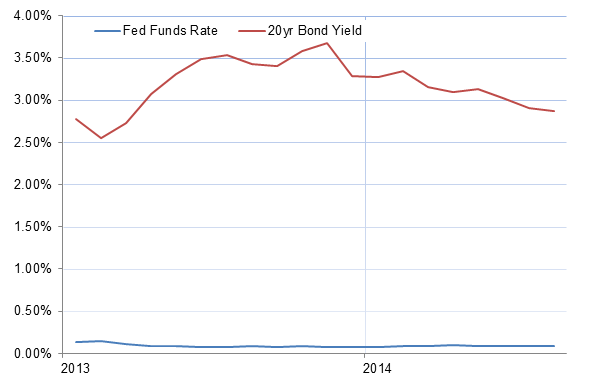
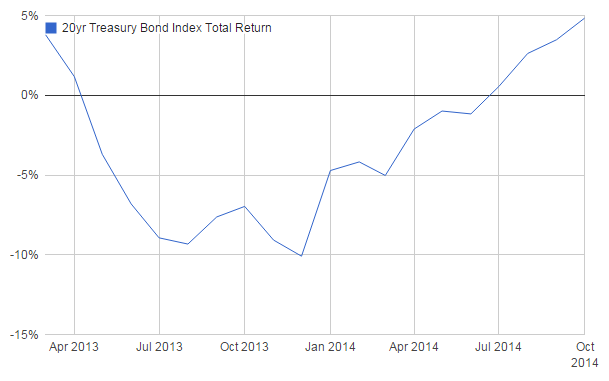
Extending the historical analogy, assets were stuck in a holding pattern for over two years beginning in 1979. Interest rates officially peaked in June 1981, which was enough to start to unwind some of the asset price dislocation. A similar date now would be the summer of 2024, right before the Fed finally cut rates in September. If the same kind of price dislocation existed leading up to this year, one or more asset classes would have been expected to rally (and more than offset any weakness in the others).
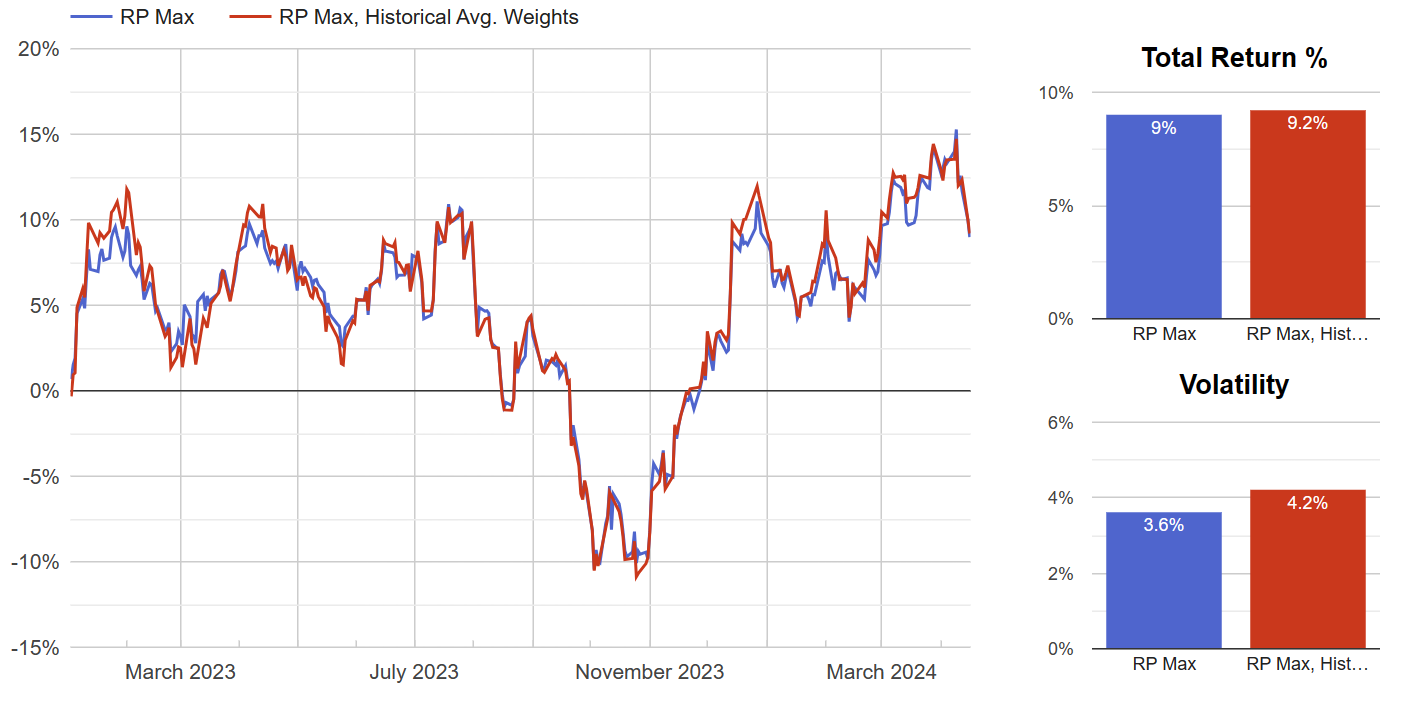
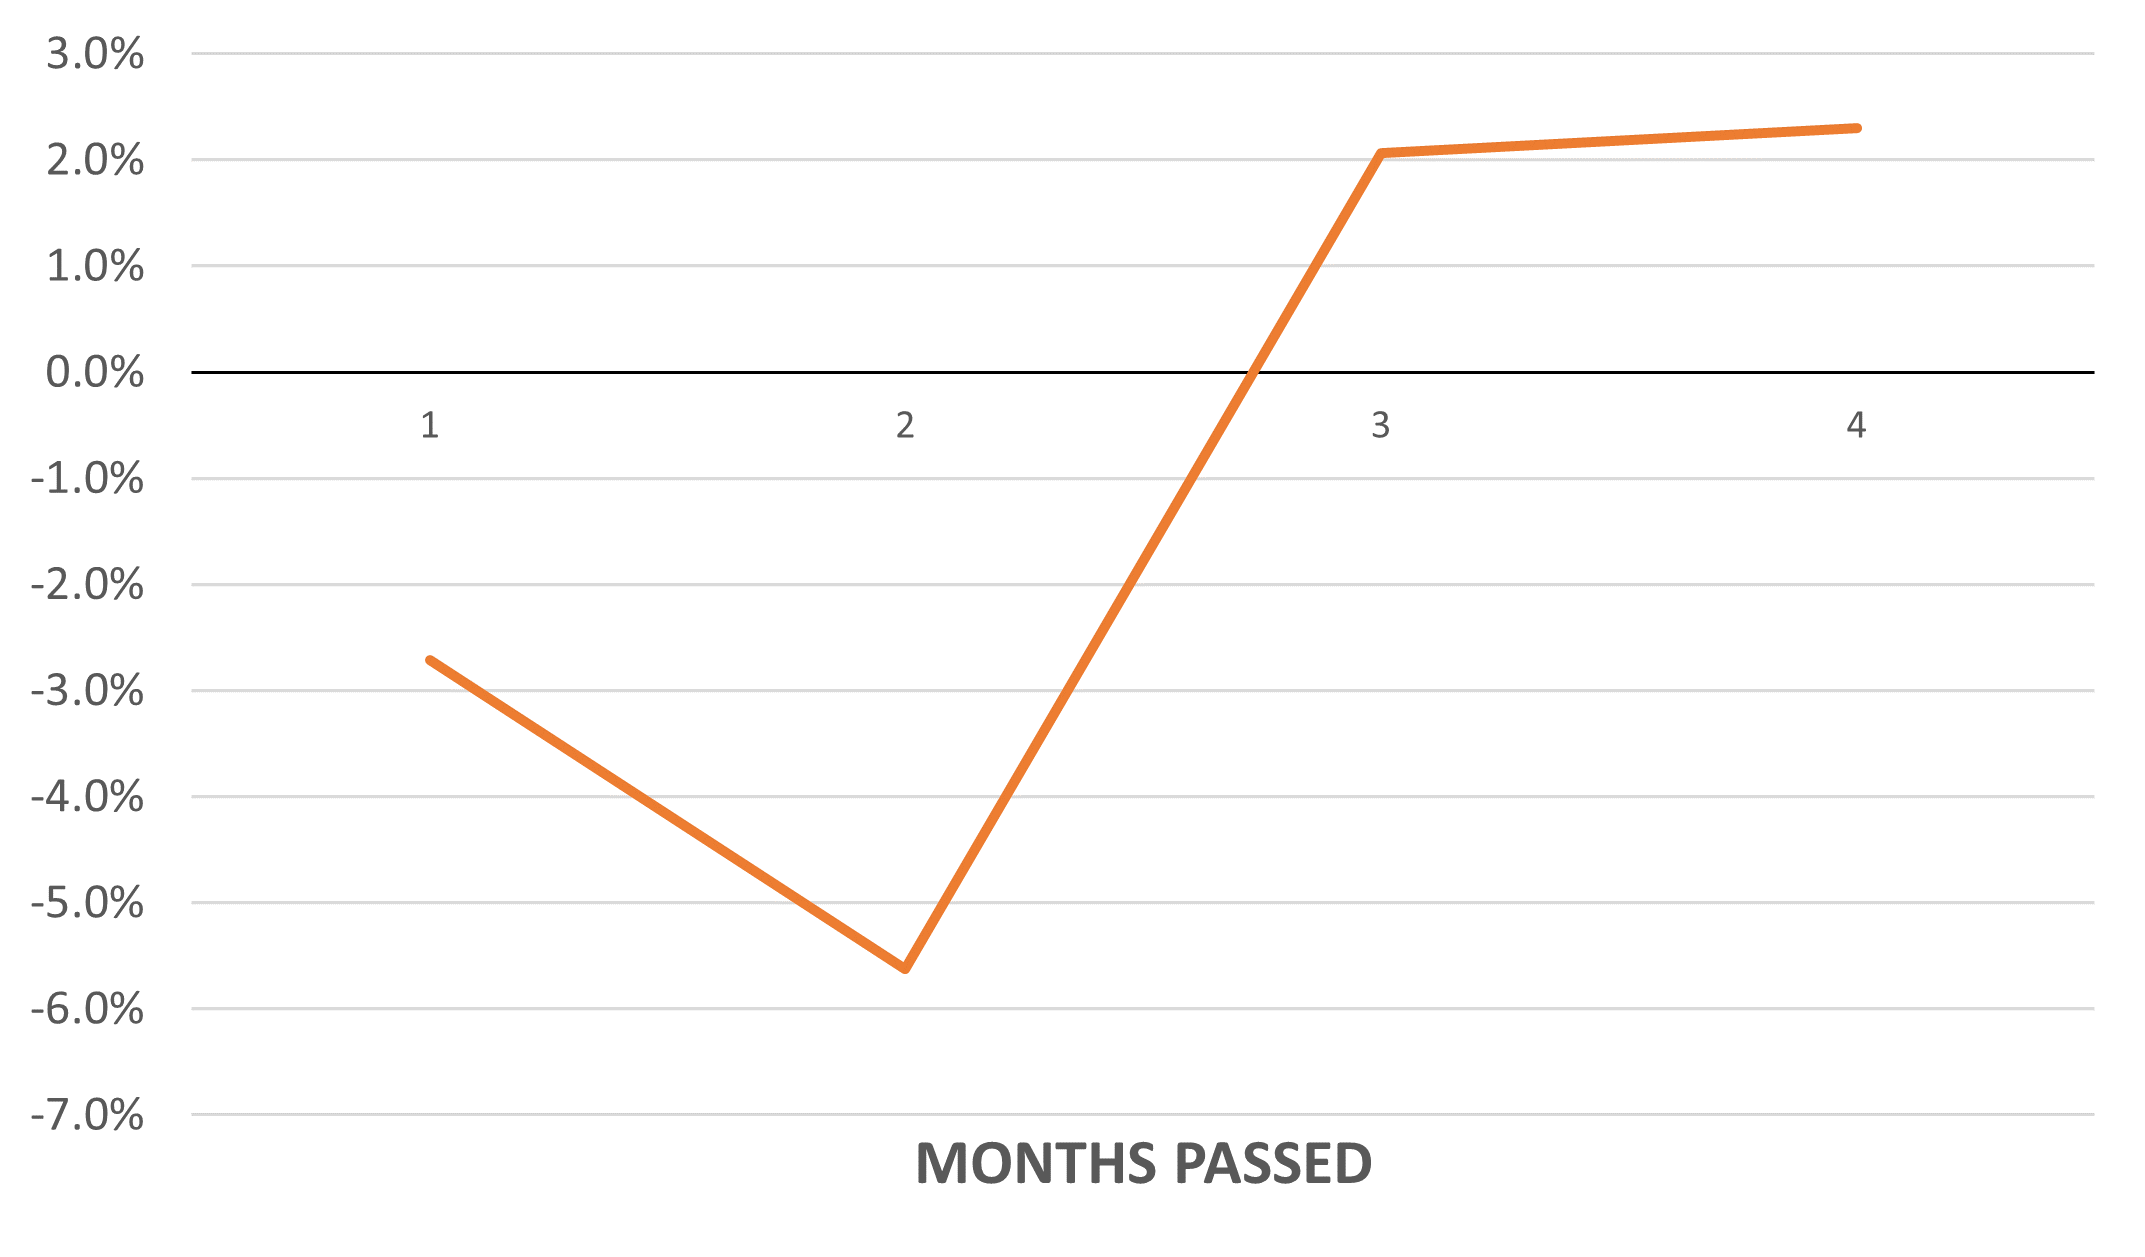
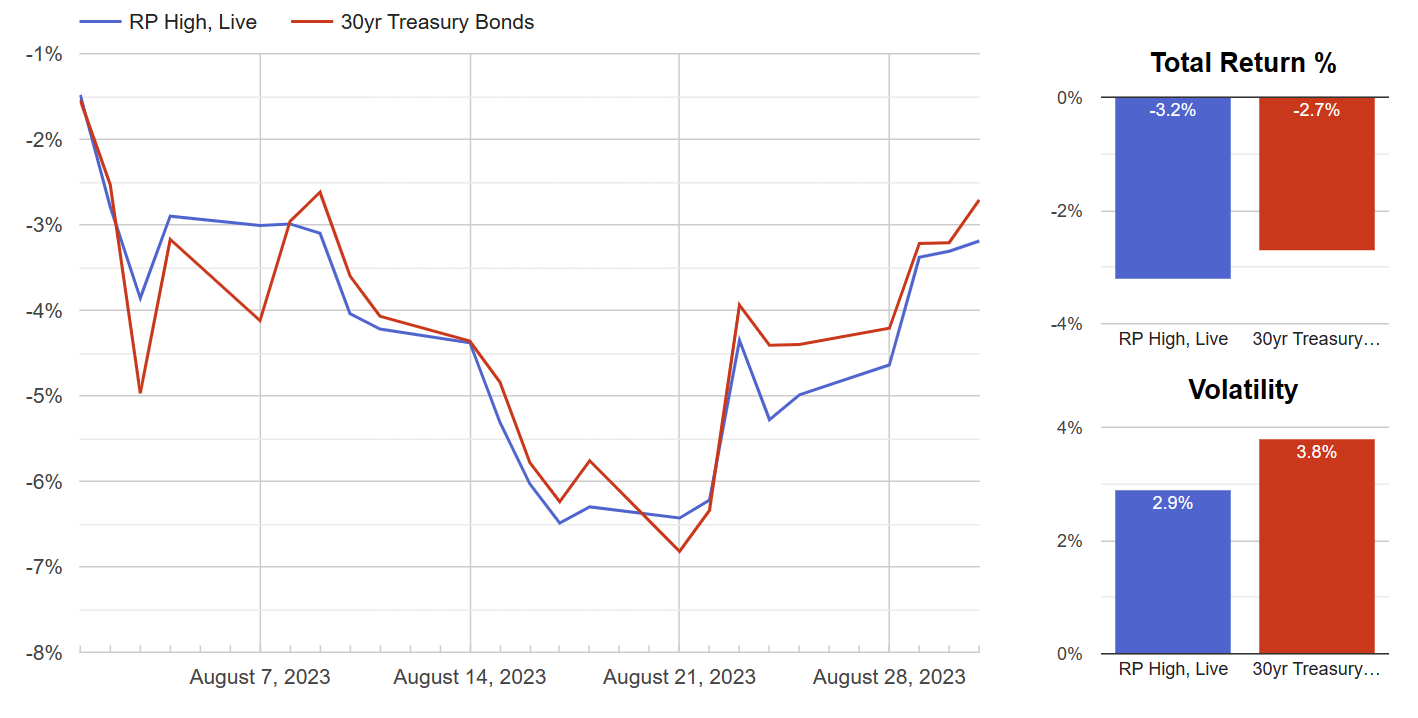
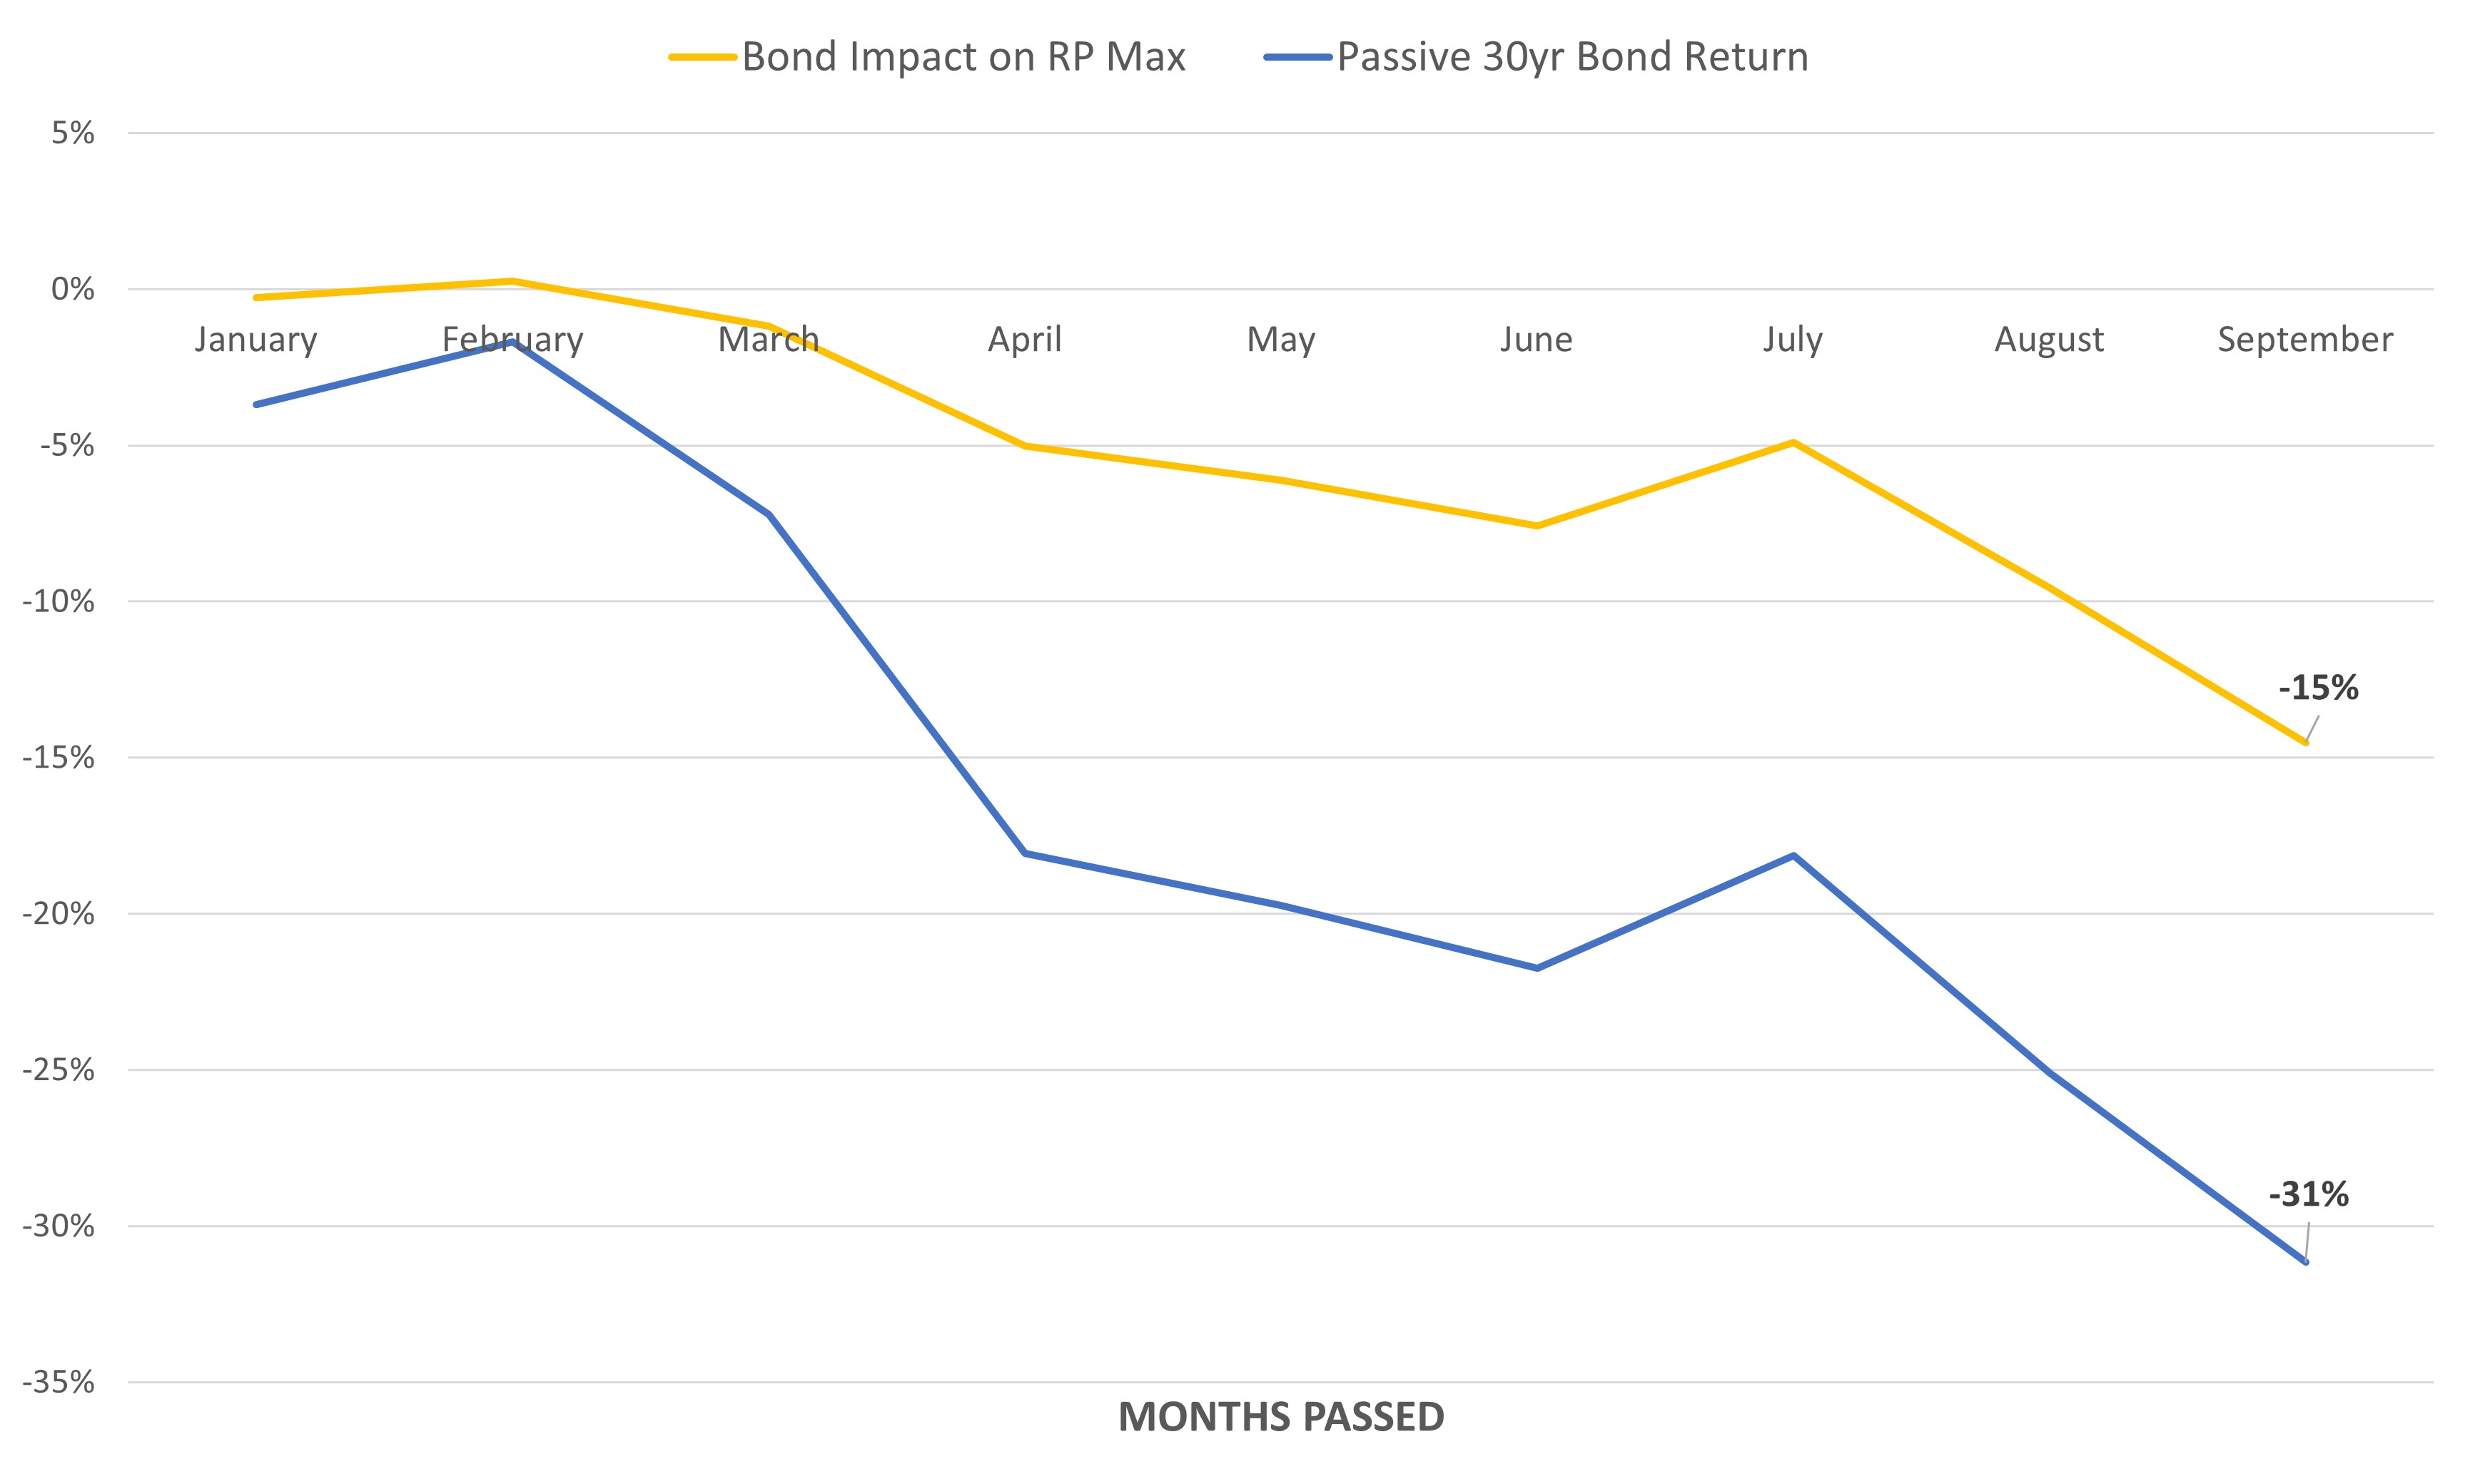
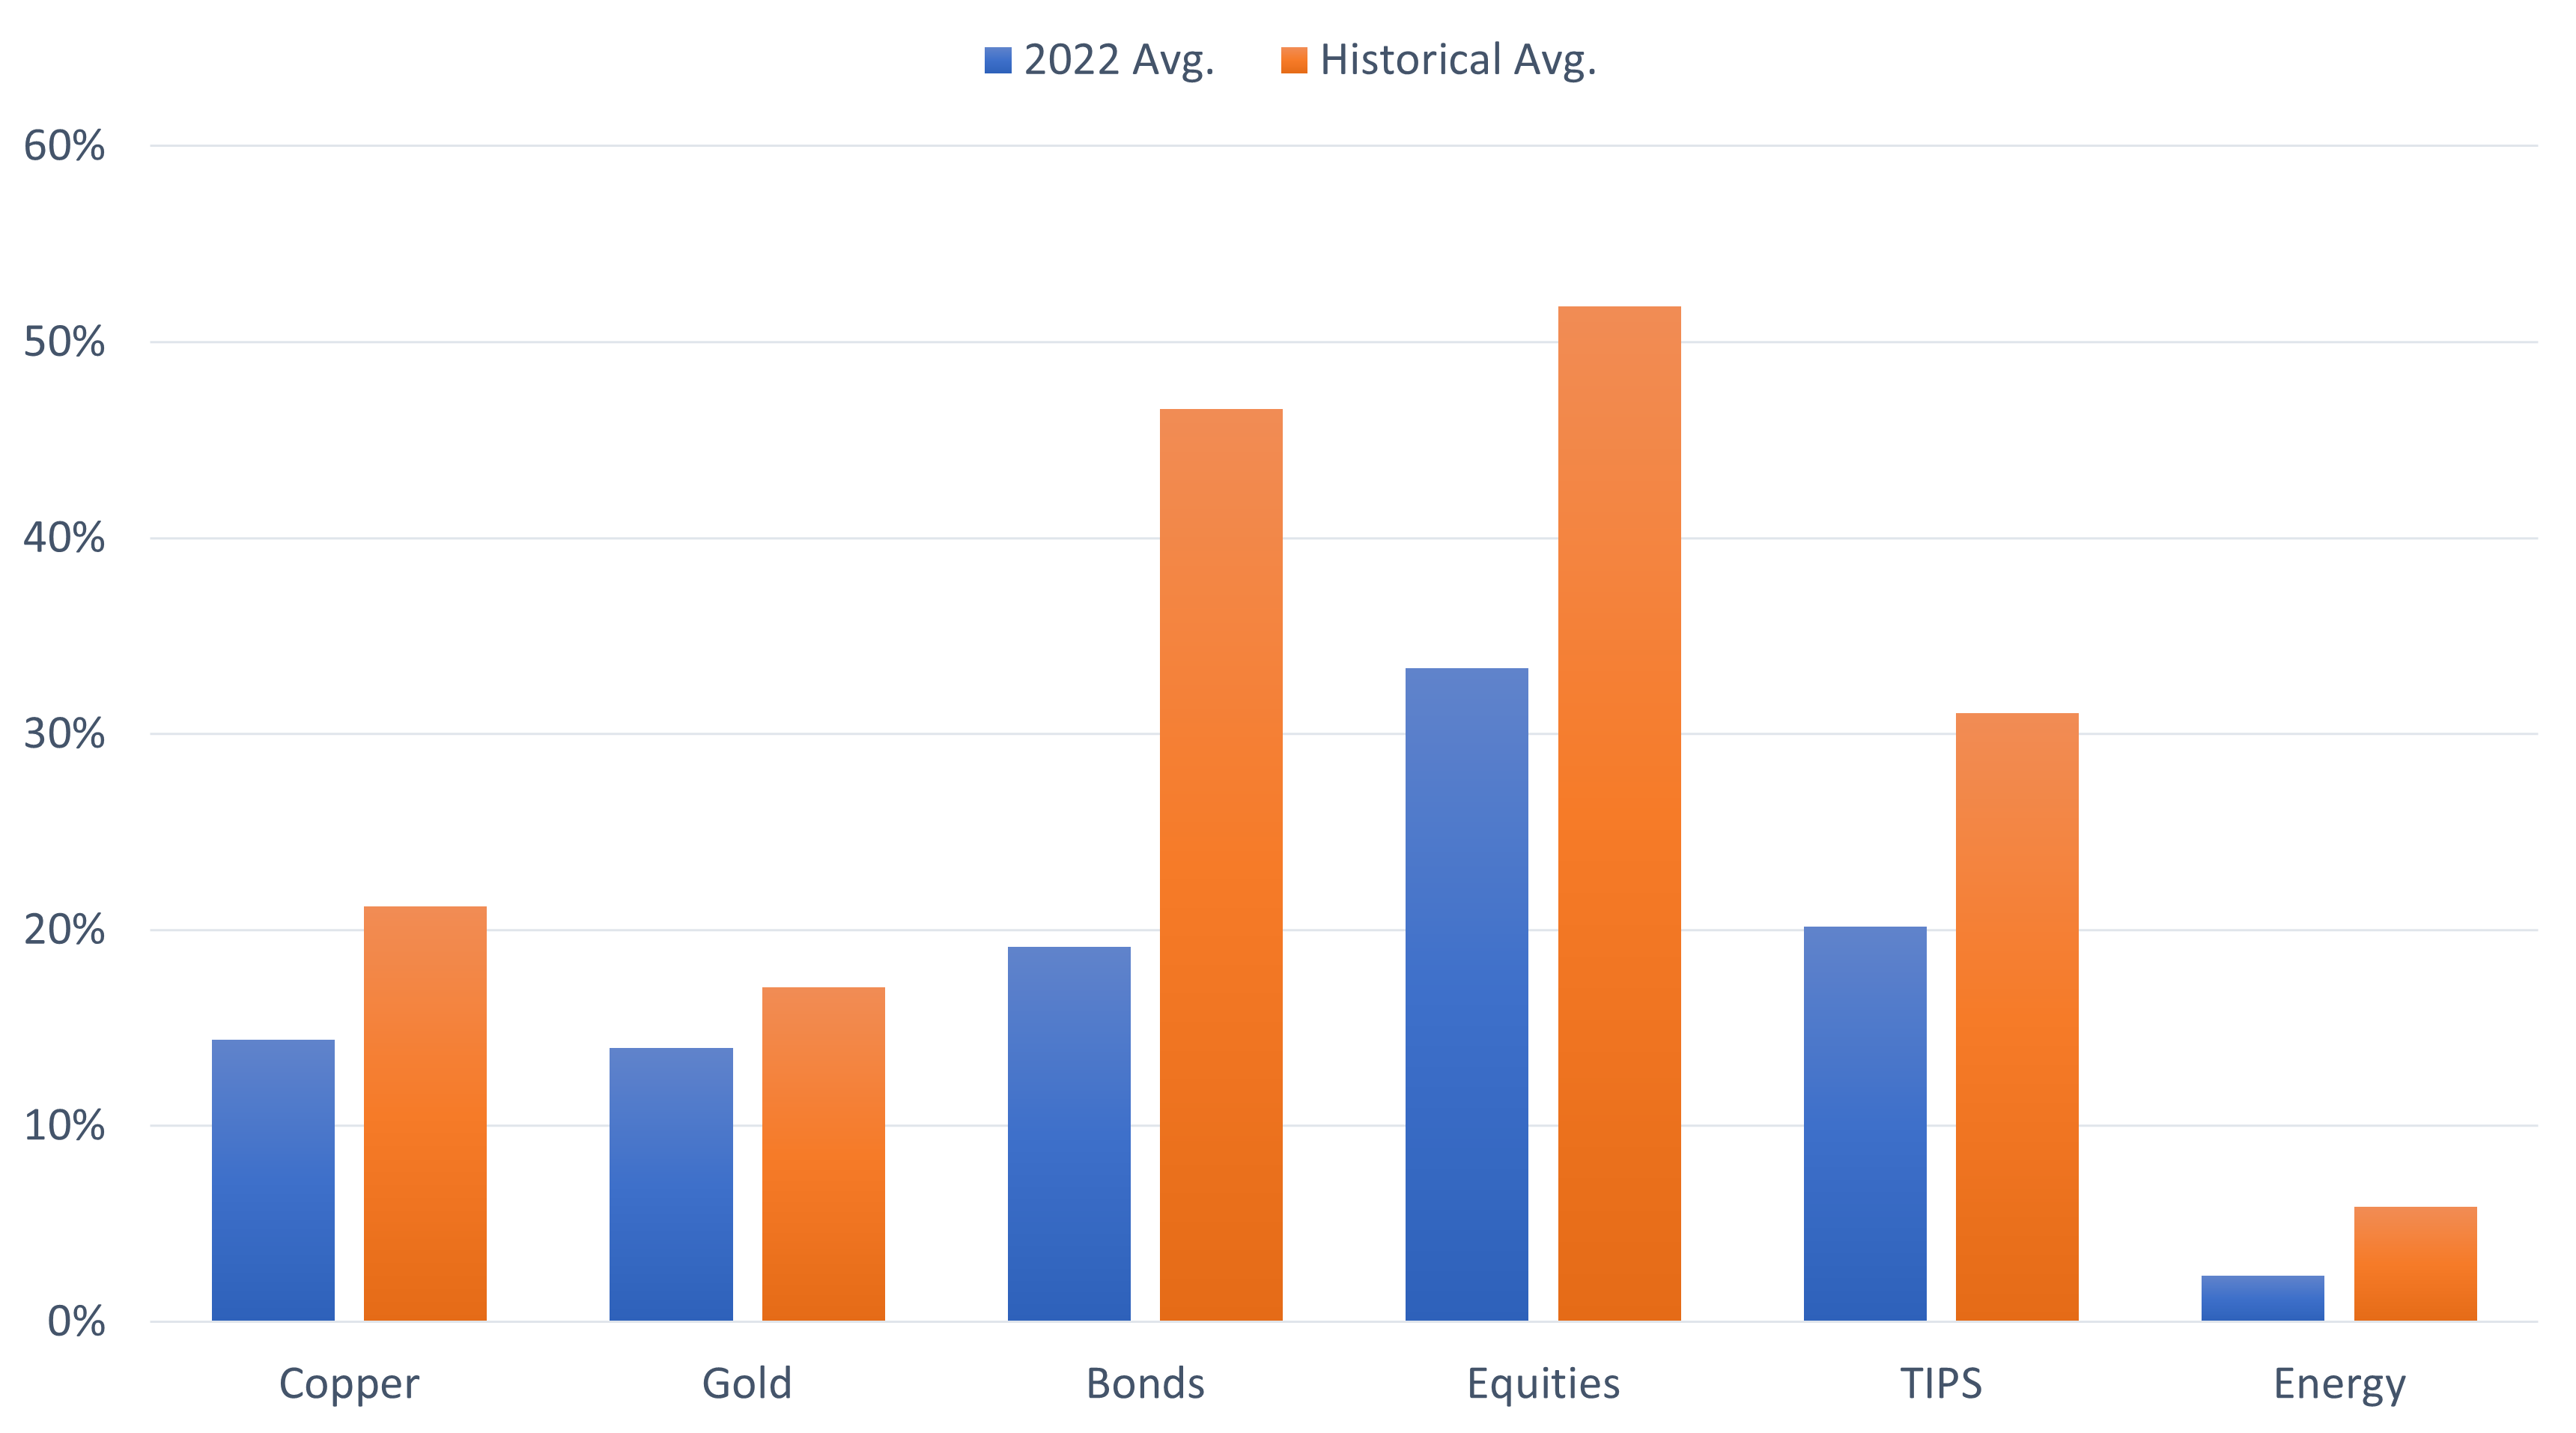
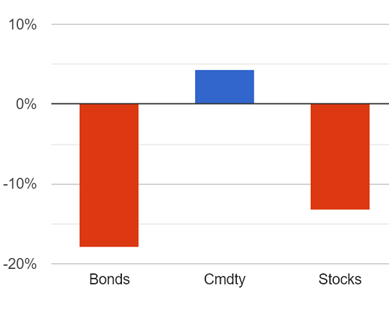
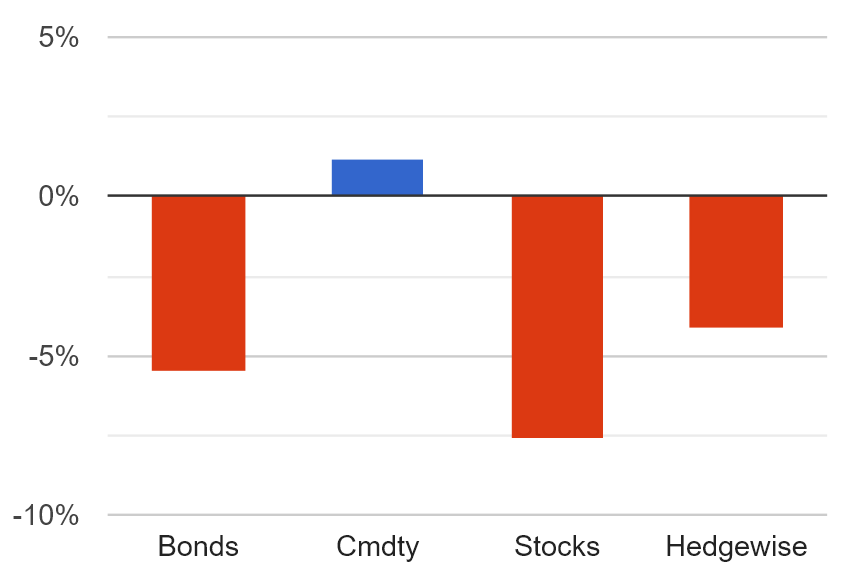
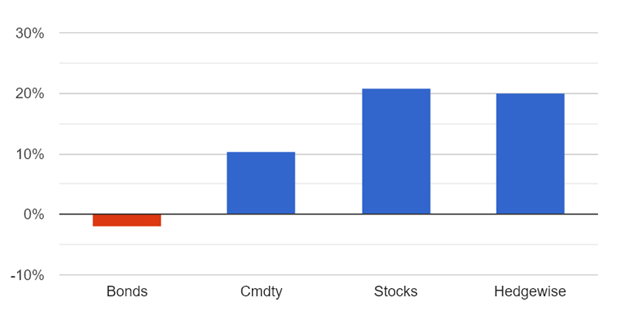
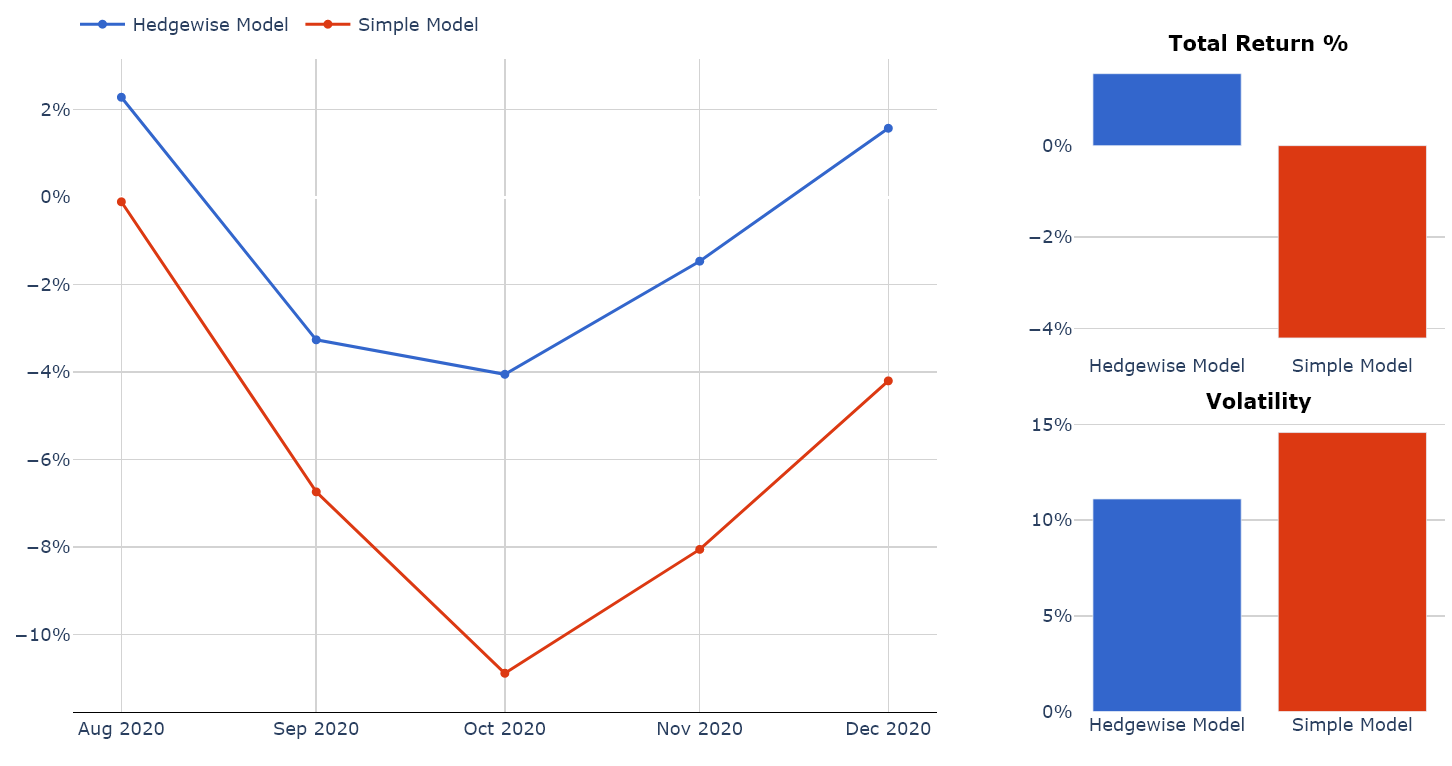
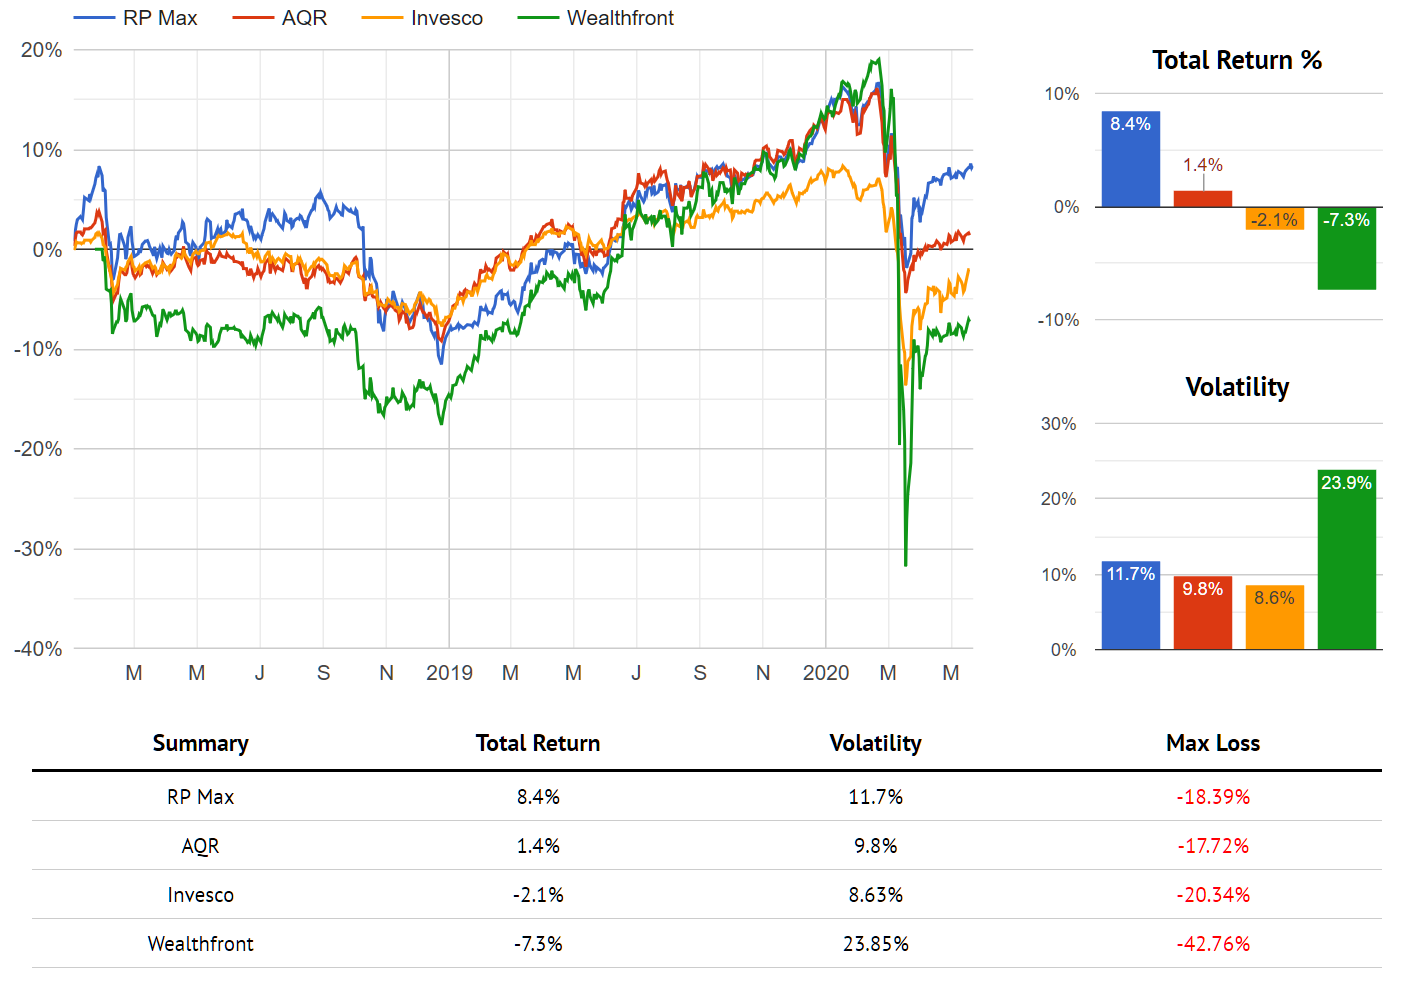
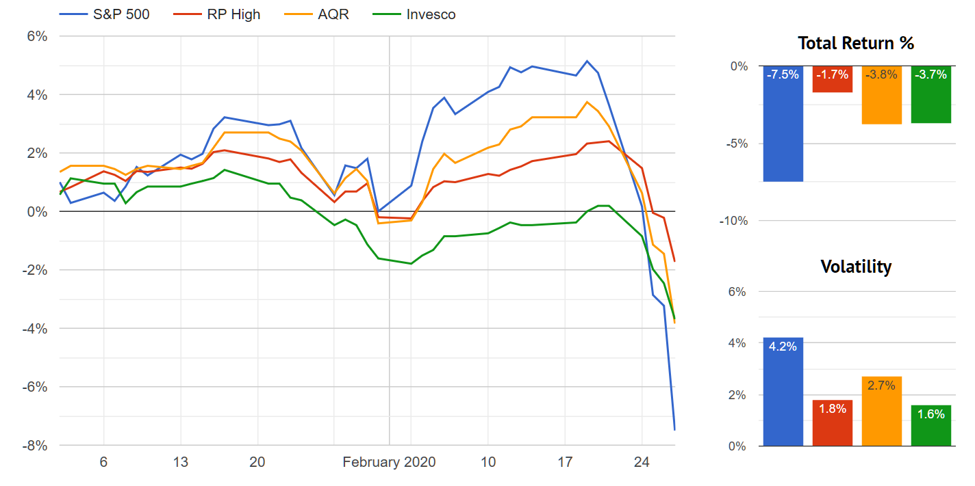
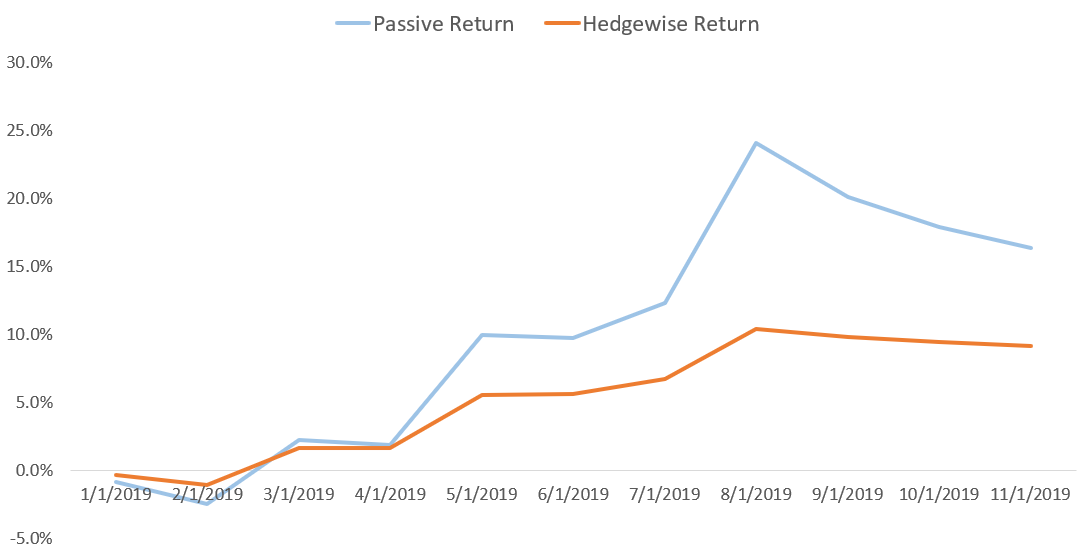
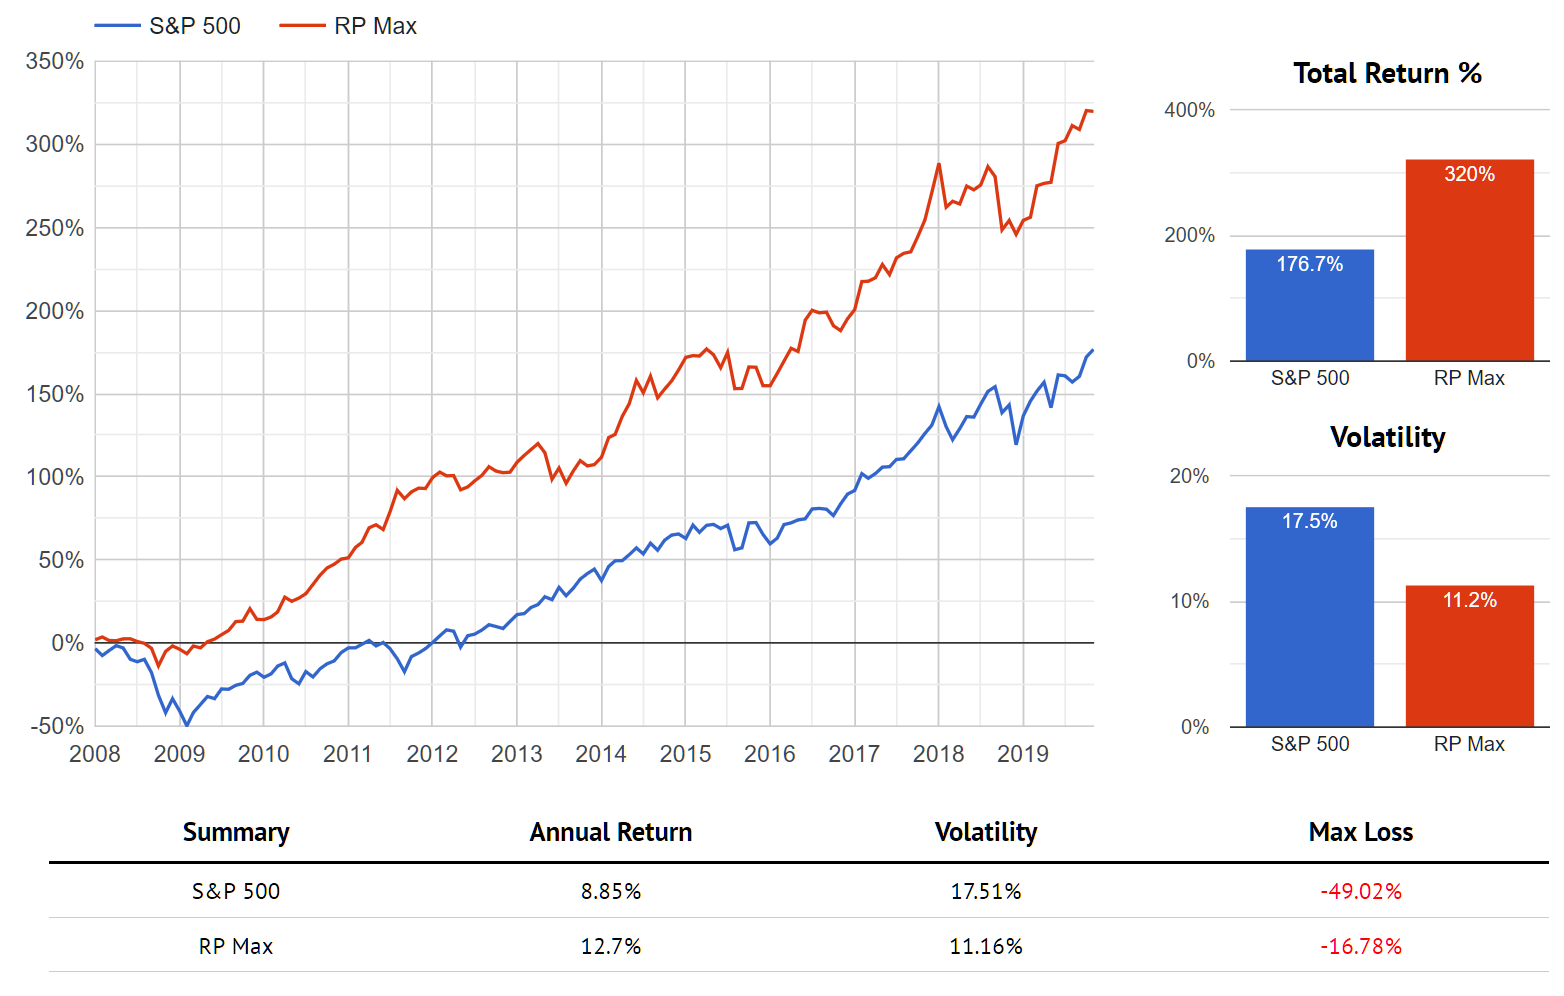
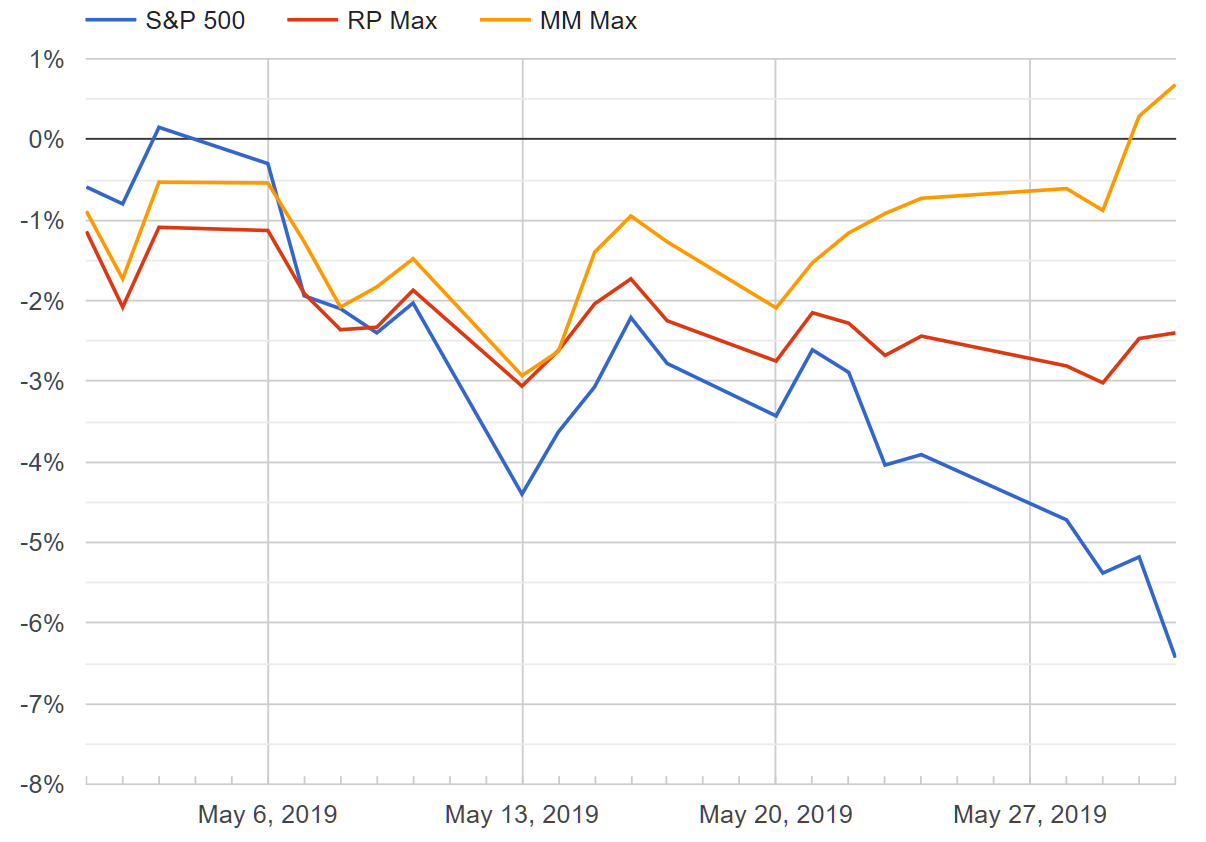
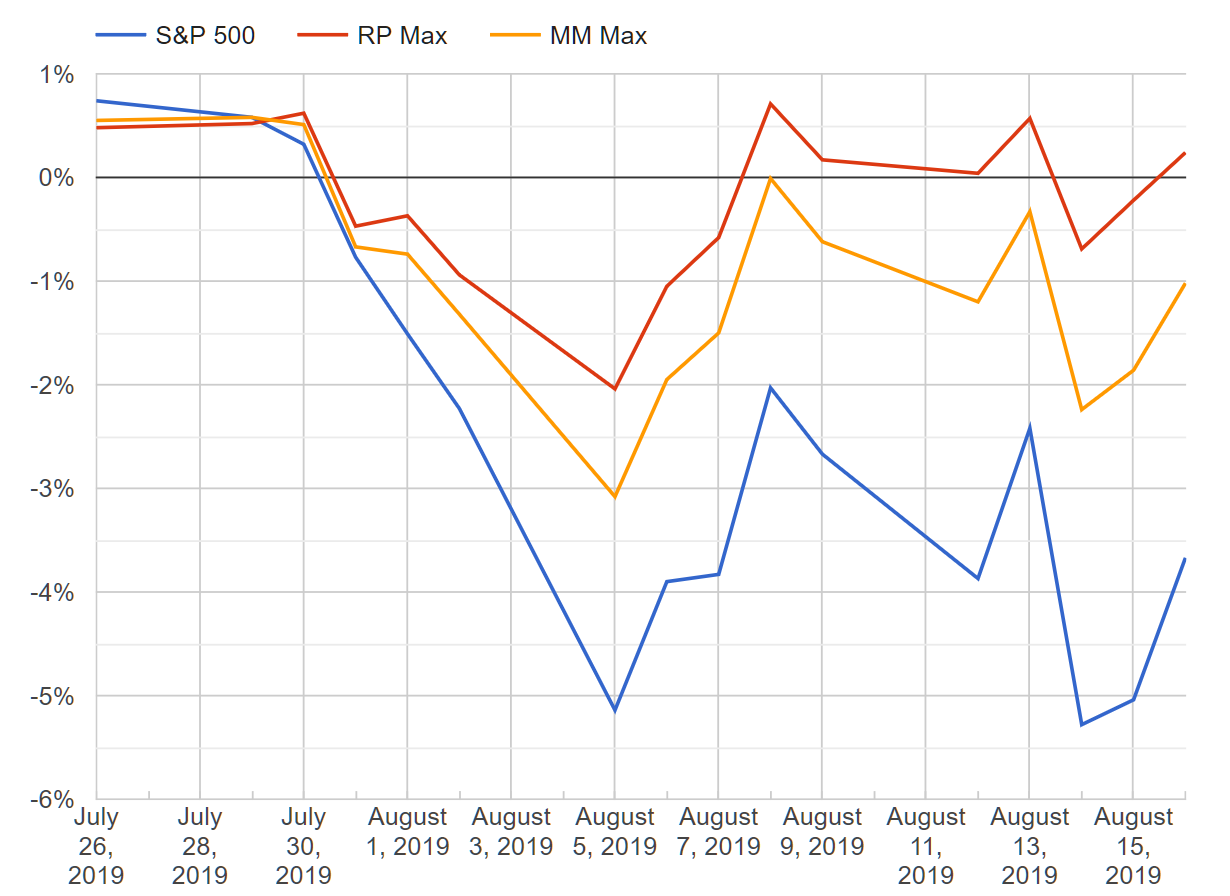
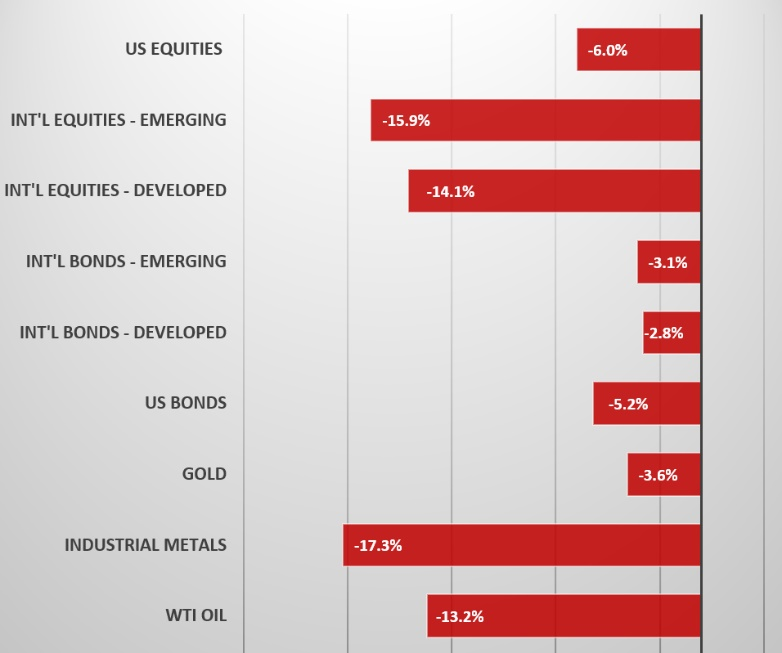
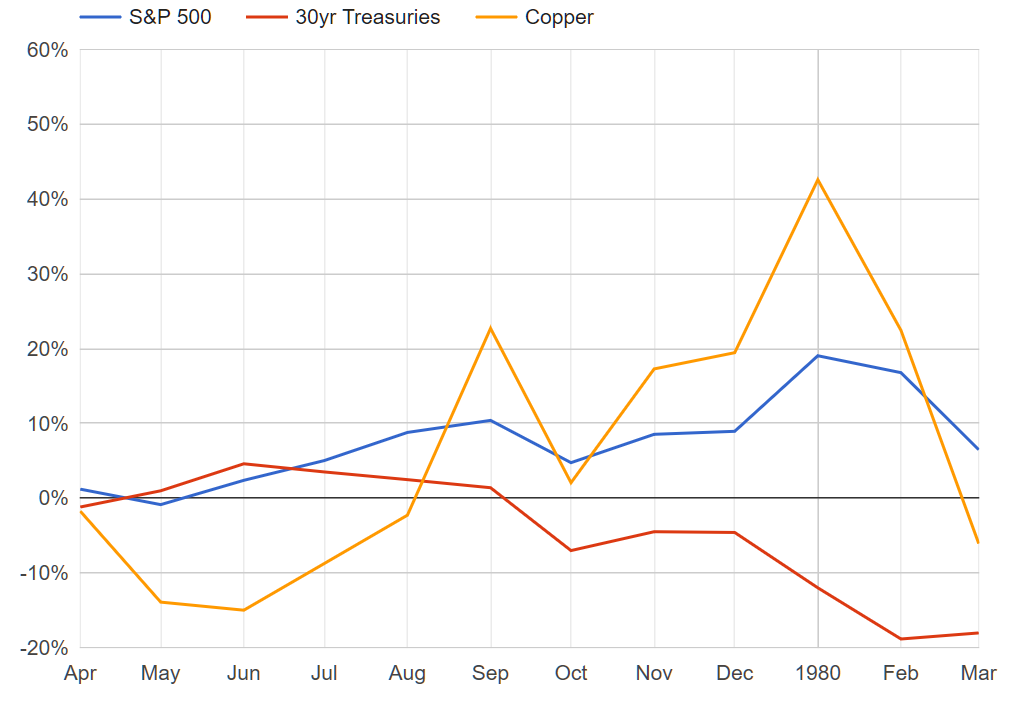
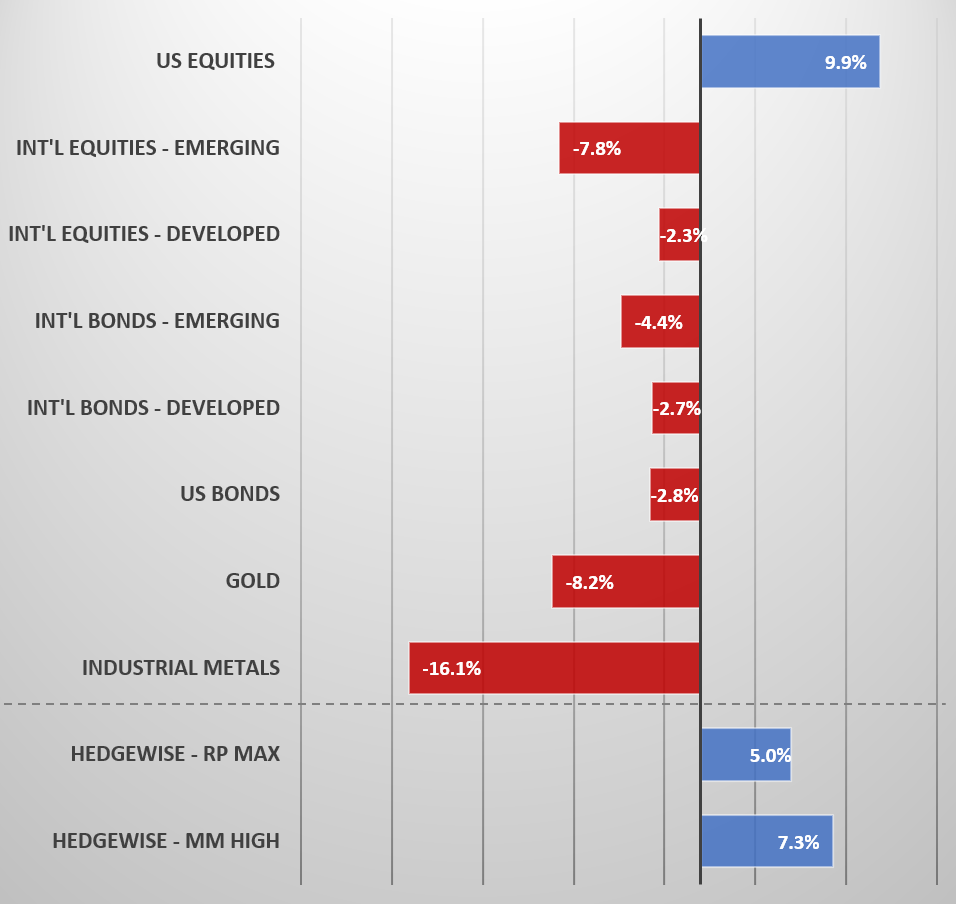
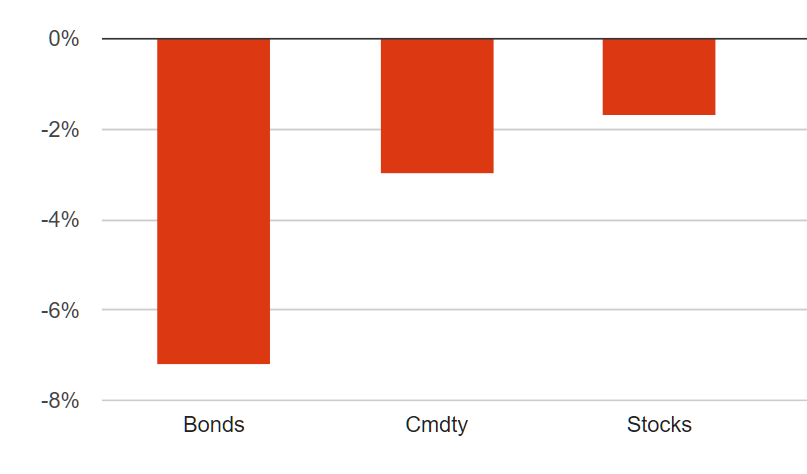
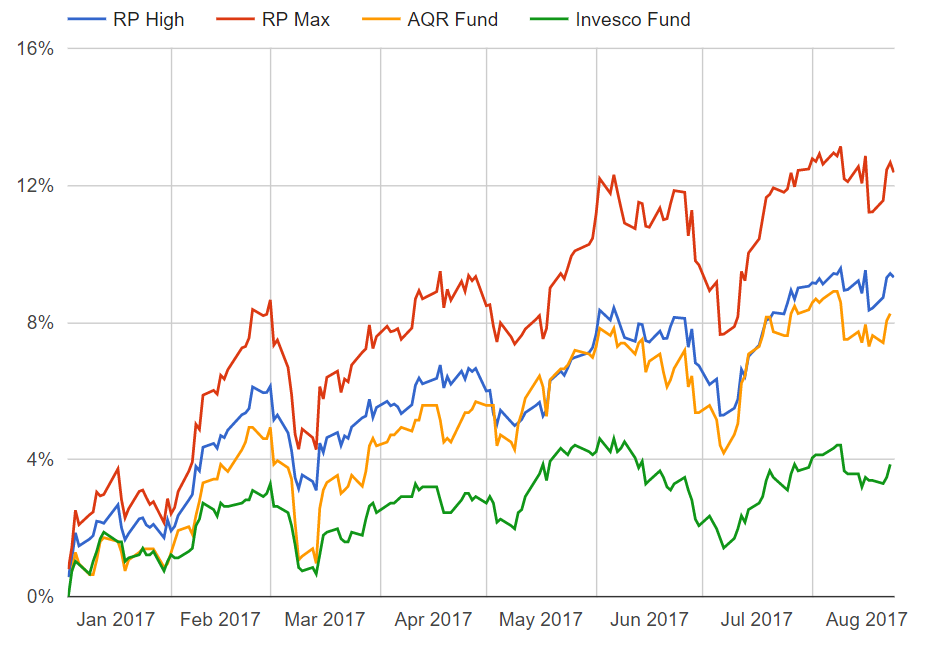
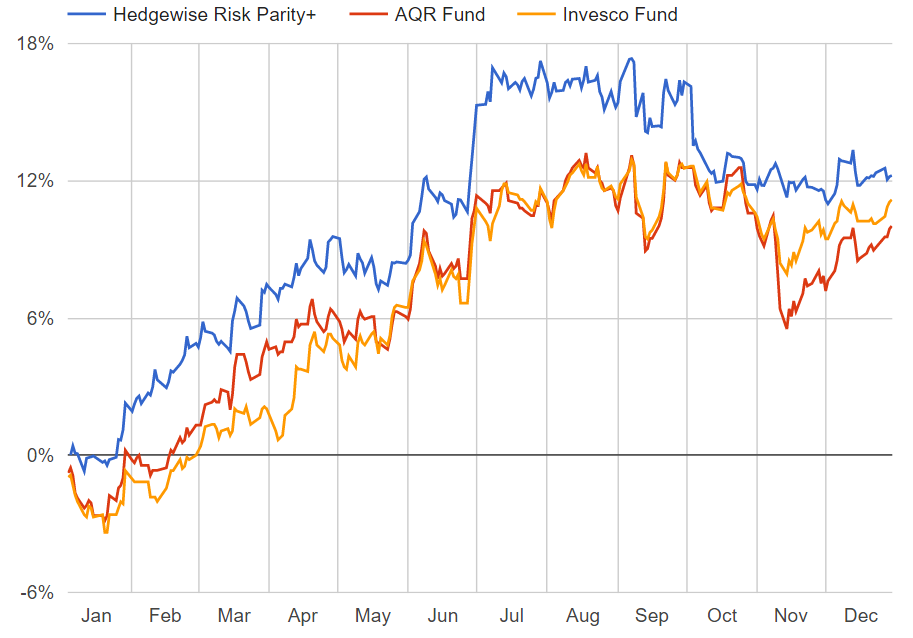
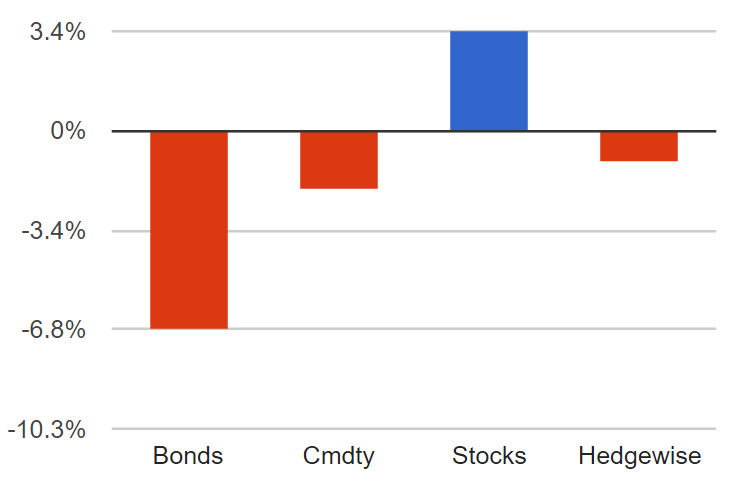
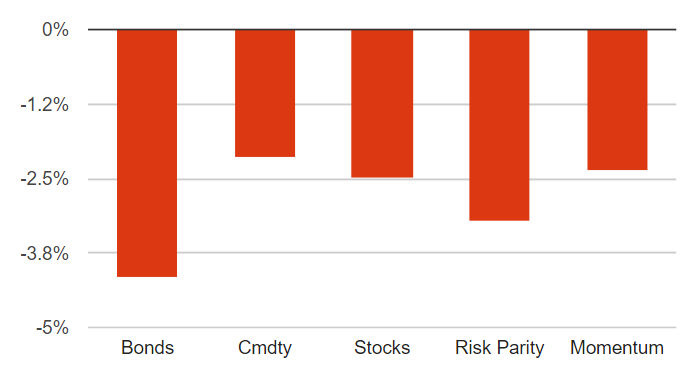
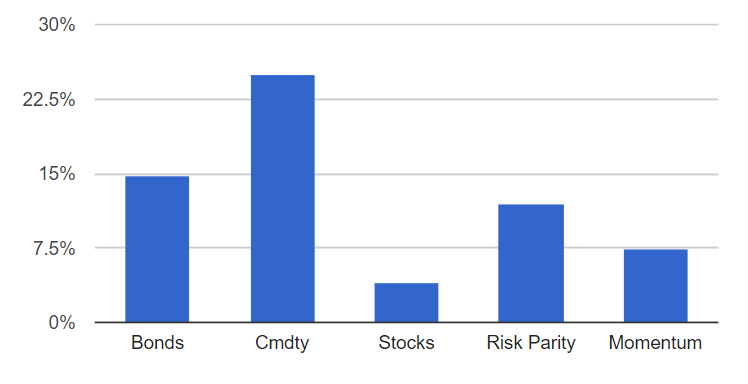
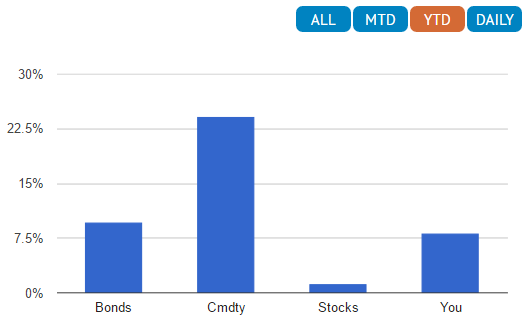
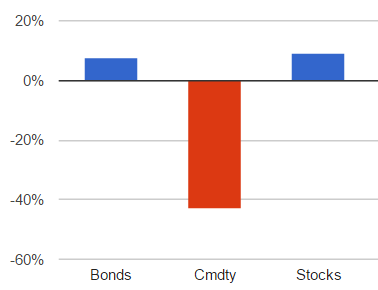
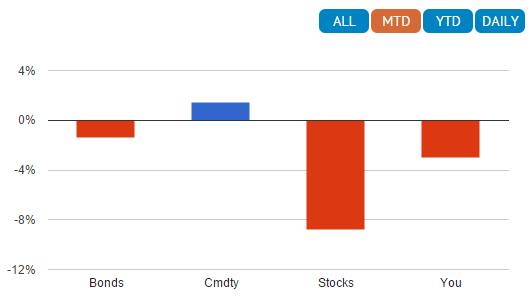
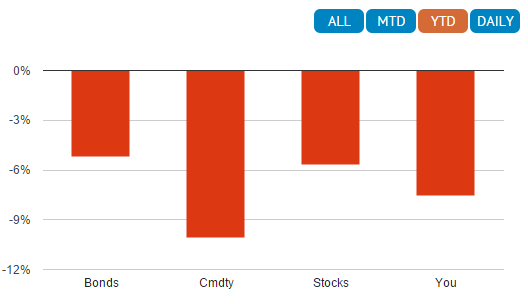
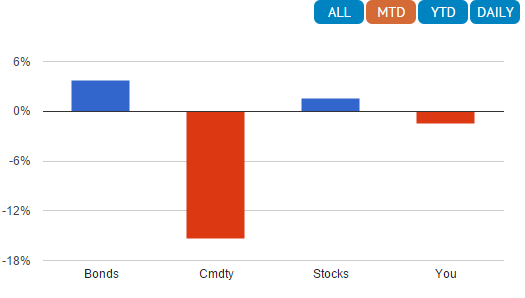
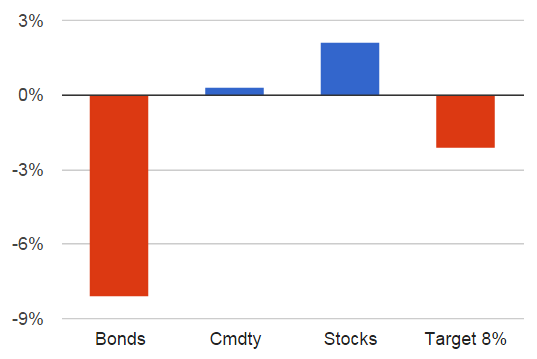
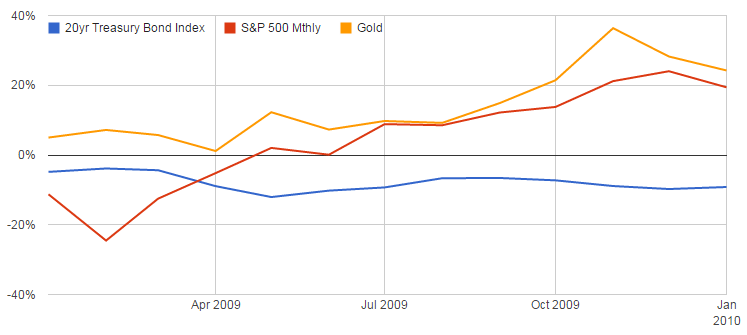
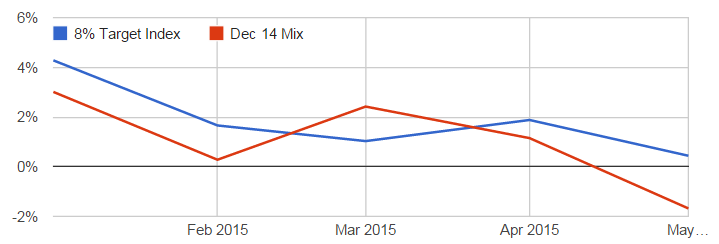
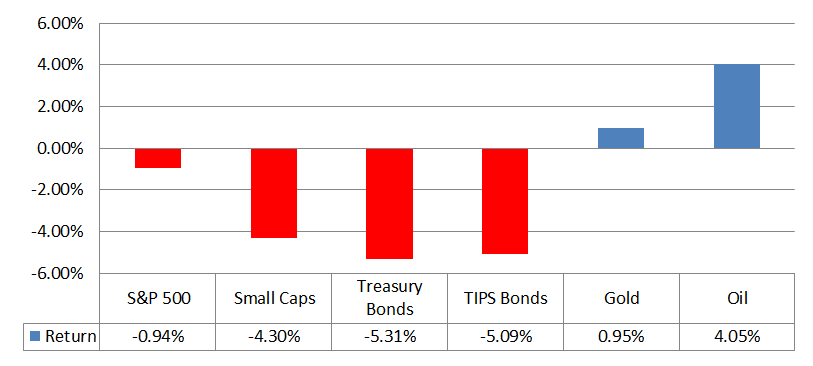
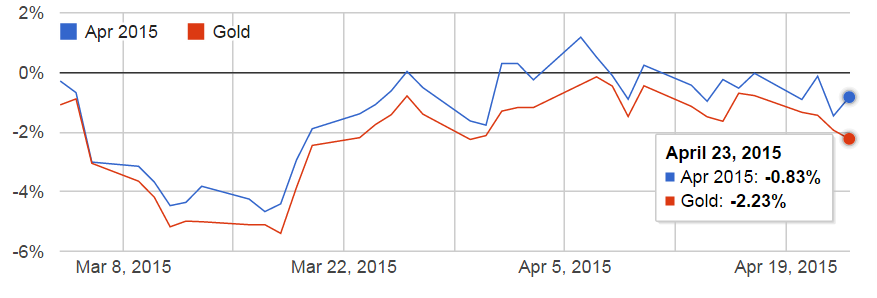
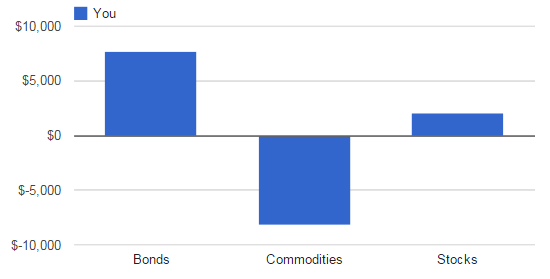
Here is a look at 2024 performance for Hedgewise and the major asset classes.
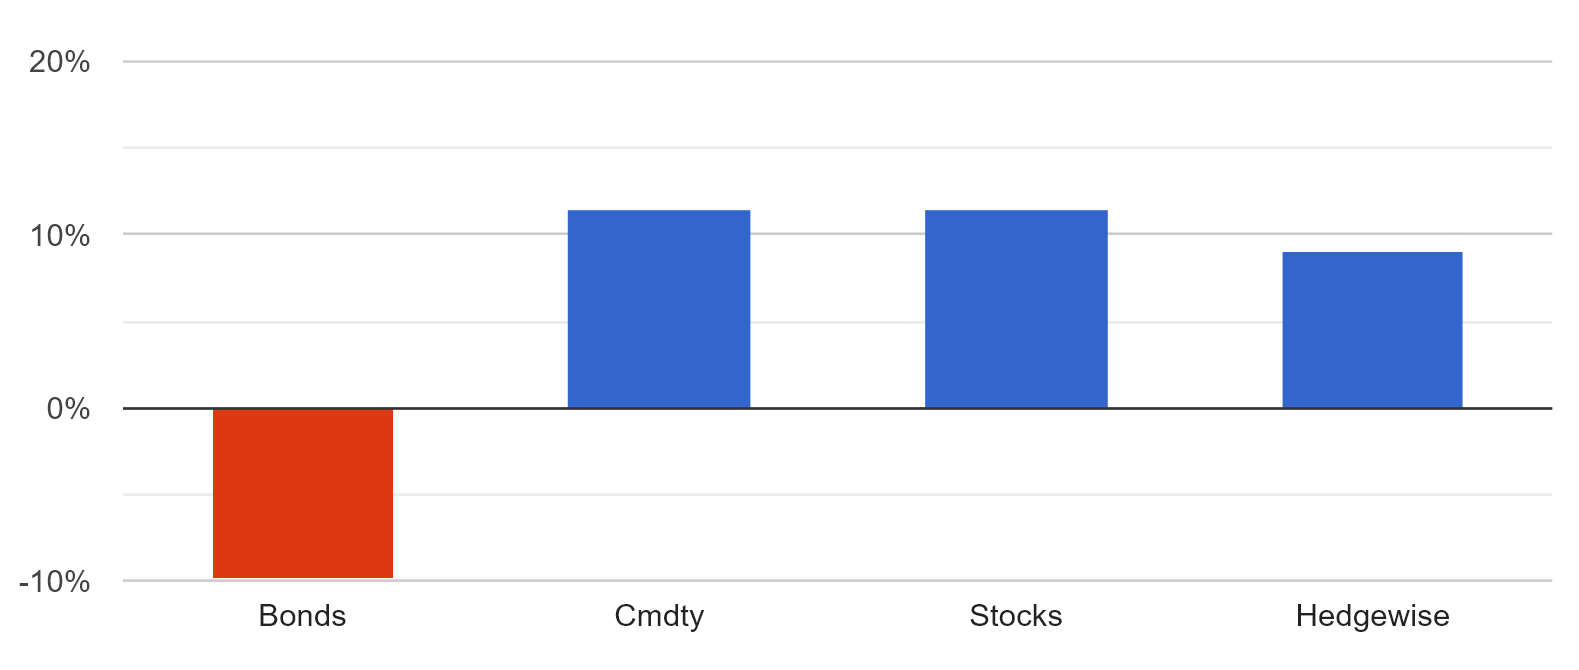
Performance of Hedgewise vs. Major Asset Classes, 2024 YTD
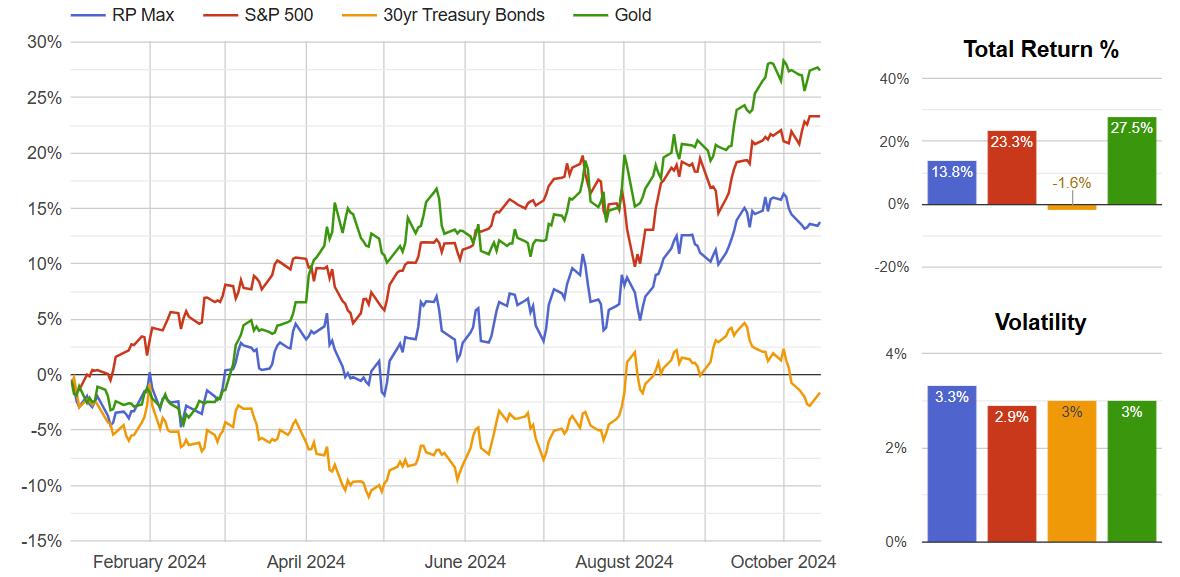
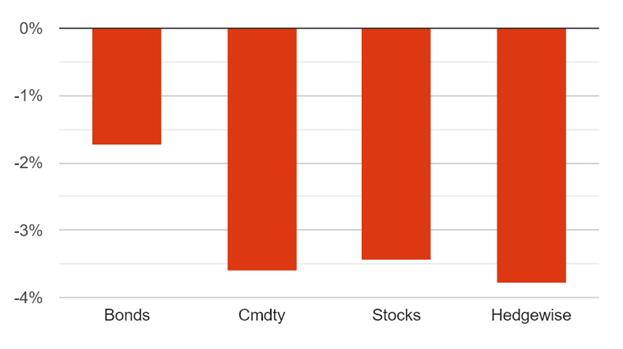
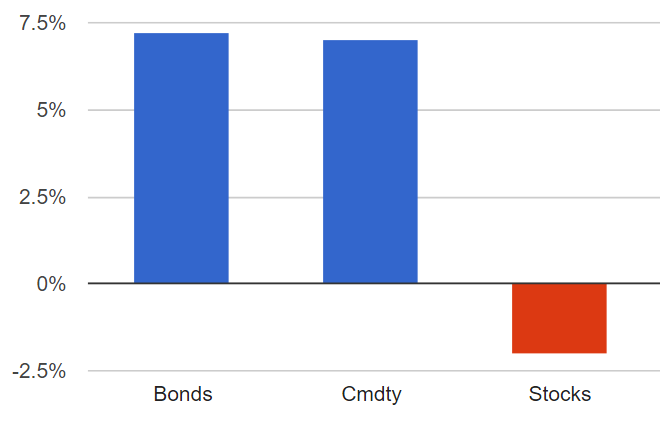
At the start of this year, markets were predicting six cuts by the Federal Reserve and bonds were expected to outperform. That is not what happened, as stocks and gold had big rallies instead. That's fine! The point is not to predict which assets will rally, only that the net impact will be positive for the Risk Parity portfolio.
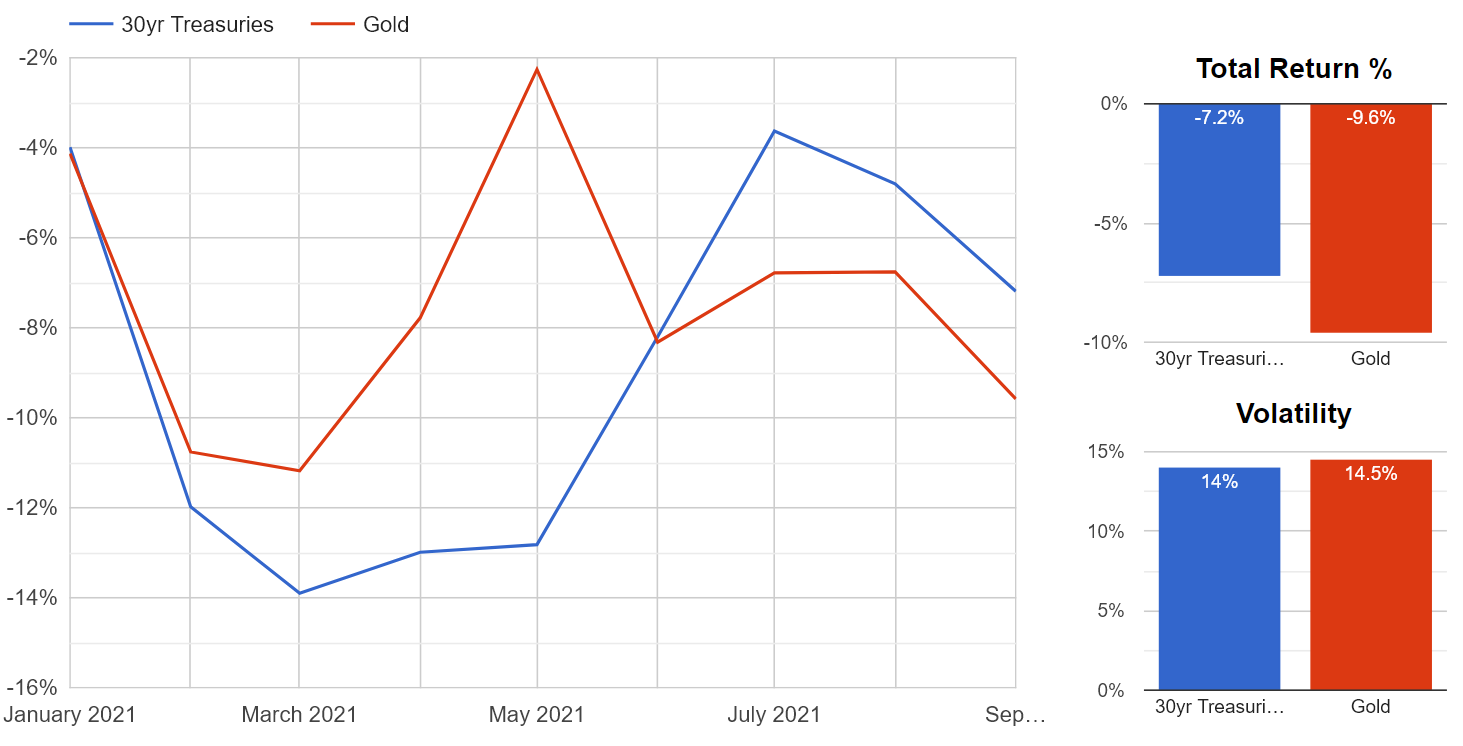
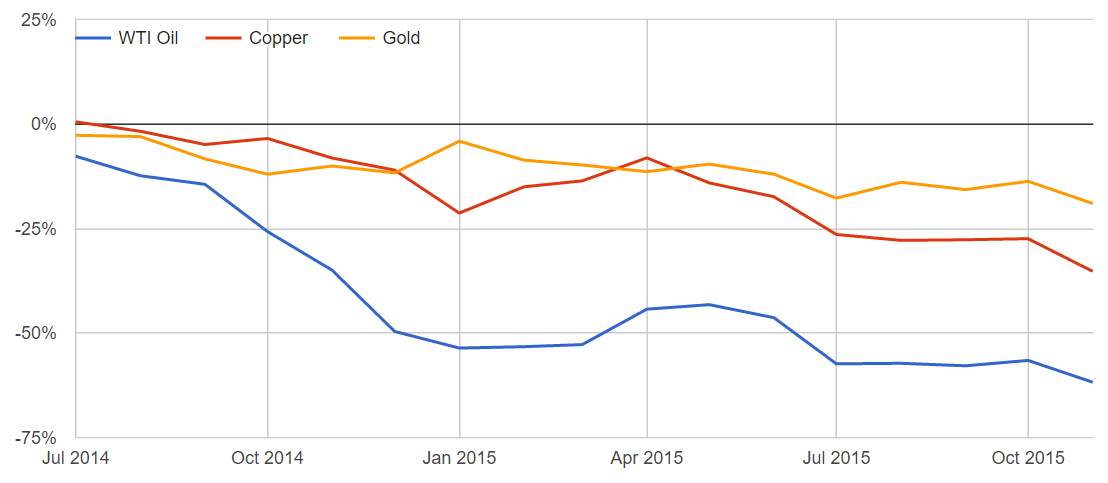
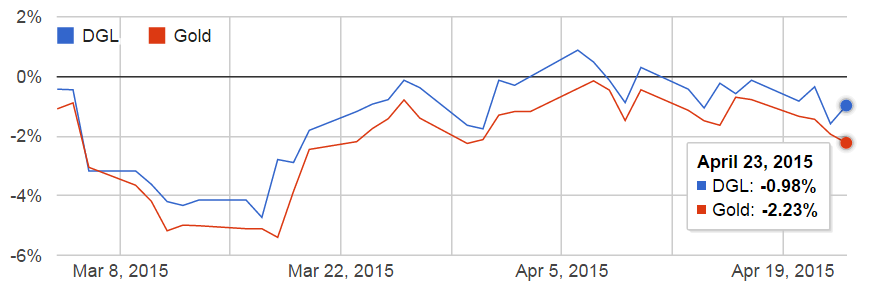
Gold is particularly interesting because it didn’t provide much of a hedge in 2022, though in theory it should have because it is a real asset (the price of which will increase with inflation). Then it suddenly started rallying this year without much of a fundamental explanation. This seems mystifying until placed within the perspective of this broader framework - its price was likely dislocated in the initial 'risk-off' period of Fed hikes, but that was bound to eventually correct.
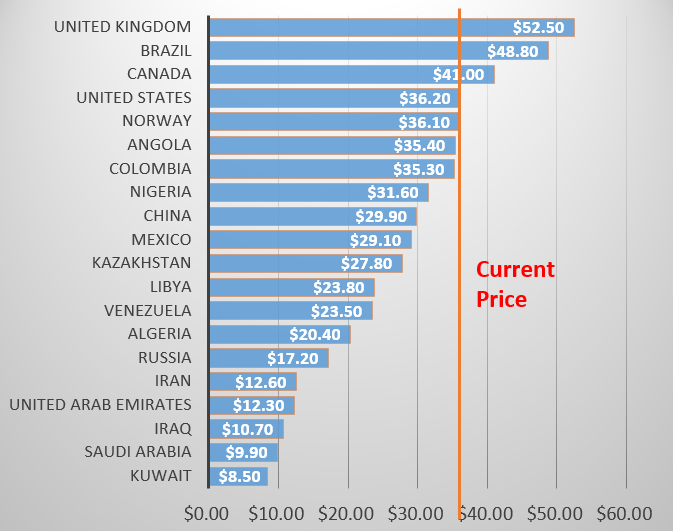
Looking forward, industrial commodities and bonds are the most likely candidates to rally. Copper and energy should benefit from both strong growth and inflation, but those prices have been artificially depressed by the meltdown in China over the past few years. That country is exporting their deflationary problems to the world, and commodity prices are one of the primary ways that is transmitted. If that situation merely stabilizes, there is a high likelihood that copper and energy prices would be 30-50% higher than today.
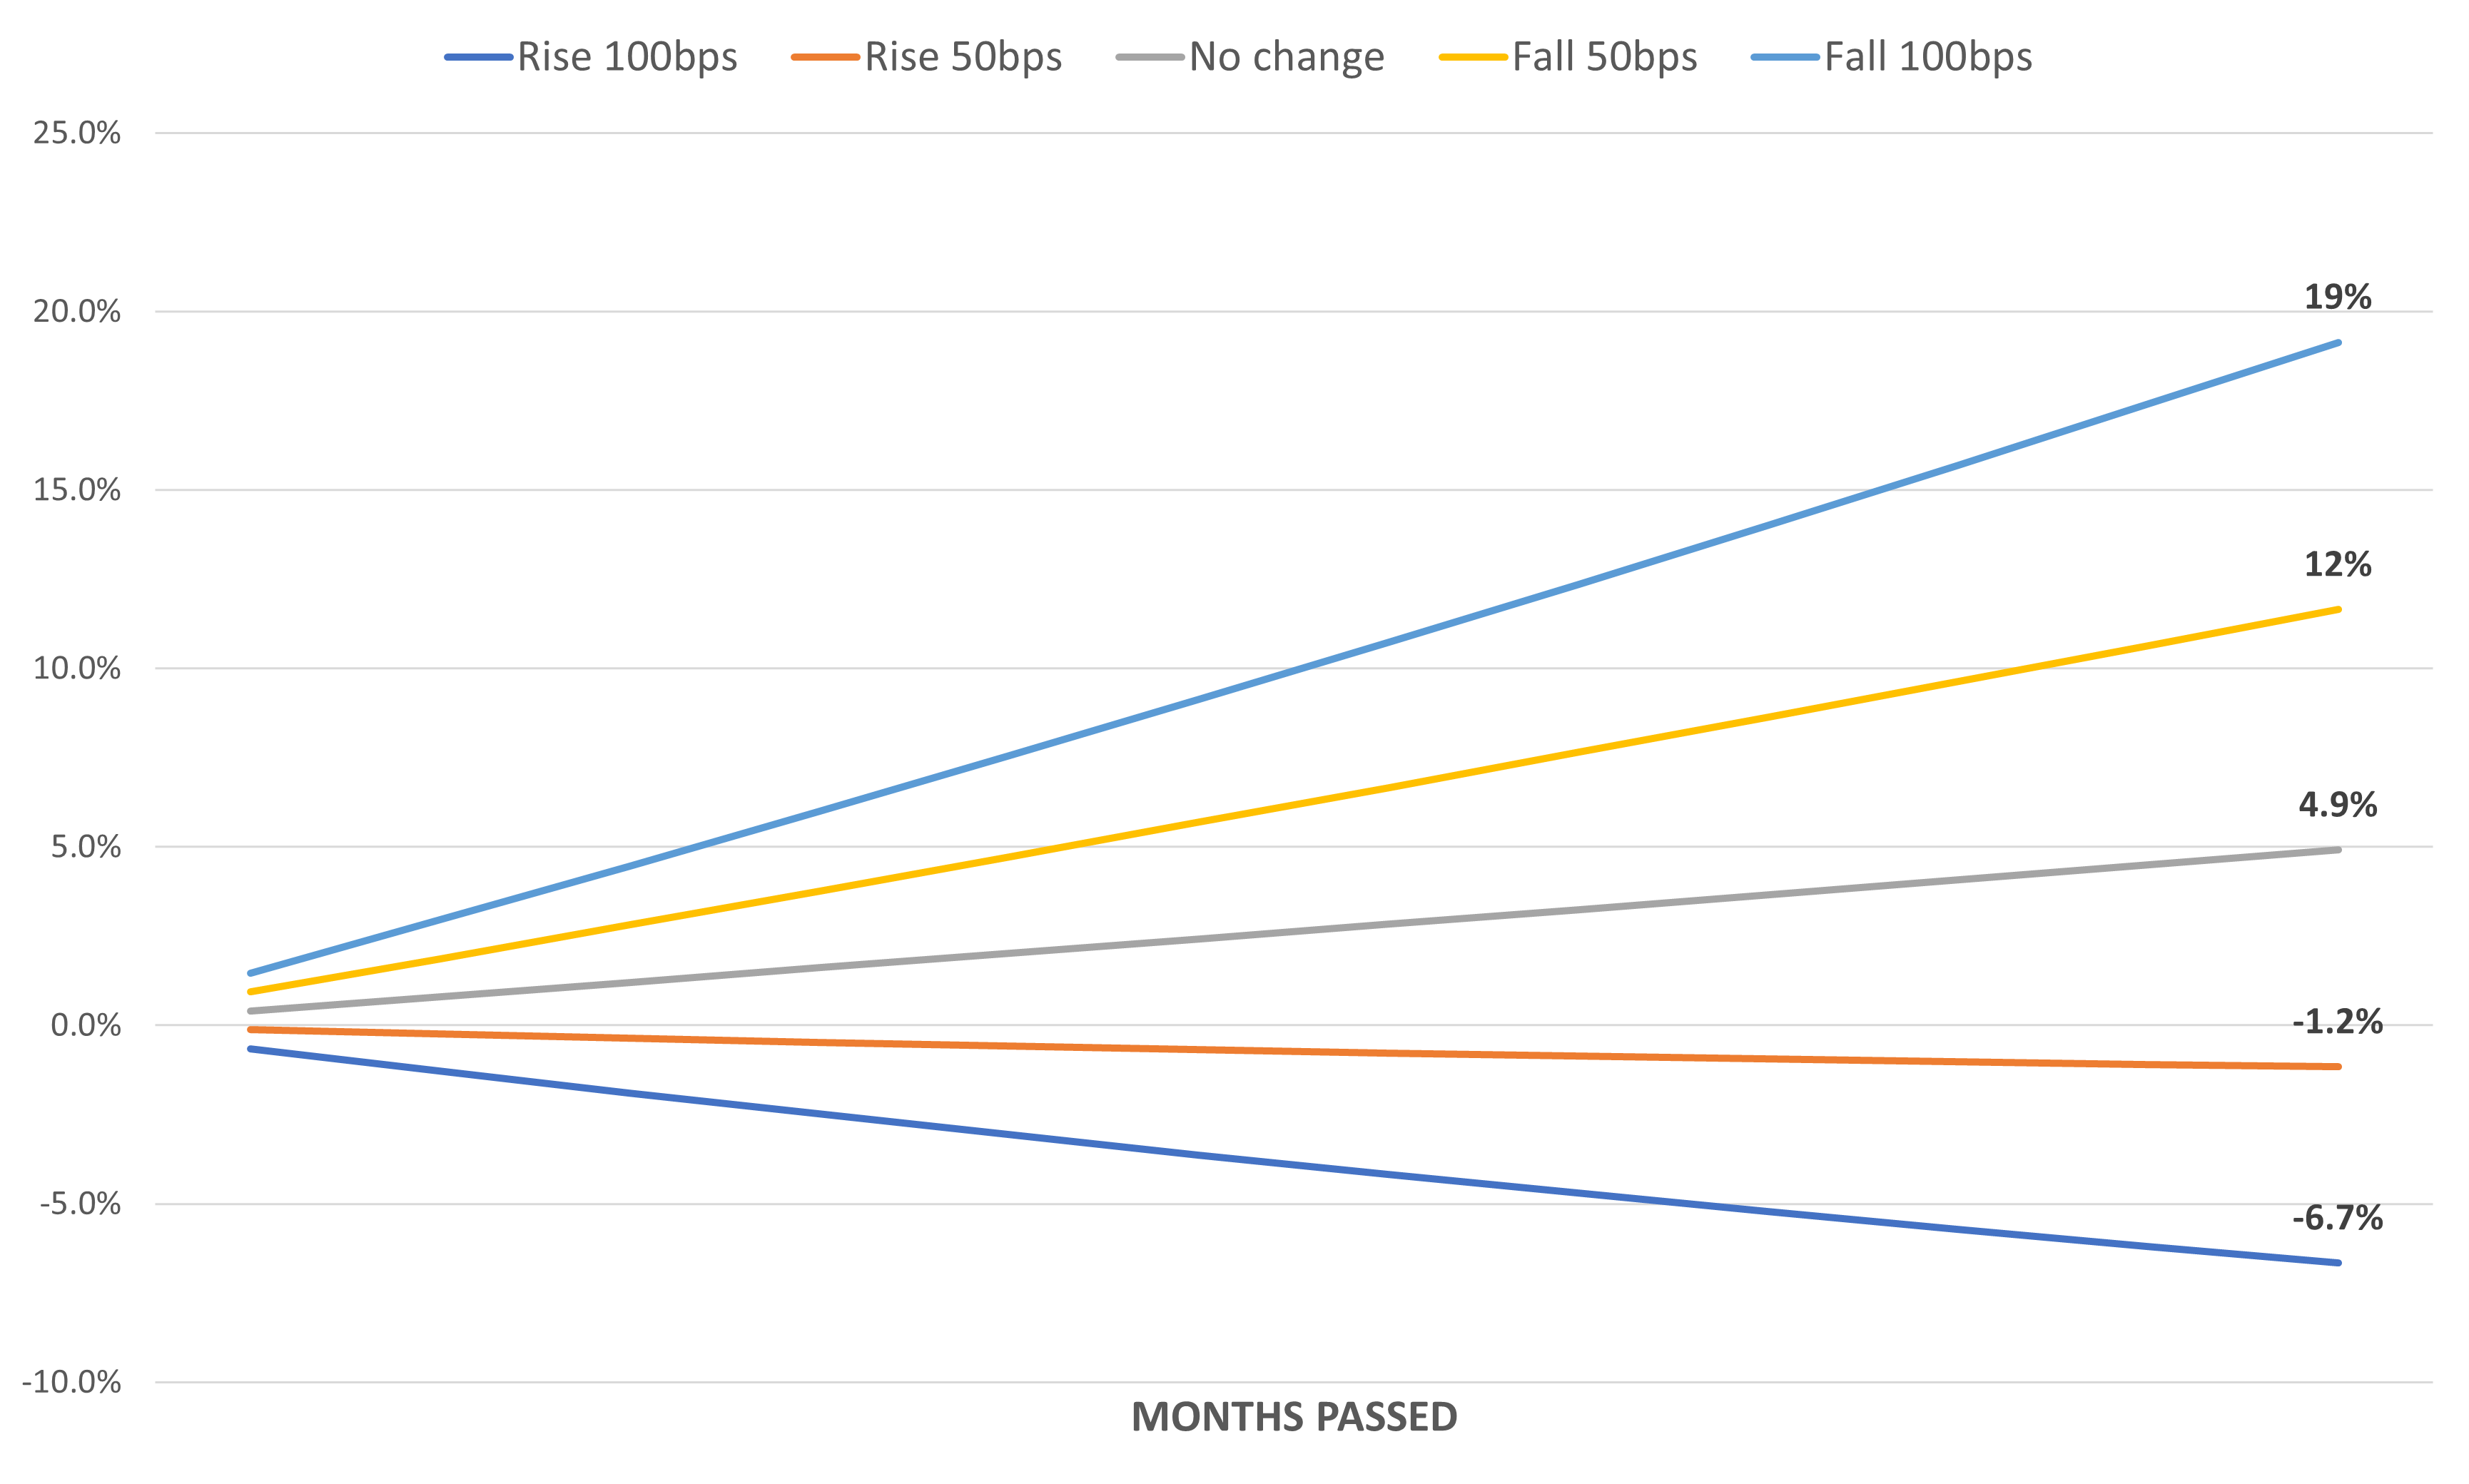
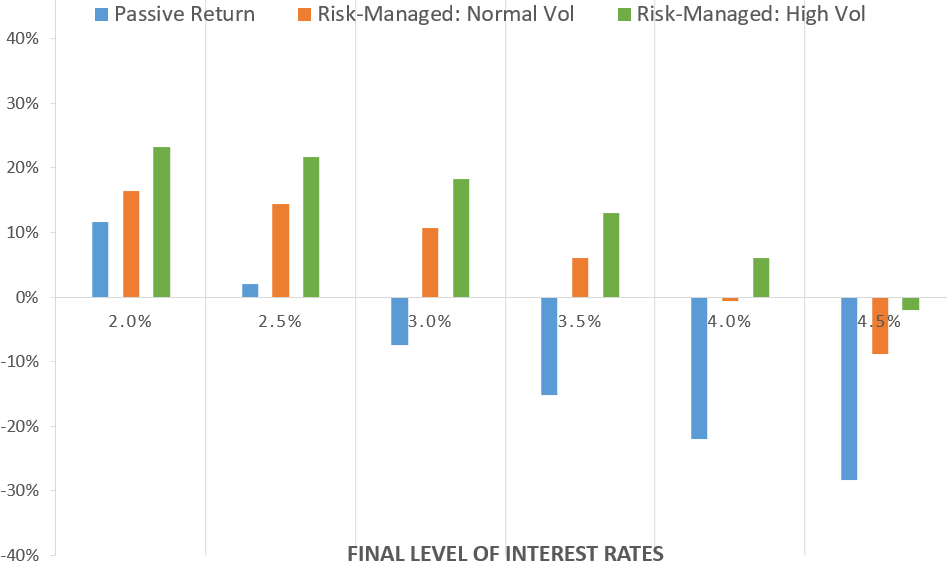
Bonds are an easy call just looking at scenarios. The following table shows the expected return from today for a 30yr Treasury bond by the end of 2026 for a variety of terminal yields.
30yr Interest Rate Scenarios by End of 2026
| Hypothetical 30yr Yield, End of 2026 | Exp. Bond Return |
|---|---|
| 4% | 21.5% |
| 3.75% | 26.6% |
| 3.5% | 32.1% |
For some additional perspective, bonds would still breakeven over this timeframe unless yields rose above ~5.25%. This is incredibly outlandish given that the market is currently pricing in a Fed Funds rate under 3.5% and inflation under 2.5% by 2026. If somehow this materialized, the economy and/or inflation would have to be completely booming, and equities and commodities would drive the recovery instead. Not my base case, but also not that different than how 2024 has turned out.
The much more likely outcome is that any spike in yields will be short-lived and based on little more than risk aversion. The Fed has made several mistakes over the past few years and has currently unanchored long-term bonds by abandoning future forecasting and relying on very short-term and volatile data. This is why yields are jumping around 50bps on minor economic reports, and this volatility alone contributes to higher risk premiums.
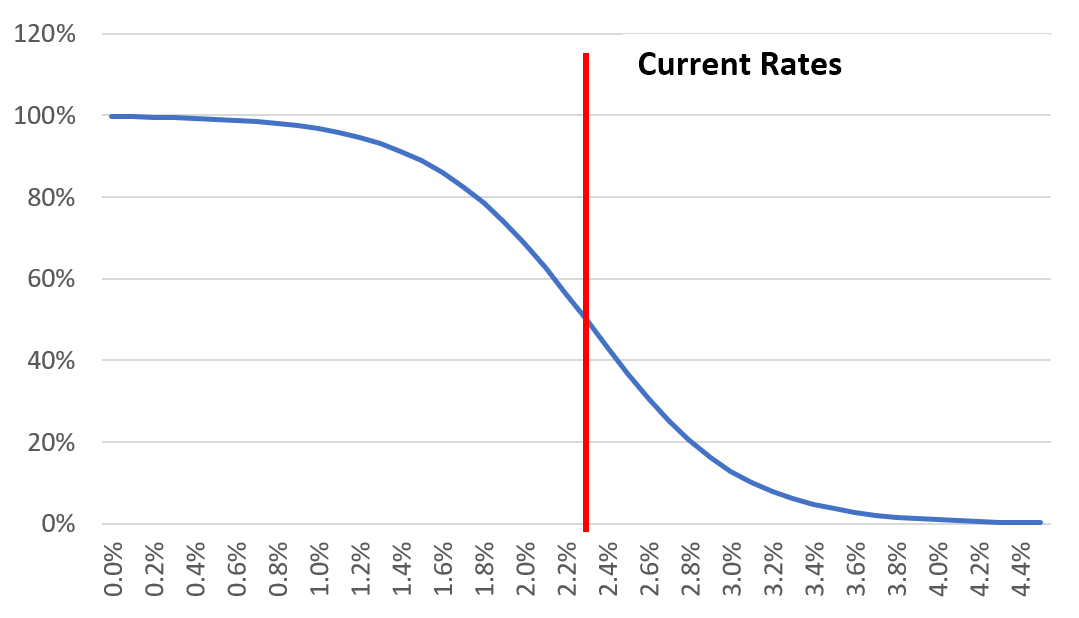
Investors remain wary of bonds because of what happened in 2021 and 2022. Back then, the Fed had promised zero percent interest rates indefinitely and was still engaged in massive quantitative easing. That world of easy money and artificially stimulative interest rates is exactly opposite of the one we face now. Rates are severely restrictive and we are amidst quantitative tightening. The chance of yields staying above 4.5% for long now is about the same as staying under 2% back in 2020. Yet the memory of 2022, in combination with the heavily data-dependent Fed, contributes to a fragile environment where these yield spikes remain possible despite not being meaningful.
Final Thoughts: Evaluating Risk Parity and Hedgewise
Any sustained period of drawdown will generate doubts for investors, and there have been natural questions about whether something has gone 'wrong' with the Risk Parity framework since 2022. This is kind of silly because the passive form is just a mix of equities, bonds, and commodities. If those assets appreciate over time, so will Risk Parity. If the portfolio has a drawdown, it means one or more of those assets is inexpensive. Abandoning Risk Parity now would be akin to abandoning the stock market right after the dot-com crash or the Lehman crisis.
Specifically, bond yields are higher and more restrictive than any time in the past twenty years. Many commodities have failed to appreciate despite the recent surge of inflation. These facts suggest that both asset classes are fantastic investments at present, not that they should be abandoned. Five years from now, it is likely that current prices will look like strange dislocations, just like gold looked in 2022 before its recent catch-up rally.
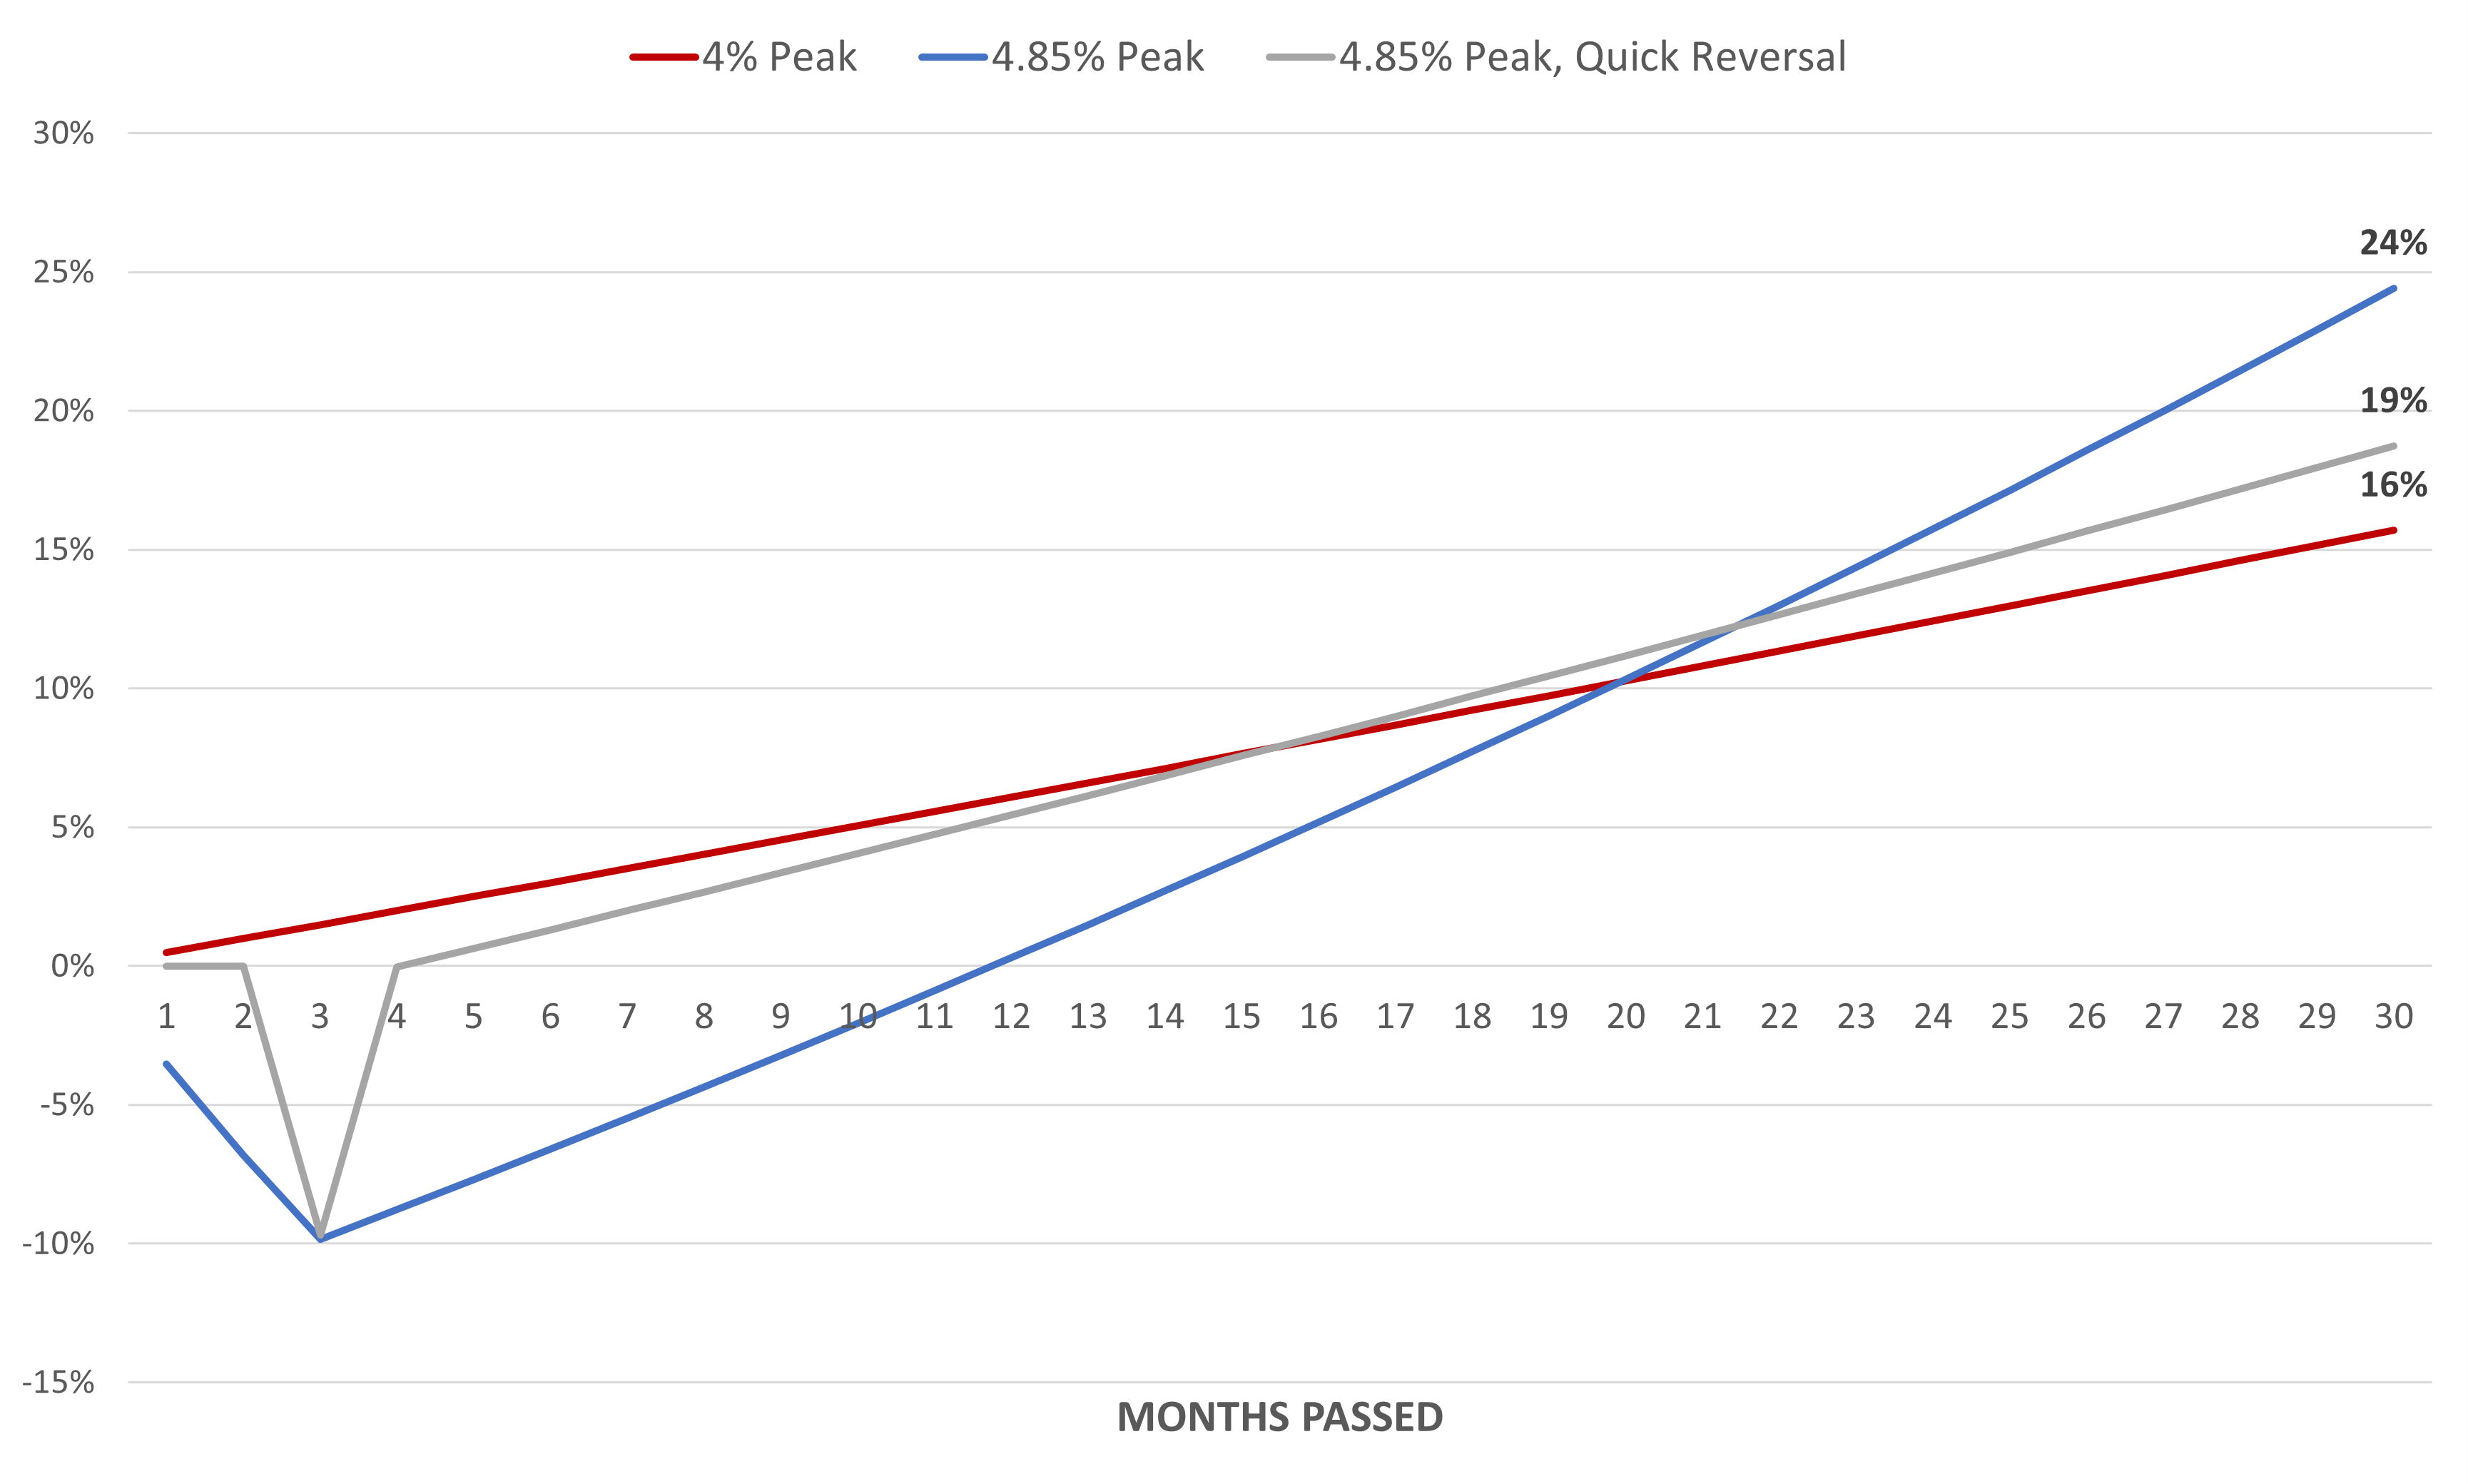
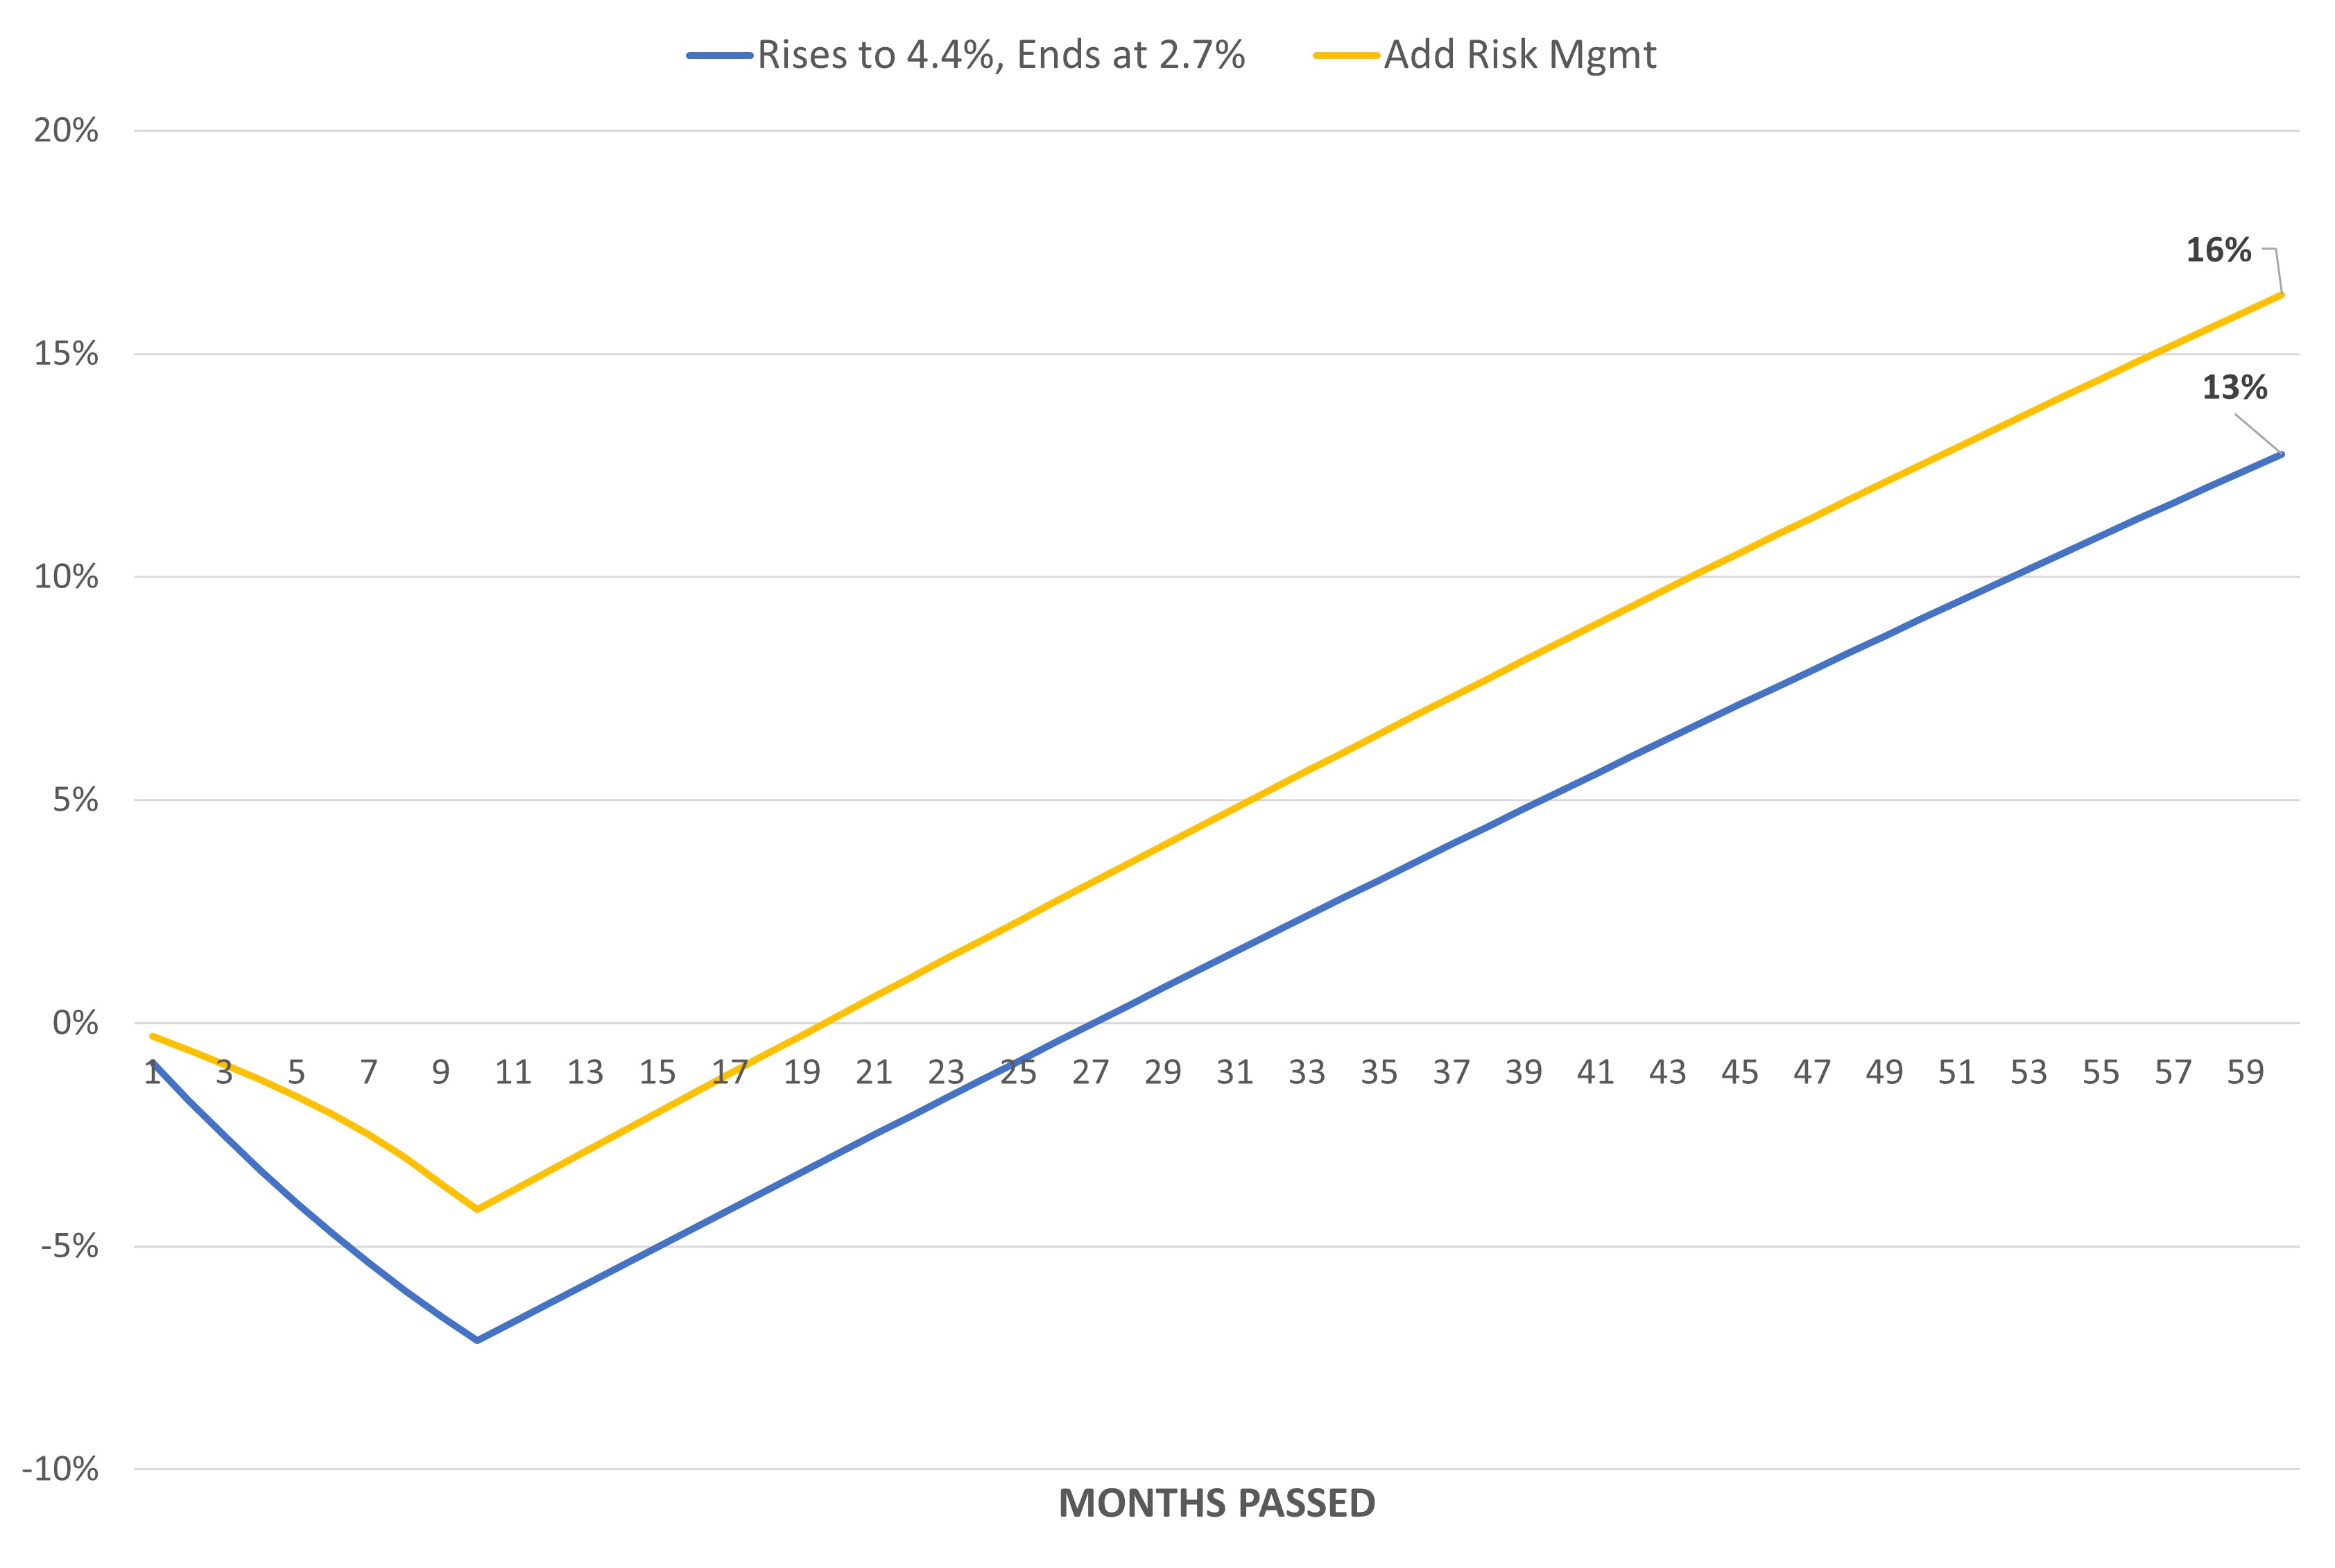
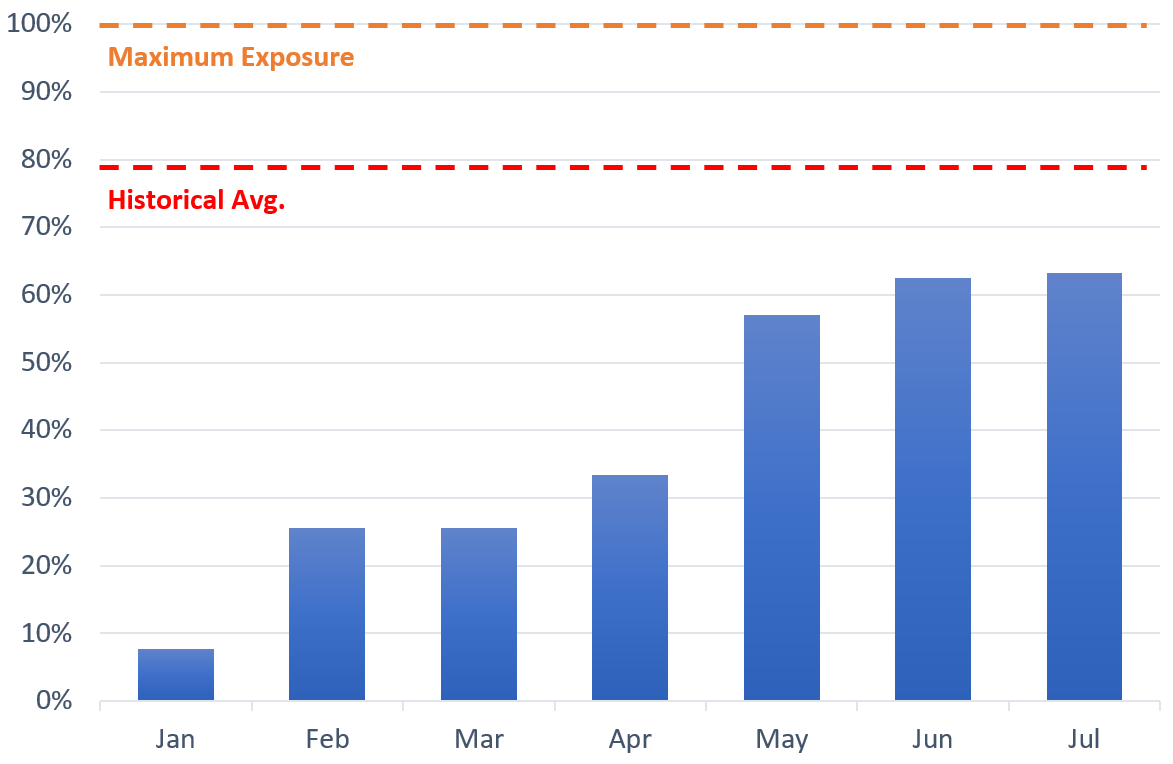
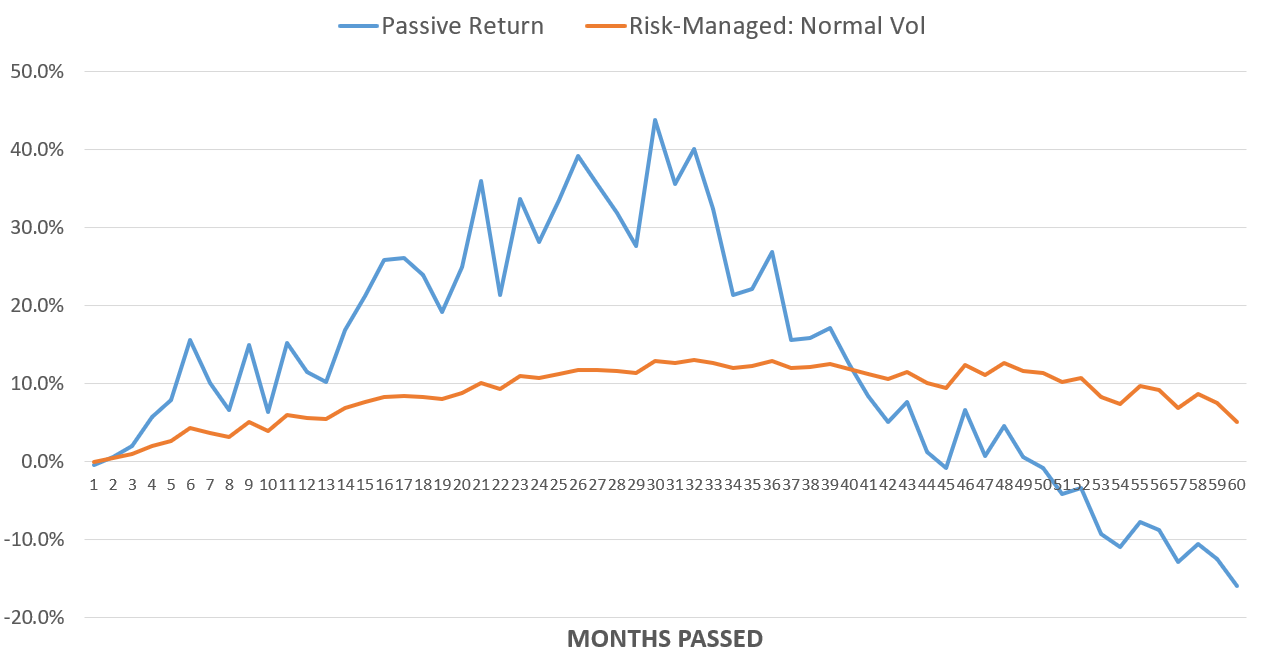
Any Risk Parity drawdown is driven by this same pattern, and Hedgewise seeks to systematically outperform by limiting losses when it happens. Ideally, if the passive version were down 10%, Hedgewise would be down only half of that. When it recovers, Hedgewise would have a 5% gain. To the extent this happens over a short timeframe, it is easy to track and understand.
Since 2022, the passive version has lost as much as 40%, and Hedgewise did approximately cut that in half. This should eventually be worth 25% of extra gains, which will represent one of the most successful periods of risk management ever. But it has been harder to recognize this as a success due to the sheer size of the drawdown and the length of time it has taken to recover.
Any Hedgewise clients that have simply held since January 2022 will reap this reward, and chances are high that it will happen in the next 1-2 years. In the bigger scheme of the strategy framework, this has all gone pretty much how it is supposed to go. It has taken a little longer than usual to get here, but this last part where asset prices recover should be the most fun.
Disclosure
This information does not constitute investment advice or an offer to invest or to provide management services and is subject to correction, completion and amendment without notice. Hedgewise makes no warranties and is not responsible for your use of this information or for any errors or inaccuracies resulting from your use. Hedgewise may recommend some of the investments mentioned in this article for use in its clients' portfolios. Past performance is no indicator or guarantee of future results. Investing involves risk, including the risk of loss. All performance data shown prior to the inception of each Hedgewise framework (Risk Parity in October 2014, Momentum in November 2016) is based on a hypothetical model and there is no guarantee that such performance could have been achieved in a live portfolio, which would have been affected by material factors including market liquidity, bid-ask spreads, intraday price fluctuations, instrument availability, and interest rates. Model performance data is based on publicly available index or asset price information and all dividend or coupon payments are included and assumed to be reinvested monthly. Hedgewise products have substantially different levels of volatility and exposure to separate risk factors, such as commodity prices and the use of leverage via derivatives, compared to traditional benchmarks like the S&P 500. Any comparisons to benchmarks are provided as a generic baseline for a long-term investment portfolio and do not suggest that Hedgewise products will exhibit similar characteristics. When live client data is shown, it includes all fees, commissions, and other expenses incurred during management. Only performance figures from the earliest live client accounts available or from a composite average of all client accounts are used. Other accounts managed by Hedgewise will have performed slightly differently than the numbers shown for a variety of reasons, though all accounts are managed according to the same underlying strategy model. Hedgewise relies on sophisticated algorithms which present technological risk, including data availability, system uptime and speed, coding errors, and reliance on third party vendors.

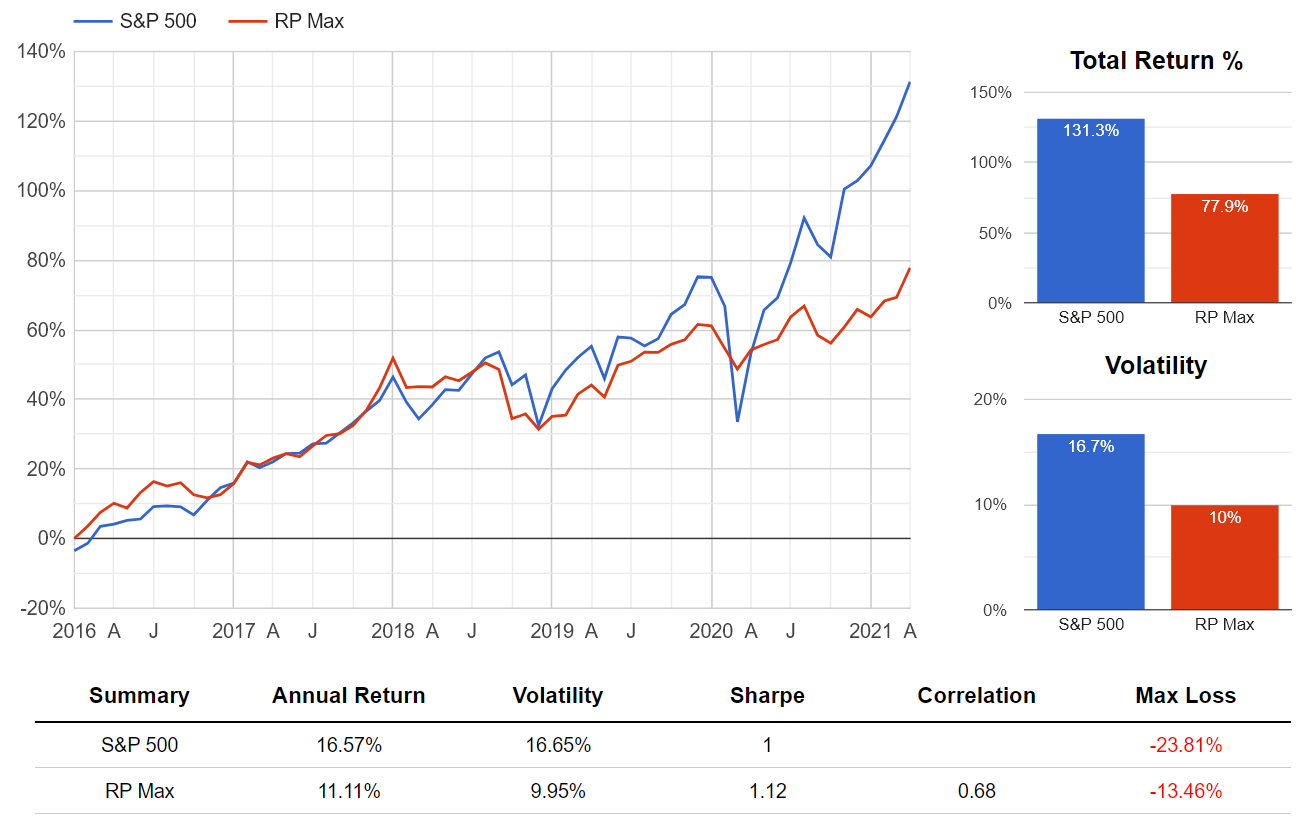
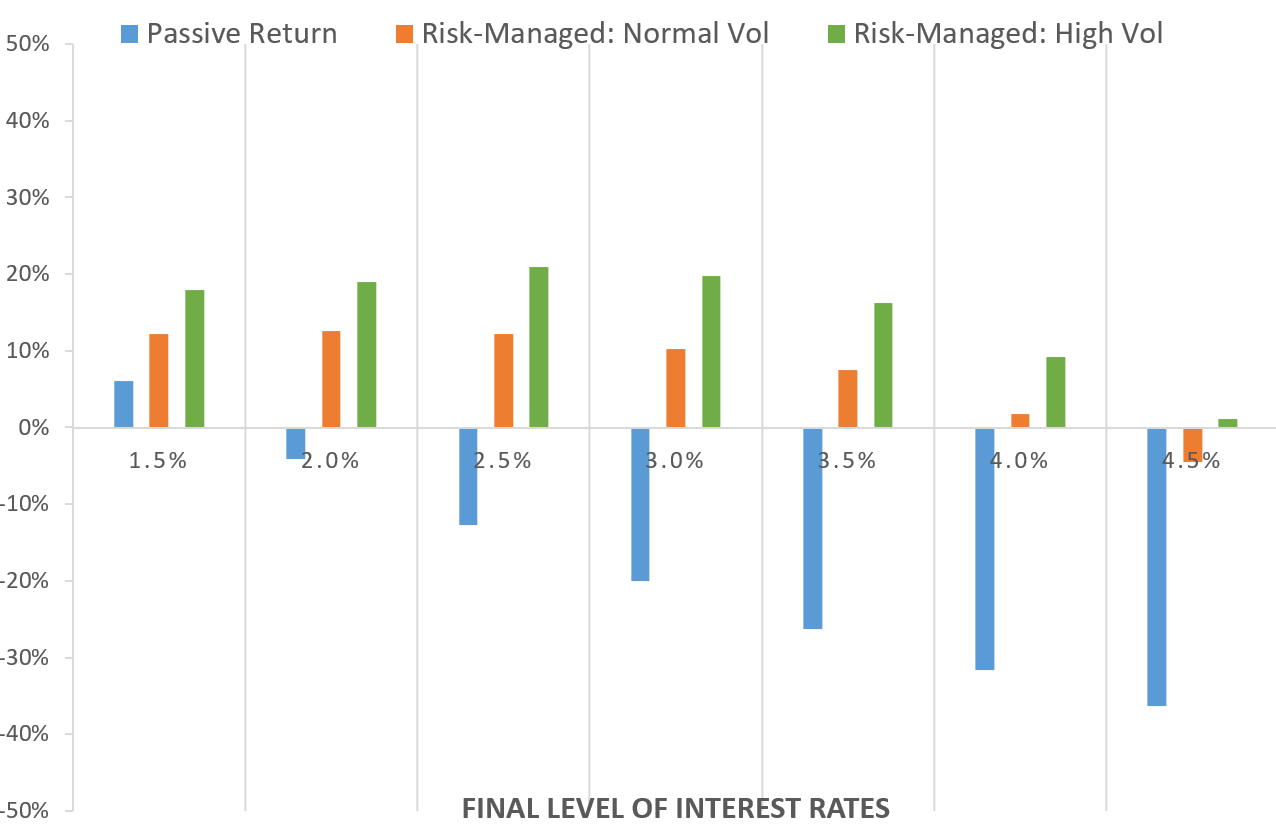
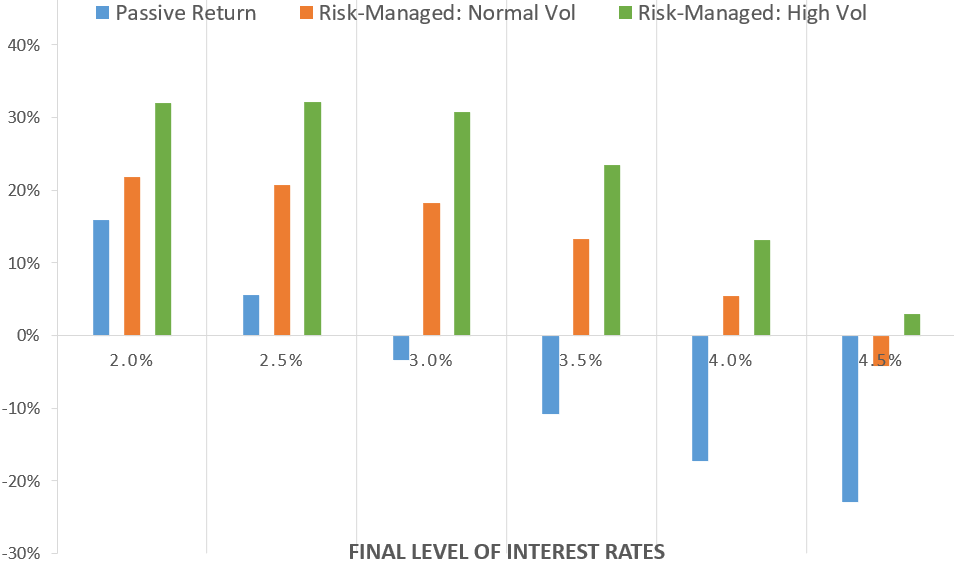
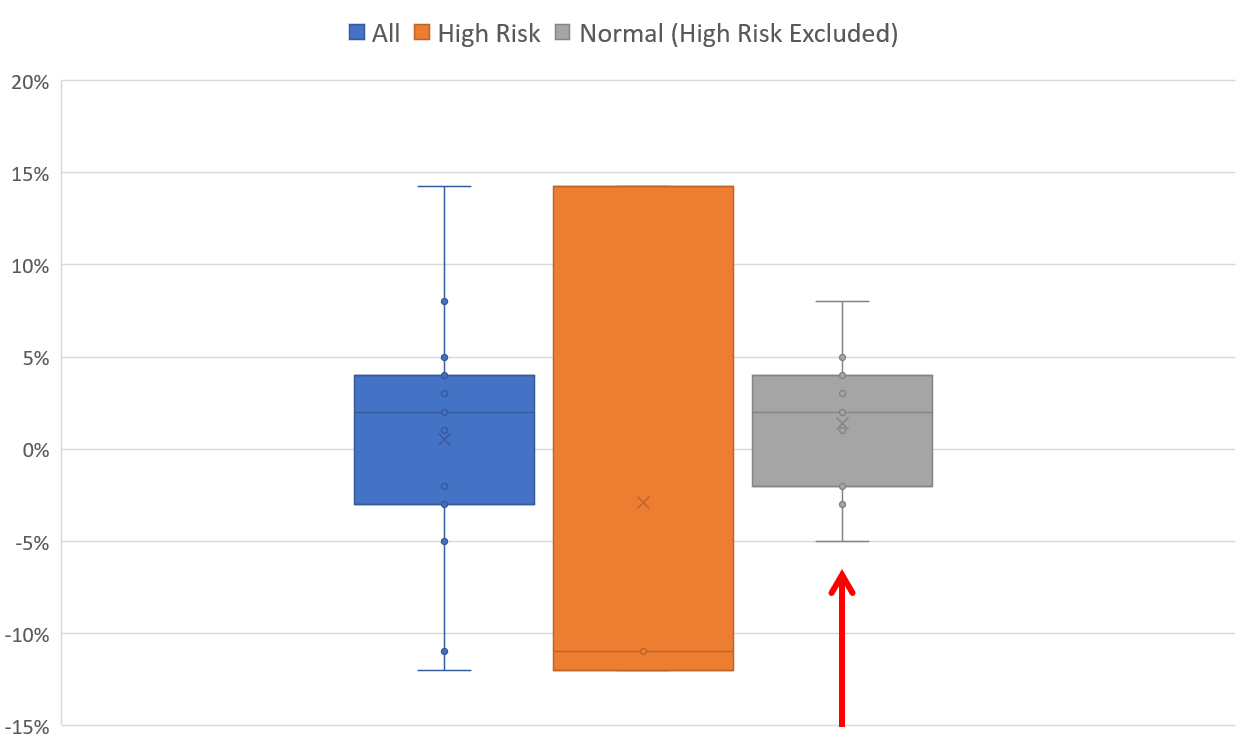
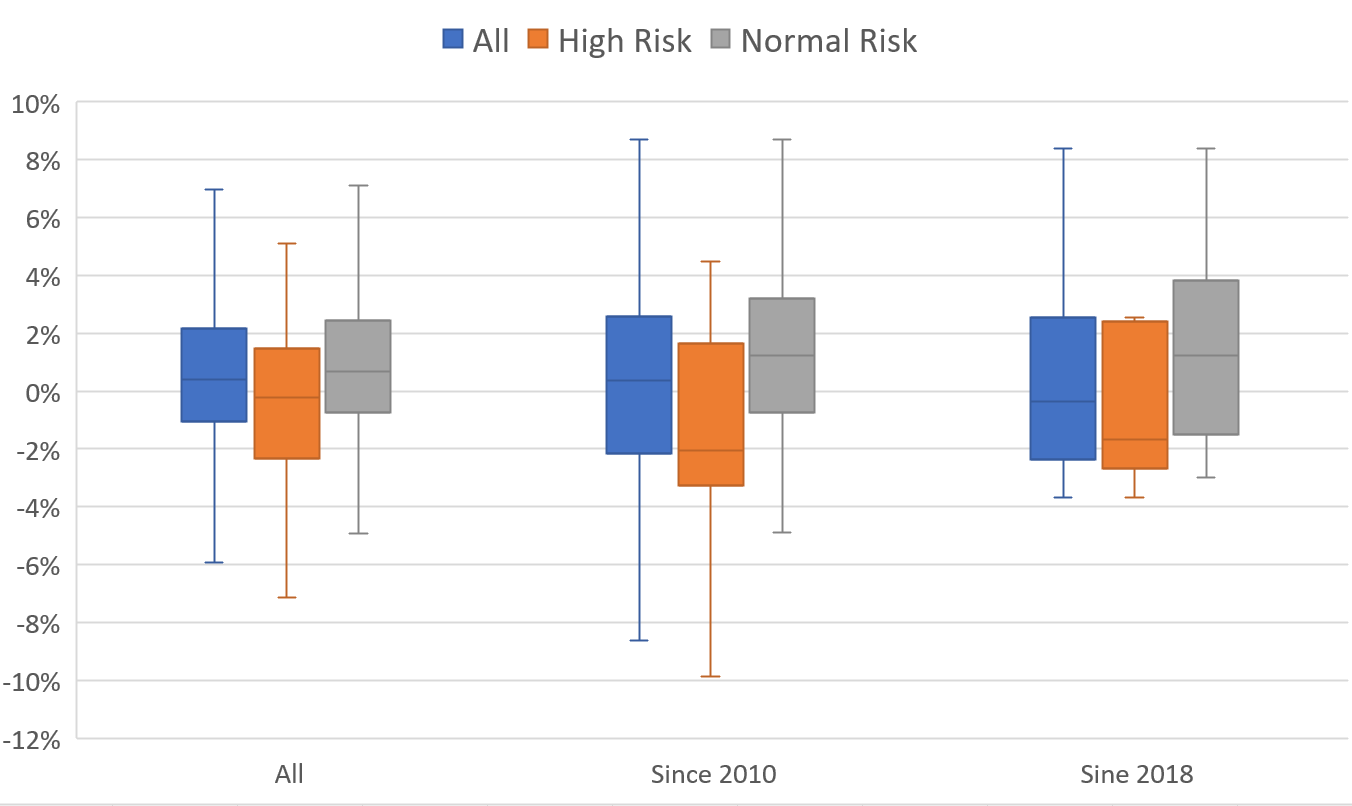
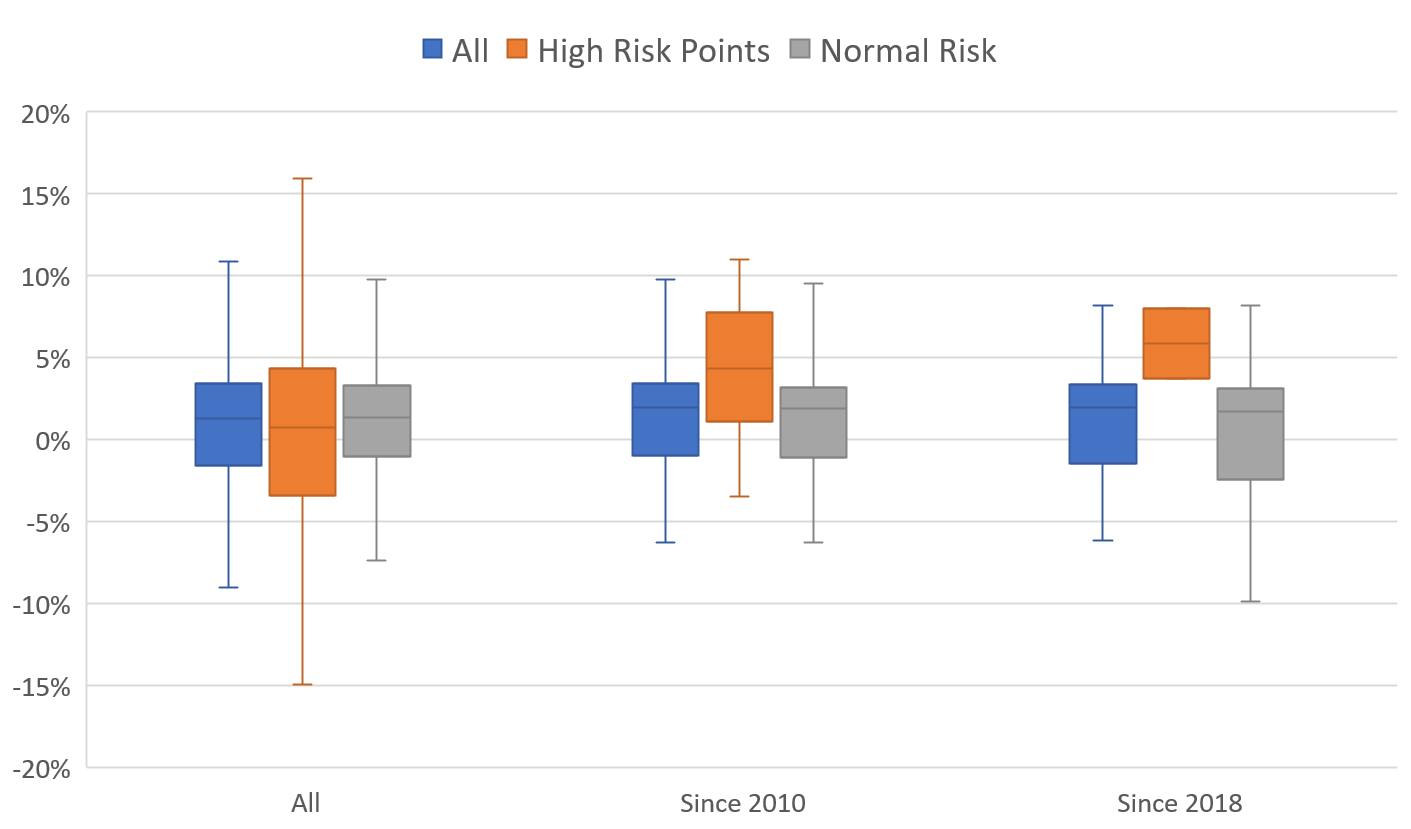
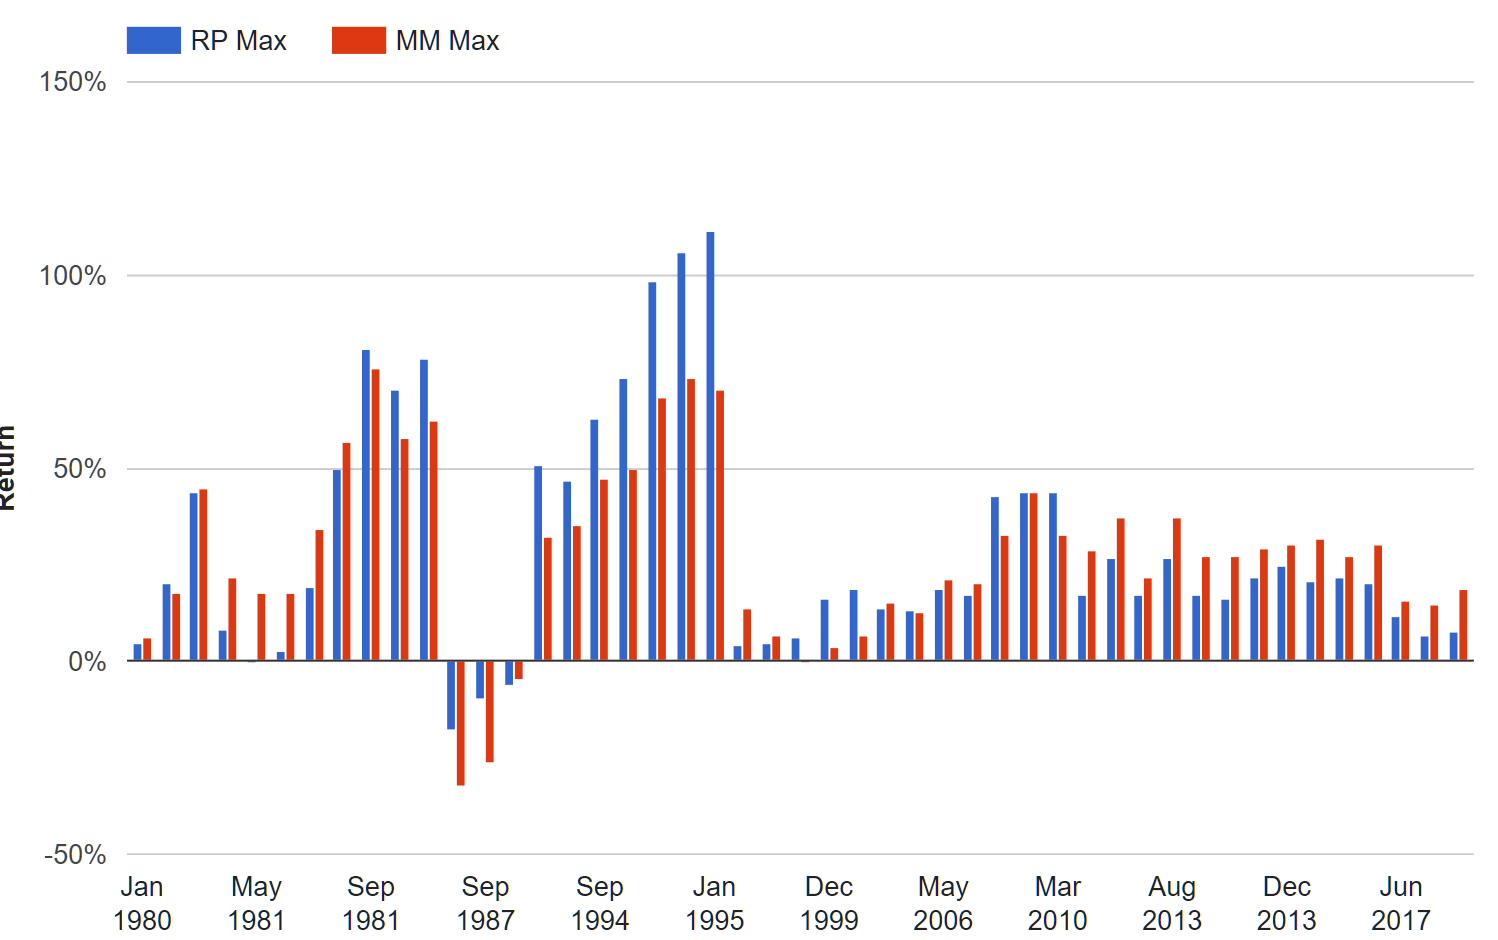
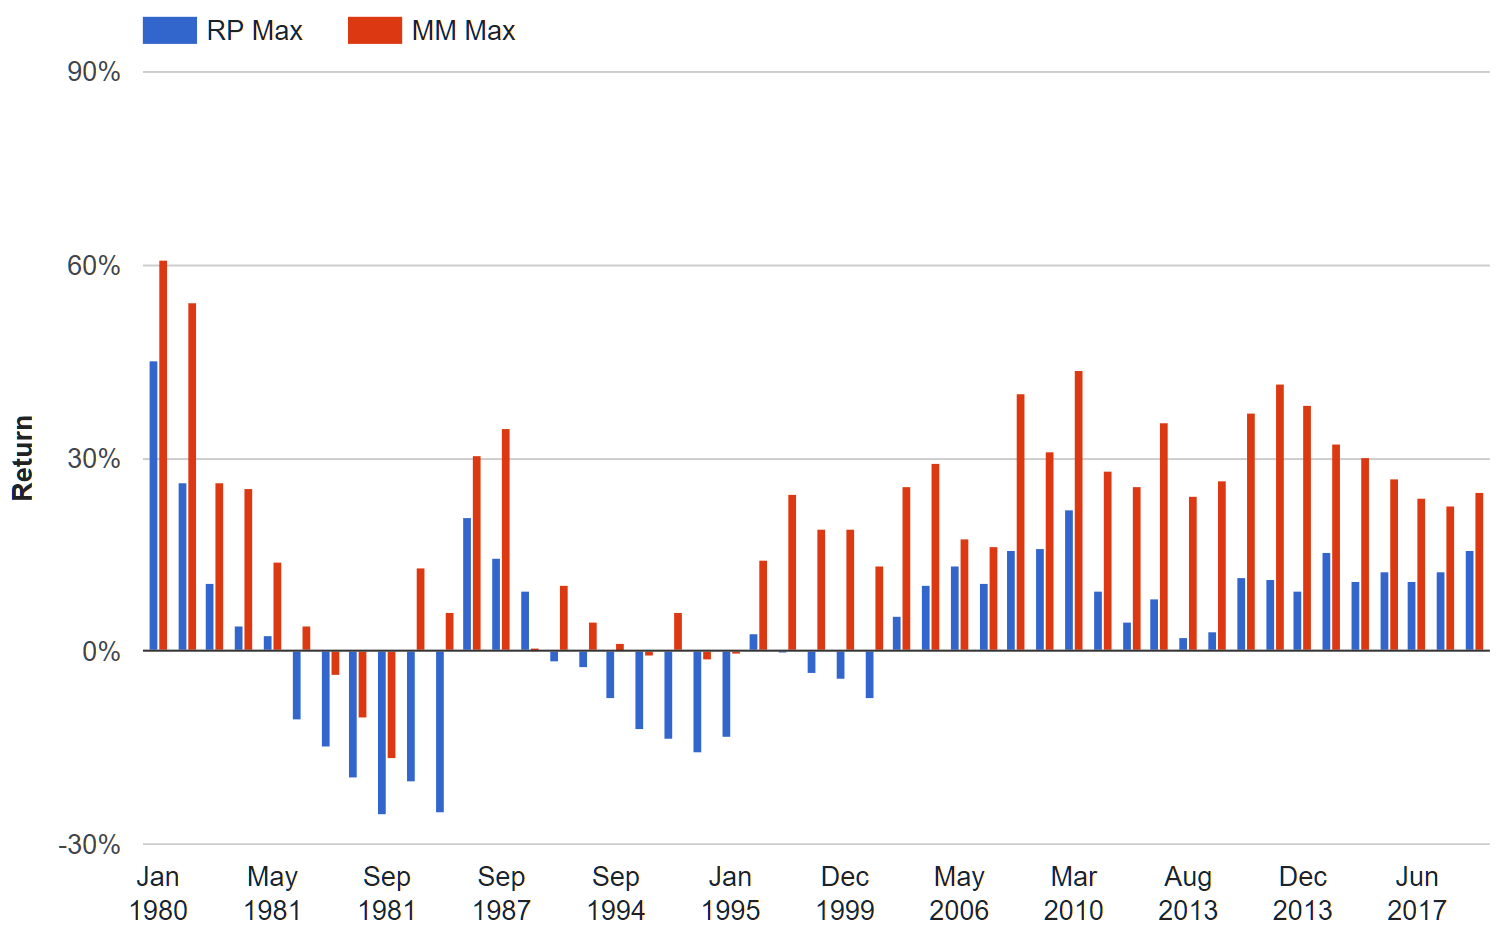
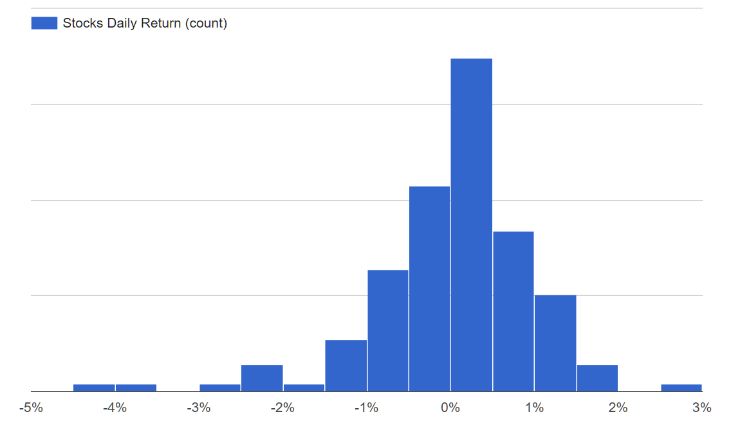
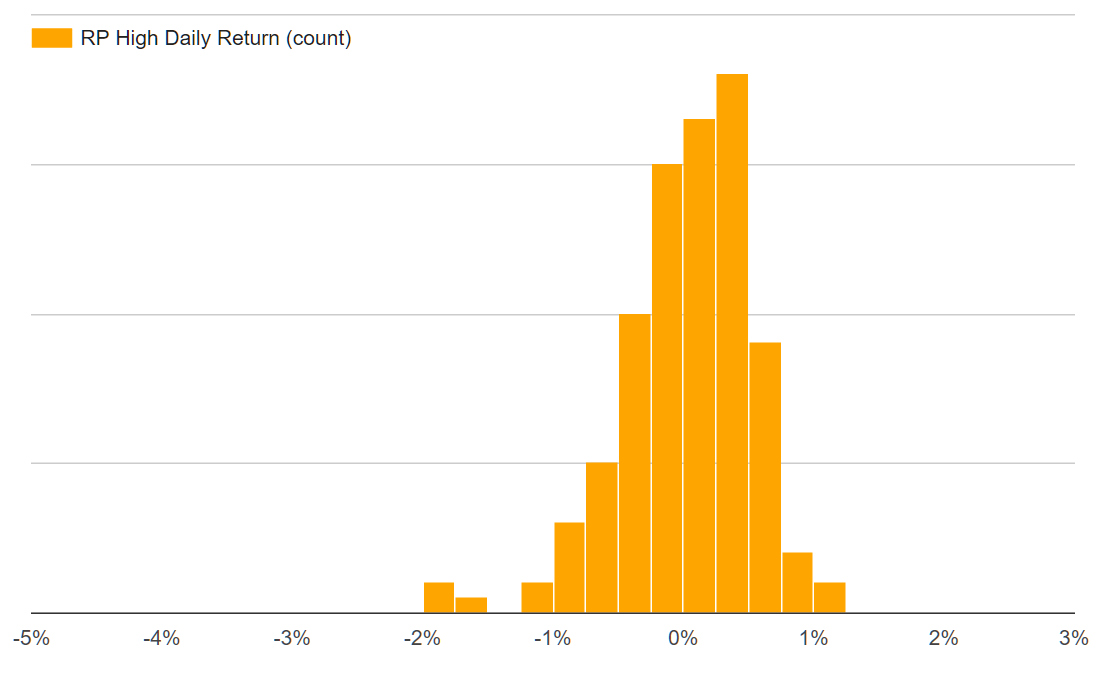
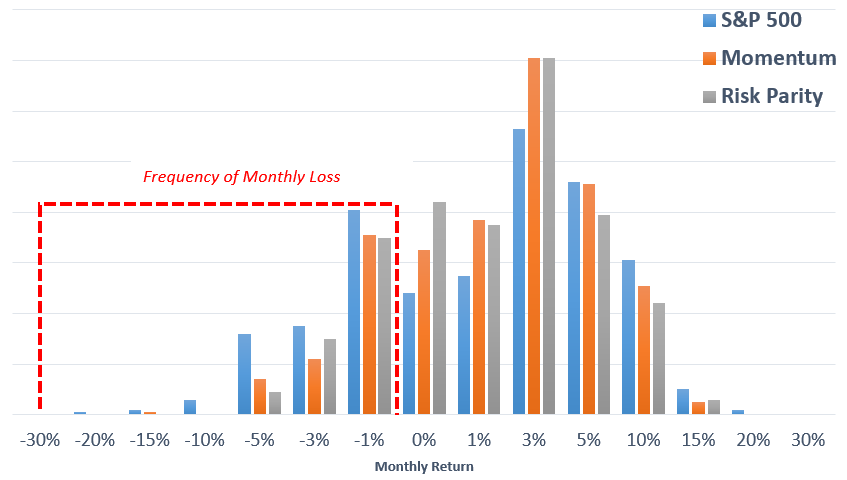
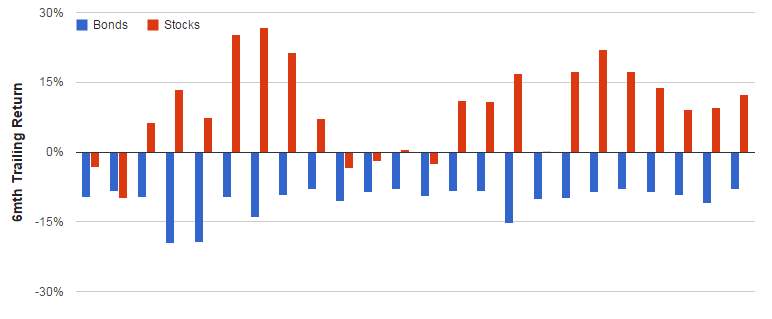
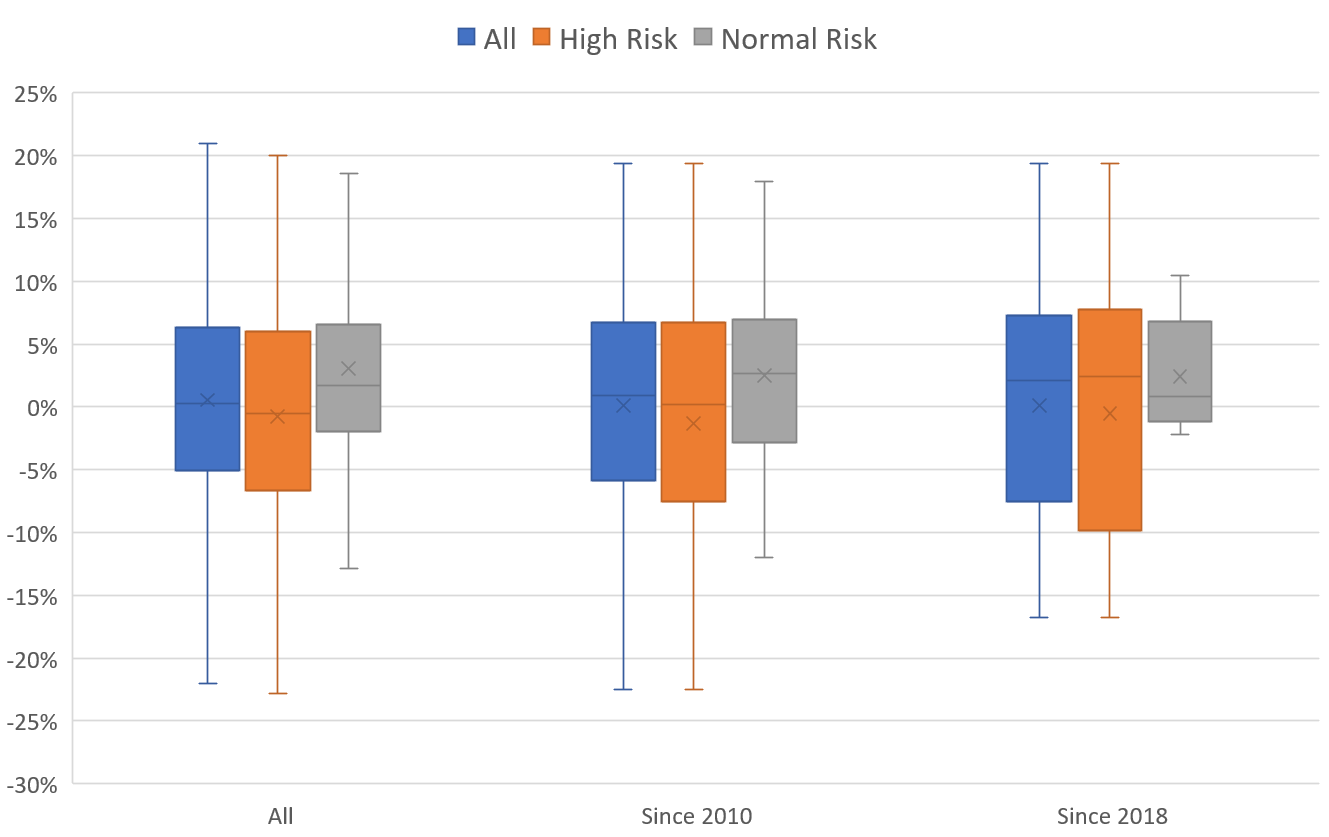 So far so good. In both these asset classes, the "negative" tail has consistently shifted upward by removing your high risk environments. Strangely, the S&P 500 has been a little different this decade.


 .
.