


Summary
- Thus far in 2016, Hedgewise has significantly outperformed the equity markets across its new portfolio of products, with YTD returns as high as 16%.
- Our strategies have withstood a number of significant economic shocks, such as the Brexit event, and clearly demonstrated the value of our risk management techniques.
- We have continued to innovate with new product offerings to suit different financial goals, from conservative to speculative, while maintaining our core principles.
- Though many investors are concerned about a poor return environment moving forward, Hedgewise clients can remain confident.
2016 Highlights Need for Risk Management
This year has been a scary one for most investors. The S&P 500 stumbled by over 10% to start the year, and significant events such as the Brexit have caused stocks to fall by as much as 5% in a single day. While equities are still positive year-to-date, nearly every investor is wondering how much longer this bull market can last. For most, this presents a stark choice: brace for a bad few years, or move to cash but risk missing out if the bull finds its feet again.
Hedgewise was founded on the idea that investors need a better option, and we were confident that we could create one by systematically managing risk. Our goal was to create steadier return streams with a far lower chance of dramatic losses. This would effectively remove the need to time the market, providing a drastically more positive outlook for our clients. Far too many investors miss out on potential returns because of the paralyzing fear that another 2008 is right around the corner.
As Hedgewise approaches its two-year anniversary, we are extremely excited to have proof that our products are working exactly as we had hoped. Our initial flagship 'Risk Parity' product has gained from 8% to 16% (depending on your risk level) this year, while providing a significantly smoother return throughout. When stocks lost over 10% from January to late February, our Risk Parity product still gained 2%. On the day of the Brexit, it was breakeven.
Though Risk Parity will always be a bedrock of Hedgewise, 2016 has also been an important year for expanding upon our vision. As we have continued to meet clients with a wide array of goals, we realized we could extend many of our risk management techniques to other kinds of products. We want to become a trusted source for any client need, from the most risk-averse to the most speculative. We will soon be publishing a great deal of research that better describes these new products, how they work, and whether they might fit in your portfolio. However, the theme will always be consistent: better returns with less risk. Here is a look at how our new product lineup has performed this year compared to the S&P 500.
Hedgewise Products vs. S&P 500, 2016 YTD
| Product | YTD Return | YTD Volatility |
|---|---|---|
| Ultimate Momentum | 15.10% | 11.10% |
| Risk Parity (High) | 13.83% | 7.31% |
| Long-Short Oil | 17.87% | 18.50% |
| Low Risk Yield | 8.21% | 4.06% |
| S&P 500 | 5.89% | 15.98% |
Despite an ominous economic outlook in much of the world, Hedgewise clients can rest assured that we are taking these risks fully into account and managing accordingly across our entire portfolio.
Unpredictable Markets, Predictable Returns
Back in December 2015, markets were pricing in four rate hikes by the Fed this year. Gold had been losing money for nearly four years straight, and many were predicting it might lose another 50% before stabilizing. Nearly every client in our Risk Parity product, which balances risk through a constant exposure to bonds, had begun asking whether such an allocation still made sense.
Few might have predicted that the Fed would fail to raise rates at all, that gold would be one of the best performing assets, or that Britain would no longer be a part of the EU. Yet these possibilities always existed, and the beauty of a risk-managed portfolio is that they are automatically taken into account. This enabled our Risk Parity portfolios to dramatically outperform so far this year.
Breakdown of Risk Parity 'High' Returns, 2016
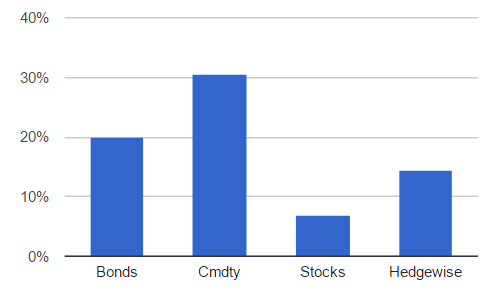
The beauty of this approach is that it is not dependent on any single asset, and thus naturally accounts for the unpredictable. Though bonds have certainly become riskier as yields have continued to drop, that is already automatically being taken into account within our systems. It is not necessary to guess which direction different assets are headed next. Return expectations remain positive regardless.
The Value of Not Worrying
The Brexit event was an excellent illustration of the extraordinary role that emotions can play in investing. A huge number of investors exited the market on that day, leading to stock losses as high as 5%. Yet a week later, the market had mostly recovered. The investors that sold are now in the precarious position of deciding whether to re-enter after already missing the bounce.
While moving to cash can feel like a safer decision, its real cost can be extraordinary. Consider the following two scenarios:
Scenario 1
An investor with $100,000 has a thirty-year time horizon, but feels nervous about the current valuation of stocks. He stays in cash for two years until he is more confident about the economic outlook. During those two years, as well as every year thereafter, stocks achieve a return of 8%.
The total opportunity cost of those two years of waiting is over $143,000, or 143% in returns.
This is due to the nature of compound interest. Missing out on a couple years of gains early in your investing timeline can substantially reduce your expected earnings.
Scenario 2
An investor with a thirty-year time horizon has most of his money fully invested, but keeps an average of $50,000 in cash at all times just in case. He doesn't need this money for any immediate purpose, but he considers it part of his rainy day fund and does not want it to be at high risk.
If this investor had been able to yield a conservative return of 4% instead of keeping it in cash, he would have more than tripled those funds and generated over $100,000 in extra returns.
Of course, these examples are not entirely realistic because they do not account for the possibility of immediate loss. It's obviously better to be in cash if you manage to avoid a crash, but you then have to correctly time your exit and re-entry. We believe the key to successful investing is to eliminate this terrible dilemma through more effective risk management.
Using a modified, hypothetical version of our Risk Parity model that runs back to the 1970s, we can compare its risk profile to the S&P 500. All dividends are included and assumed to be re-invested, and these figures include an estimate for commissions and fees.
Risk Statistics: Risk Parity vs. S&P 500, 1970 to Present
| Statistic | S&P 500 | Risk Parity | Low Risk Yield |
|---|---|---|---|
| Worst 1 Month Return | -22% | -8.5% | -3.3% |
| # of 1yr Losses > 20% | 26 | 4 | 0 |
| Max Time To Recovery | 6 yrs | 3 yrs | 1.75 yrs |
While a risk-managed portfolio is not immune to loss, historically it has been far less likely and far less painful. In addition, the losses of a risk-managed portfolio are nearly impossible to time. For example, it did not experience a net loss from 2000 to 2003 or from 2007 to 2009, but it did lose money in 2015. Because such losses tend to be fairly random and short-lived, selling never makes much sense. We consider this quite positive in terms of investor psychology: it frees you from having to predict what's next.
While Hedgewise does strive to outperform benchmarks such as the S&P 500 over time, it is important not to understate the value of emotional stability. By simply having the confidence to put more cash to work more consistently, you can drastically improve your outlook.
In a Worried World, Hedgewise Provides a Better Option
While the political events of our time are more nerve-racking than ever, your investment portfolio doesn't have to cause the same stress. There are many ways to help limit your losses without sacrificing long-term returns, and Hedgewise is striving to stay at the forefront of these techniques. We are excited to continue to publish new research and help our clients construct portfolios that are well-aligned with their goals and well-positioned for whatever comes next.
Despite a slow-growing economy, a disrupted European Union, a worried Fed, and a tired bull market, Hedgewise products have had an excellent year across the board. We hope this continues to inspire our clients with the confidence to put more of their money to work while avoiding the pitfalls of traditional portfolio management.
Disclosure
This information does not constitute investment advice or an offer to invest or to provide management services and is subject to correction, completion and amendment without notice. Hedgewise makes no warranties and is not responsible for your use of this information or for any errors or inaccuracies resulting from your use. Hedgewise may recommend some of the investments mentioned in this article for use in its clients' portfolios. Past performance is no indicator or guarantee of future results. Investing involves risk, including the risk of loss. All performance data shown prior to the inception of each Hedgewise framework (Risk Parity in October 2014, Momentum in November 2016) is based on a hypothetical model and there is no guarantee that such performance could have been achieved in a live portfolio, which would have been affected by material factors including market liquidity, bid-ask spreads, intraday price fluctuations, instrument availability, and interest rates. Model performance data is based on publicly available index or asset price information and all dividend or coupon payments are included and assumed to be reinvested monthly. Hedgewise products have substantially different levels of volatility and exposure to separate risk factors, such as commodity prices and the use of leverage via derivatives, compared to traditional benchmarks like the S&P 500. Any comparisons to benchmarks are provided as a generic baseline for a long-term investment portfolio and do not suggest that Hedgewise products will exhibit similar characteristics. When live client data is shown, it includes all fees, commissions, and other expenses incurred during management. Only performance figures from the earliest live client accounts available or from a composite average of all client accounts are used. Other accounts managed by Hedgewise will have performed slightly differently than the numbers shown for a variety of reasons, though all accounts are managed according to the same underlying strategy model. Hedgewise relies on sophisticated algorithms which present technological risk, including data availability, system uptime and speed, coding errors, and reliance on third party vendors.