


Summary
- Hedgewise continues to outperform all asset classes and comparable benchmarks in 2017, achieving a return of 18% to 20% in products at higher risk levels.
- However, many clients ask about how to evaluate this performance compared to the equity bull market, and wonder whether high returns this year foreshadow inevitable losses.
- The most useful metrics actually have little to do with raw returns over the past day, month, or even year. The S&P 500 is often a poor benchmark to use, and recent positive returns have almost no predictive value.
- While these facts can feel counterintuitive, a deeper analysis reveals that they are entirely consistent with the underlying financial theory, and help to paint a very optimistic picture moving into 2018.
2017: A Great But Unsurprising Year
Traditionally, portfolio managers are judged by the two most intuitive benchmarks: absolute performance and performance compared to the S&P 500. It is also quite natural to focus on recent history, so year-to-date figures tend to dominate. By these simple measures, 2017 has been a tremendous year for Hedgewise, which has achieved returns near 20% and consistently outperformed the S&P 500 (in Hedgewise products at a comparable level of risk).
Yet these benchmarks play almost no role in my internal analysis. Returns have been in line with my expectations, but I place little weight on where they fall relative to the S&P or the somewhat arbitrary YTD figure. While 2017 has provided a few more data points that suggest markets continue to function as the theory might predict, I'd be equally pleased with a year of flat or even negative performance so long as it validated the same.
As an example, I was quite excited to see how Hedgewise products mitigated losses during the bond pullback late in 2016, though clients were also experiencing losses along the way. I would describe that period of loss as necessary, expected, and a very positive indicator that 2017 might continue to unfold the way it has. Hedgewise pared similar losses in the energy markets earlier this year, which was a more important development to me than the fact that YTD total returns were positive at the time.
While on first glance such a perspective may seem strange, it is actually quite intuitive once you examine the underlying principles at work. It can also be fairly transformative for your investing mindset, reducing the burden of worry about bubbles, relative performance, and manager acumen. Below, I've examined the key ideas that shed light on why traditional benchmarks and timeframes don't apply, how this relates to the core financial theory, and where this year's performance fits into the picture.
But first, let's take a quick look at what happened so far in 2017.
Performance Recap: Hedgewise Outperforming Where It Should
So far in 2017, Hedgewise products have outperformed all traditional benchmarks at comparable levels of risk.
Hedgewise YTD Performance vs. Traditional Portfolio Benchmarks
| Product | YTD | Benchmark (Ticker) |
|---|---|---|
| RP+ Med. | 10.04% | 6.80% (AOK) |
| RP+ High | 12.81% | 8.44% (AOM) |
| RP+ Max | 18.70% | 15.17% (AOA) |
| Mom. Max | 20.57% | 17.36% (SPY) |
As I discussed in the intro, while this outperformance is broadly in line with expectations, it is not all that meaningful over such a short timeframe. I'd be equally pleased if Hedgewise had simply matched the benchmarks or even underperformed because neither stocks nor bonds have experienced any persistent downswing this year. Regardless, the big picture is that Hedgewise continues to prove that you can successfully manage major risks and still keep up with robust bull markets.
Hedgewise has also consistently matched or beaten the other major Risk Parity mutual funds this year.
Hedgewise YTD Risk Parity Performance vs. Major Mutual Funds
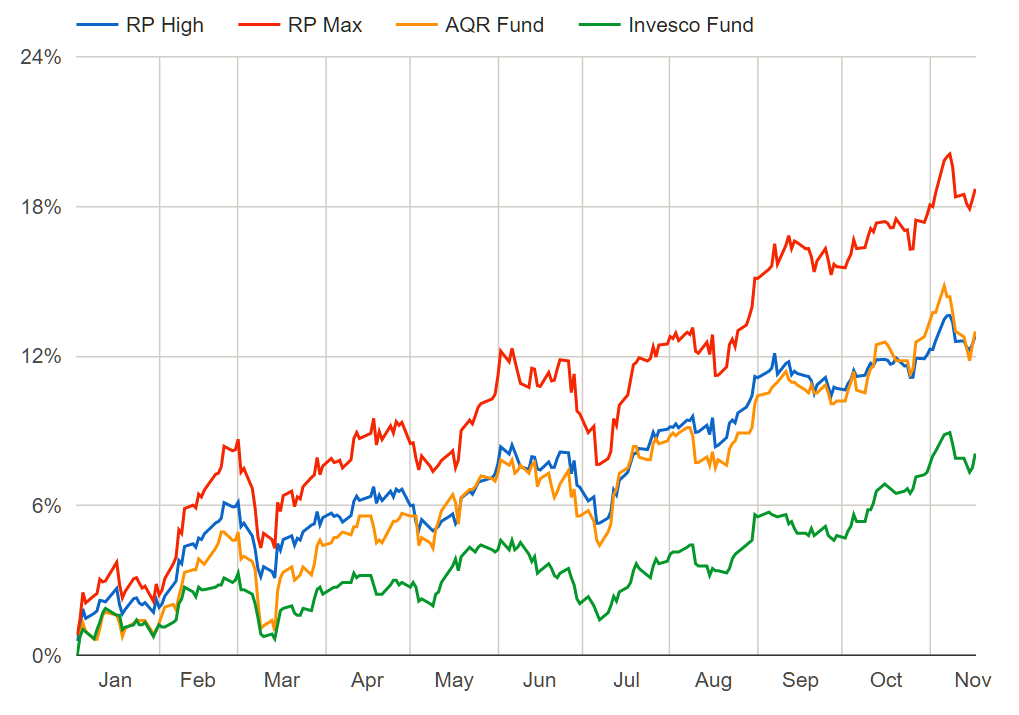
I love this chart because it continues to validate the passive, systematic approach of Hedgewise. The AQR fund has about 300 holdings, invests globally, and employs five full time investment professionals. The Invesco fund takes a heavily active approach, often trading daily and heavily tilting towards certain asset classes. Both funds have an expense ratio over 1% and a significant tax burden. Hedgewise has a maximum of seven holdings, invests solely in the US, and runs entirely via tax-efficient algorithms at half the cost. As you can see, all of that extra complexity and expense doesn't add up to much!
Risk Parity strategies as a whole have done well in 2017 for a simple reason: stocks, bonds, and commodities have all gone up. Momentum has done even better since it overweights stocks, which have performed the best. In some ways, that makes this year relatively uneventful, since there's not much opportunity to demonstrate the use of hedging and risk management. However, it does help to dispel the common misconceptions that bonds will be a drag on portfolios during bull markets or that hedging in general must depress returns (ideas which I've covered in greater depth in this article).
Still, most clients find it strange that I'd call a year of 20% returns uneventful, and stranger still that I'm not worried about an equity pullback, that I don't closely follow this month's returns, or that I'd call a 10% drawdown no big deal. But allow me to explain, and you'll see that these ideas are both simple and cause for persistent optimism.
Benchmarks: Moving Past Absolute and Relative Returns
Traditionally, bull markets are celebrated and managers are rewarded for beating common benchmarks like the S&P 500. At Hedgewise, I view positive returns as commonplace and I expect to underperform the S&P 500 quite frequently.
The key to understanding this is all about stability. The goal of any good risk-managed framework is to produce more consistent returns, which means I'd rather have two years of 5% returns than one year where I make 20% and the next where I lose 15%. This is because such volatility inevitably injects timing risk to a portfolio - what if you happen to start at the wrong time, or what if you can avoid the next downswing? In real life, you also run into unfortunate stretches like 2000 to 2010 where a couple of bad years can wipe out a decade's worth of gains.
Hedgewise seeks to create stability through a variety of hedging mechanisms, like intelligent diversification, risk-weighting, and loss management. The goal of these techniques is to transform client return distributions to be more stable and consistently positive, like this:
Normal vs. Risk-Managed Return Distribution, In Theory
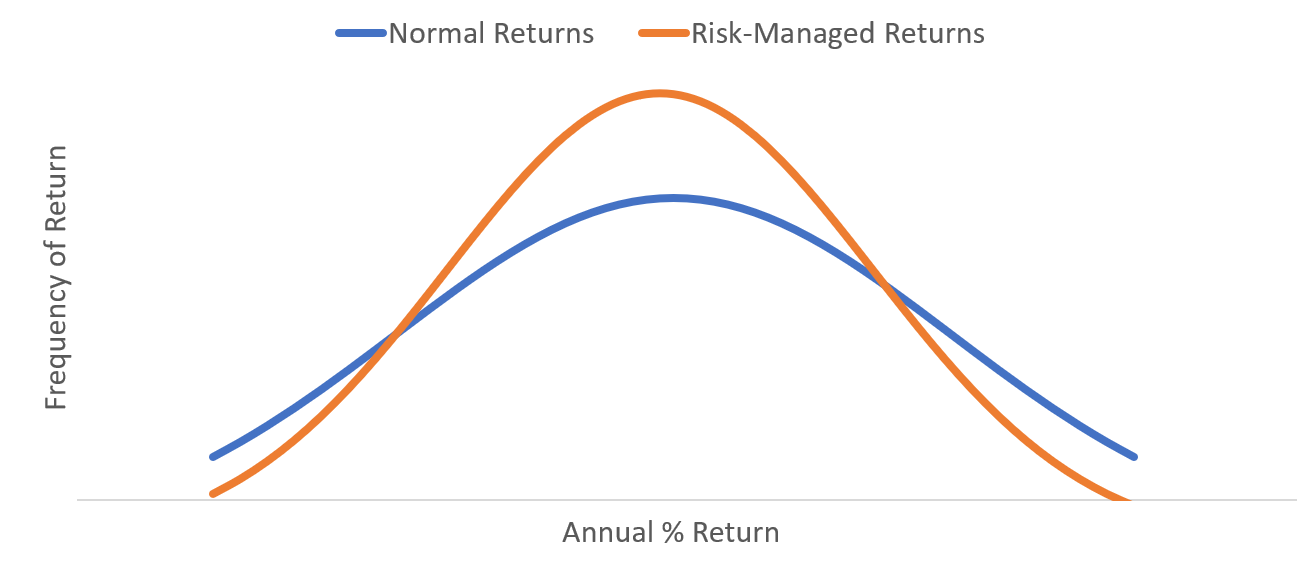
Note that the risk-managed curve experiences fewer extreme gains as well as fewer extreme losses, which is entirely the point! If the S&P 500 represents "Normal Returns", then that means you'd expect a risk-managed framework to underperform the S&P 500 when it is doing well and to outperform it when it is doing poorly. You would view both outcomes as equally good, since they both lend proof to the idea that returns are being stabilized.
By extension, you would only tend to see net outperformance for the risk-managed framework after the S&P experiences a period of underperformance.
With this in mind, let's see what this curve looks like for the actual Hedgewise framework. I've chosen the RP High strategy for comparison, for which my expectation is a return near or slightly above the S&P 500 over the long-run but with far greater stability.
S&P 500 vs. RP High Annual Return Distribution, 1972 to Present
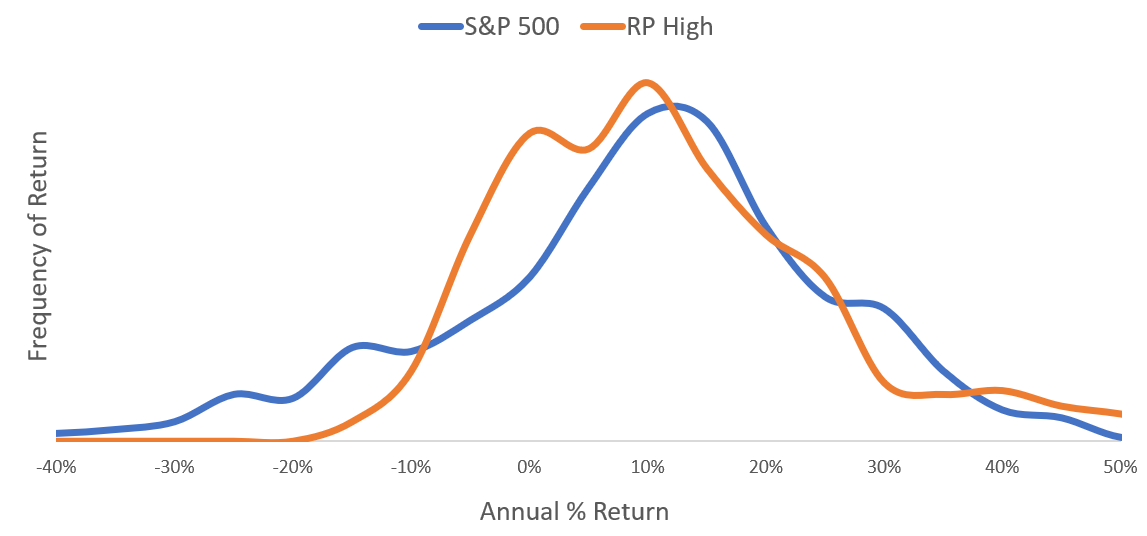
While the real-world data is a little messier, it still about lines up with the expectation. The RP High framework actually has a lower median return but a higher average return than the S&P 500. In other words, you will tend to underperform the S&P 500 in any given year, but you will still outperform it over time. This is primarily driven because you avoid the major 'left tail' negative shocks, like 2008, that only come around once in a while but make an enormous difference to your net returns.
This year, clients in RP High have a return of 12.8%, which is maybe a little better than average but still pretty typical. Same goes for the S&P 500, which returned 17.25%. When you put this in context of the theory, this is exactly what you'd expect! It would be silly to judge this underperformance against the S&P as a bad thing. It would also be silly to call this a 'bull market' for Risk Parity when really it is just a normal market.
On a related note, the messiness of the above chart highlights why an annual timeframe isn't all that useful; it generally takes a longer time to see the true benefit of stability.
Timeframes: Understanding Days, Months, Years, and Decades
Especially during extended equity bull markets, I naturally run into lots of skepticism about whether risk-management is really that useful when you could do so well in any old index fund. The key question this raises is, how long does it usually take to see definitive proof?
You can probably guess that it takes about as long as the typical equity bull market, since most of the benefit accrues when stocks are doing poorly. With the average bull market lasting about ten years, let's extend the timeframe to that length and take a look at the same return distributions as earlier. According to the theory, the risk-managed framework should almost always outperform stocks given this amount of time.
S&P 500 vs. RP High 10yr Return Distribution, 1972 to Present
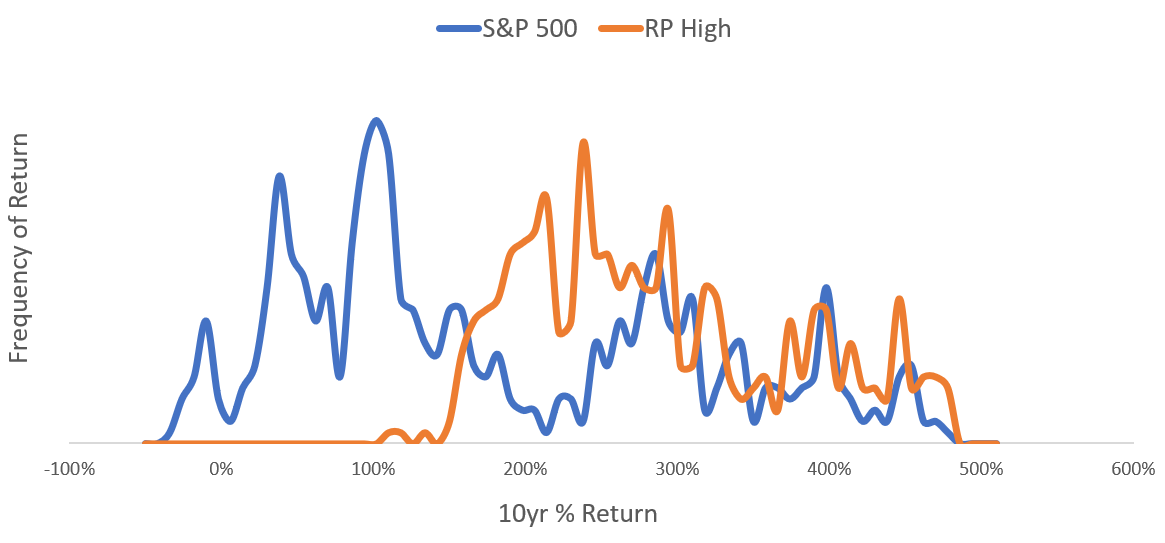
These results are pretty amazing: Risk Parity avoids any negative returns and consistently outperforms equities, even during the strongest bull markets in history. That said, waiting a full decade can be a bit of tall order for most clients; luckily, you can see these same benefits in as little as three years if you have the right perspective.
S&P 500 vs. RP High 3yr Return Distribution, 1972 to Present
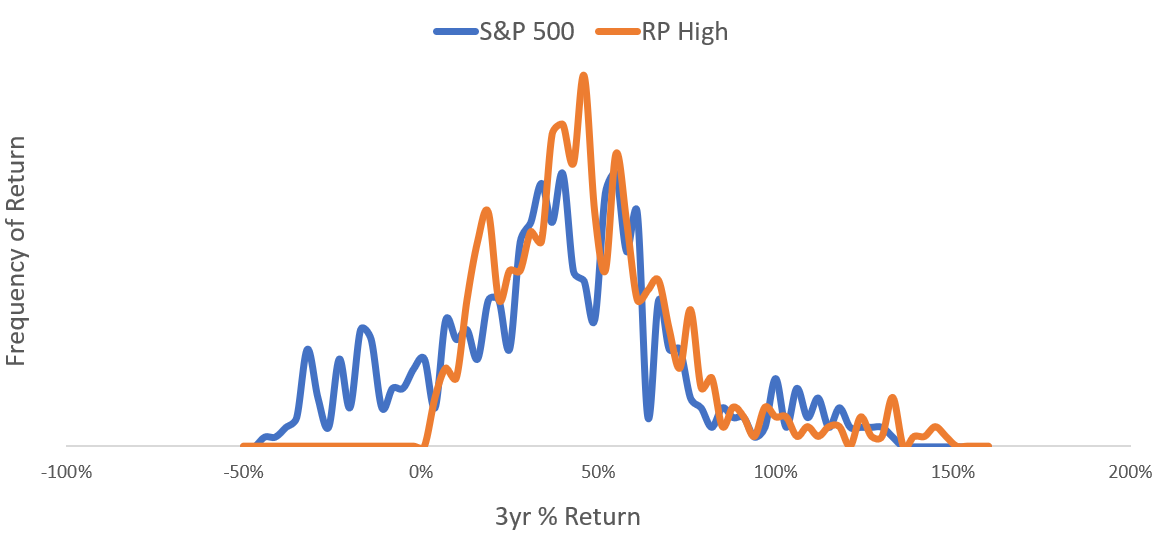
This shows that Risk Parity usually generates equity-like returns over any three year period, but with far less risk of incurring a net loss. However, this just isn't a long enough time to expect that you'll definitely outperform stocks, nor should that be particularly important. If it happens to be a stretch where stocks do poorly, the benefits will be obvious. If not, you'll probably have returns between 15% and 100%, and you didn't have to worry whether a crash was just ahead.
Now we'll look at one final comparison that is purposefully messy: one month returns. As you might expect, such a short timeframe doesn't really tell you much of anything.
S&P 500 vs. RP High One Month Return Distribution, 1972 to Present
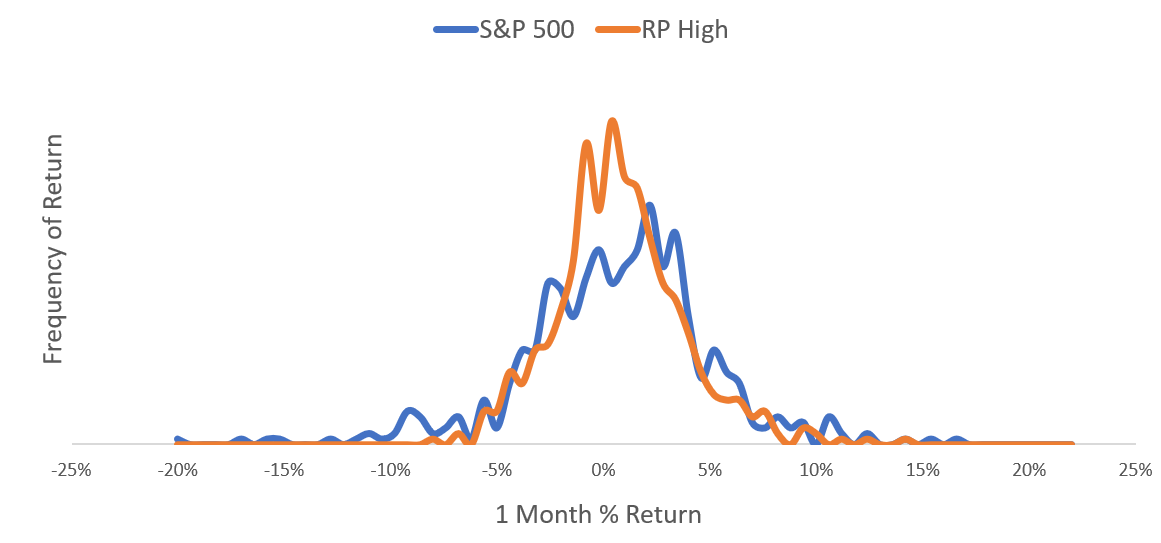
One month returns are almost pure noise. You may frequently lose a few percent, you may often underperform equities, and you may have many consecutive months that are flat or down. Despite this, if you simply wait three years, you'll probably have some nice gains.
This is why I'm never very focused on recent history, nor am I surprised about all of the ups and downs along the way. Rather, I care most about market shocks, like the bond pullback of 2016, which let you see the hedges really working. In calm waters, I only expect moderate upward trending returns over the course of a few years, and 2017 has fit that to a tee.
Returns: Where They Come From, What They Mean
So far, this analysis has focused on how to evaluate the benefits of a more stable return over time, but it still begs the question of where that return comes from and why it should be consistently positive at all. It is also fair to ask whether very high returns are often followed by very low ones, and vice versa, since this tends to be the case with individual assets like stocks or commodities.
The beautiful thing about public markets is that at any given point in time, every individual participant is expecting to make money no matter how much they have made already. To enable this, investors apply a discount to every asset they buy that bakes in an expected return. Generally, that discount gets applied to expected cash flows, e.g., actual profits at a company or coupon payments from a bond.
It's useful to illustrate this with a simple hypothetical. Say Company X is valued at $100 per share and expects to make $10m per year now and forever into the future. An investor would simply discount that $10m to come up with the value today and divide that by the number of shares to get $100.
Now say a year passes and nothing at all has changed with the company. They made $10m, and they expect to continue to make that now and forever into the future. The same investor runs the same analysis and values the company at $100 per share. But something very important has changed. A year has passed, and anyone that owns a share of the company just got a piece of the $10m in profits.
This is a very important distinction because there is often confusion that the only way to make money in the markets is if prices continuously go up. But this is not true. You can make perfectly reasonable returns over time even if prices stay exactly the same.
This powerful concept explains how you might achieve positive returns every year without any kind of irrationality or price bubble. In financial parlance, these returns are called "risk premia", and Hedgewise simply builds products to collect these risk premia as efficiently as possible.
The rub is that sometimes investors get overexcited about prospects that won't ever actually make any profit, like during the dot-com bubble or, if I were guessing, the current cryptocurrency craze. In these cases, asset prices can skyrocket without any real money being made, and fall just as easily.
A hypothetical illustration of expected asset returns would look something like this:
Theoretical Asset Return Patterns
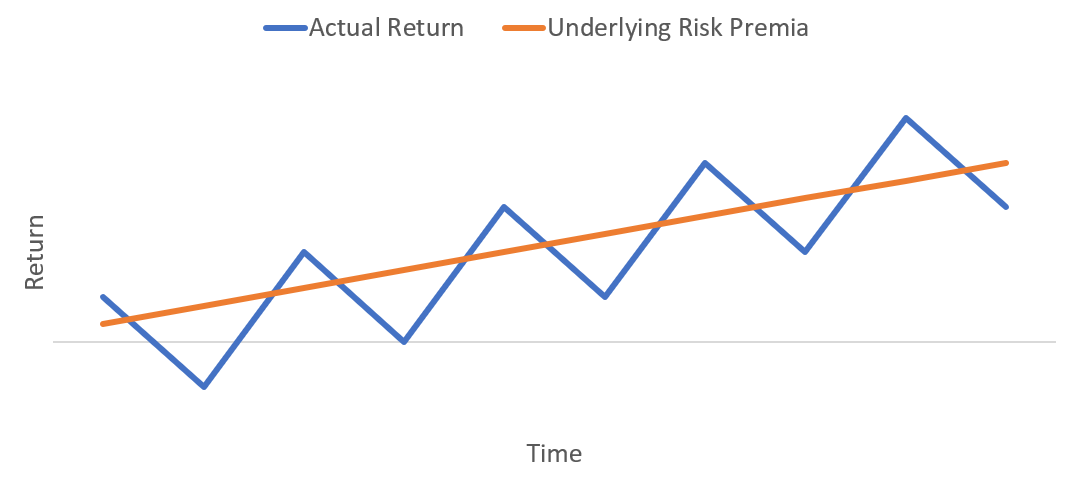
The blue line represents a theoretical live market, in which asset prices often swing up and down with investor speculation. The orange line is the underlying risk premia (i.e., actual profits being made or paid back to investors) that accumulates along the way, and basically represents fair value. While live market prices constantly fluctuate above or below this fair value, you still expect appreciation over time.
In other words, consistent positive returns over time are perfectly normal, and negative returns are unlikely to persist for very long. If you had perfect insight, you could also time every individual top and bottom, but it is hard to justify all of that effort when you can gain so much by just waiting.
If this theory is accurate, you'd expect big losses to reverse far more consistently than big gains, especially in a framework like Risk Parity. Let's see whether this has been true. The following is a scatterplot where the horizontal axis is the trailing one year return, and the vertical axis is the following year's return. The bottom left quadrant (emphasized) represents the instances when you had two consecutive years of loss.
Last Year's Return (X Axis) vs. This Year's Return (Y Axis), Risk Parity High
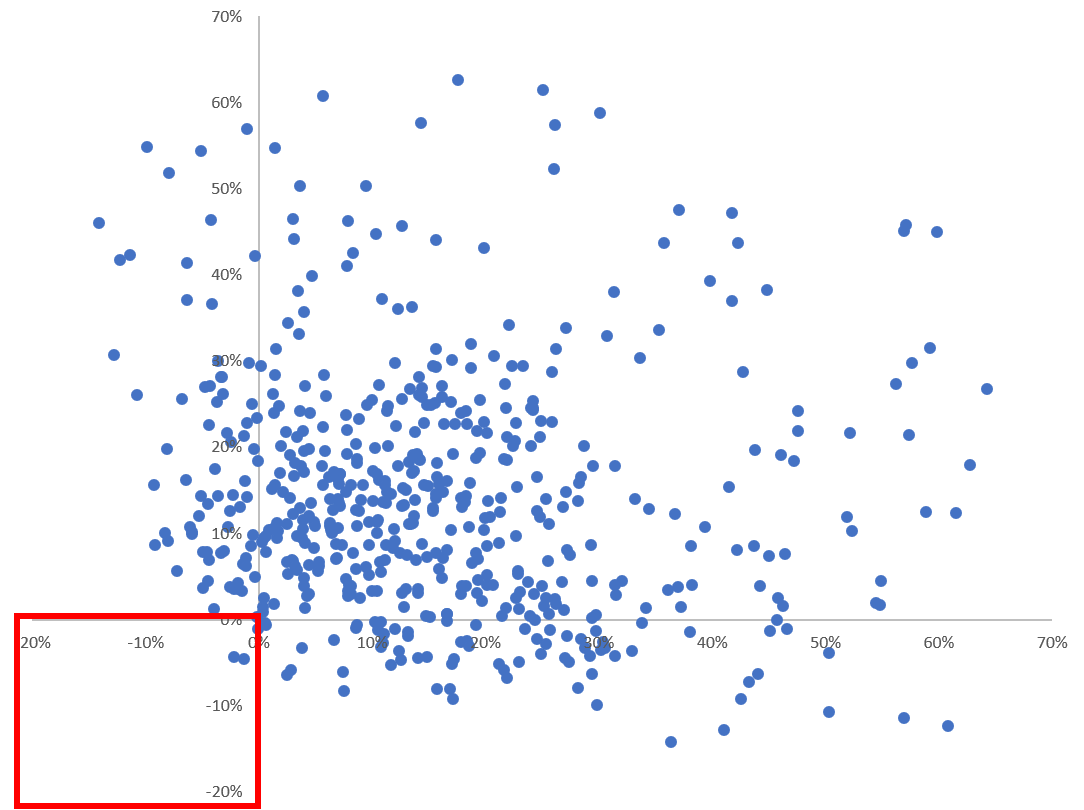
Notice that there have been only two periods of consecutive annual losses, out of over five hundred data points. The large majority of the time you have had two consecutive years of gain (upper right quadrant). There's also no evidence that really large gains are consistently followed by losses.
Basically, it is really hard to lose money over any reasonably long stretch of time because you get a constant positive lift from risk premia. Losses tend to disappear pretty quickly, and gains tend to persist. We've recently seen a great example of this when losses in 2015 very quickly reversed in 2016. This year, RP High is up about 13%, which is quite normal and doesn't suggest that next year will be a bad one.
Wrapping Up: An Approach with Better Answers
Once this theory starts to click, it really provides a much more satisfying set of answers than traditional portfolios or managers can. Are equities overvalued? It has really never mattered much. Are we underperforming the S&P? Quite frequently, but that's how I know it is hedging well. Are my managers smart enough? No managers required, we're just systematically gathering returns in a smart way. Did we lose money this year? Maybe, but if we did, there is an exceedingly high chance that we're about to make it back.
In a world of stock-pickers, real estate bubbles, and irrational exuberance, it is completely natural to approach investing reactively and to constantly worry about what's next. Fortunately, the financial theory behind Hedgewise allows you to shift to a much calmer mindset, where short-term swings and big asset crashes are much less of a concern. 2017 has been one more data point that the theory is working just like it should. The fact that such a good year has been no surprise provides all the more reason for optimism heading into next year.
Happy Holidays, and hopefully Hedgewise has made it a little easier to enjoy without worrying about the markets!
Disclosure
This information does not constitute investment advice or an offer to invest or to provide management services and is subject to correction, completion and amendment without notice. Hedgewise makes no warranties and is not responsible for your use of this information or for any errors or inaccuracies resulting from your use. Hedgewise may recommend some of the investments mentioned in this article for use in its clients' portfolios. Past performance is no indicator or guarantee of future results. Investing involves risk, including the risk of loss. All performance data shown prior to the inception of each Hedgewise framework (Risk Parity in October 2014, Momentum in November 2016) is based on a hypothetical model and there is no guarantee that such performance could have been achieved in a live portfolio, which would have been affected by material factors including market liquidity, bid-ask spreads, intraday price fluctuations, instrument availability, and interest rates. Model performance data is based on publicly available index or asset price information and all dividend or coupon payments are included and assumed to be reinvested monthly. Hedgewise products have substantially different levels of volatility and exposure to separate risk factors, such as commodity prices and the use of leverage via derivatives, compared to traditional benchmarks like the S&P 500. Any comparisons to benchmarks are provided as a generic baseline for a long-term investment portfolio and do not suggest that Hedgewise products will exhibit similar characteristics. When live client data is shown, it includes all fees, commissions, and other expenses incurred during management. Only performance figures from the earliest live client accounts available or from a composite average of all client accounts are used. Other accounts managed by Hedgewise will have performed slightly differently than the numbers shown for a variety of reasons, though all accounts are managed according to the same underlying strategy model. Hedgewise relies on sophisticated algorithms which present technological risk, including data availability, system uptime and speed, coding errors, and reliance on third party vendors.