


"The bond market has ended its 30 year bull market."
"Interest rates have nowhere to go but up."
These are the themes of bond market commentary for the past year, and with good reason. Interest rates have been on a fairly steady decline since peaking in 1980, and now rest at their lowest point in nearly all of recent history. Yet if these predictions are absolutely true, why on earth is anyone buying or holding bonds anymore? Stranger still, why have long-term nominal bonds rallied nearly 20% year-to-date?
The long-term bond market is often misunderstood. With the interest rate trends of the past 30 years now on course to reverse, it is difficult to know what to expect. To help sort through all of the doomsday predictions and to better understand how bonds might perform when interest rates do begin to rise, we have gone back to study every major period of rising interest rates prior to 1982 to gain better insight.
In May of 1958, the Effective Federal Funds Rate ("Fed Funds Rate") was a measly 0.68%. It rose over the next 20 years to a peak of approximately 19% in July of 1981, as Paul Volcker used all the tools at his disposal to stamp out the worst period of stagflation in the United States in the past century. This provides an excellent retrospective for the absolute worst case scenario for long-term bonds moving forward, given it appears extremely unlikely that 19% interest rates are coming back anytime soon.
The results are almost certain to surprise you.
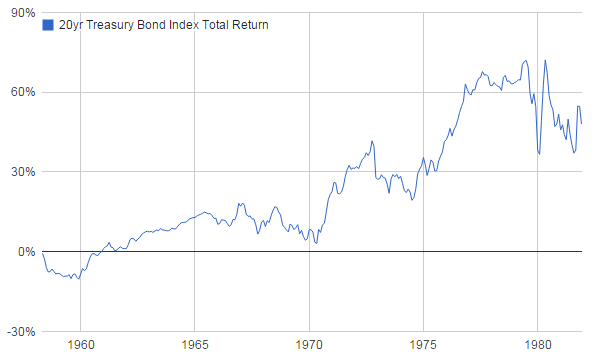
As a quick sneak peak, here's the total net performance of 20 year nominal bonds over this timeframe. This data is based on the monthly 20 year bond benchmark rate published by the Federal Reserve and uses the total return methodology published by Morningstar.
The overall return for this 23 year period was approximately 48%, or about 1.7% annually. More importantly, the results were far from consistent, as bonds both rallied and fell for different stretches throughout. We'll explore how this unfolded, and which implications are likely the most relevant for our immediate future.
Performance of 20 Year Nominal Treasury Bonds, May 1958 through January 1982
Period 1: The Recessions of 1958 and 1961
While the Recession of 1958 lasted only eight months, it prompted the Fed to reduce rates drastically, from 3.5% down to near 0.5% in less than a year. However, the downturn was relatively brief, and the Fed began rapidly tightening again in 1959, resulting in yet another recession beginning in April 1960. The economy reached its lows in February of 1961, and had returned to growth by 1962.
Our study begins at the low point of the Fed Funds Rate in May 1958, when it reached 0.68%. The yield on 20 year nominal bonds at that time was 3.17%. Rates peaked in January 1960, with the Fed Funds Rate hitting 4% and the 20 year bond yielding 4.42%.
Effective Federal Funds Rate vs. 20 Year Nominal Bond Yield, May 1958 through January 1962
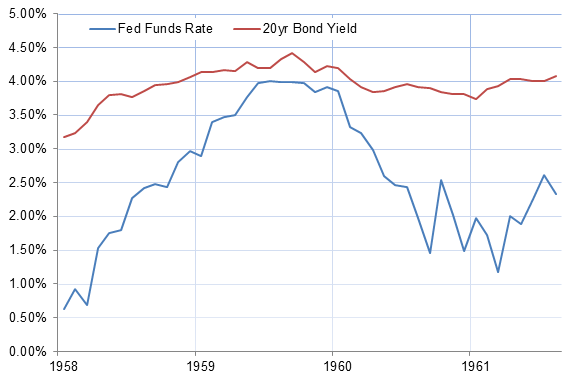
What is immediately striking is how little the 20 year bond yield moved in relation to the short-term rate. The Fed Funds Rate moved up from 0.68% to 4%, a whopping 332 basis points, in about a year and a half. Yet the 20 year bond yield only moved up 125 basis points over the same period. This leads to our first key insight.
Insight #1: The long-term bond yield will not move in-line with short-term rate changes
This can be understood by examining the fundamentals of the bond market. The yield on a 20 year bond is basically a weighted average of the expected interest rates over the next 20 years, plus some risk premium to account for the long holding period of the bond. Basically, even if short-term rates rise to 3%, investors still take into account the likelihood that they will probably fall again in the future. This also explains why short-term rates can sometimes rise above long-term yields, which is an indication that the market is expecting rates to fall significantly within a few years.
How this applies today
The 20 year yield will change primarily due to long-term expectations about inflation and economic growth, which are only partly influenced by the actions of the Fed. It is not 'inevitable' that yields will rise significantly when the Fed begins raising rates.
Returning to the 60s, here is how the 20 year bond index performed over that time.
Performance of 20 Year Nominal Treasury Bonds, May 1958 through January 1962
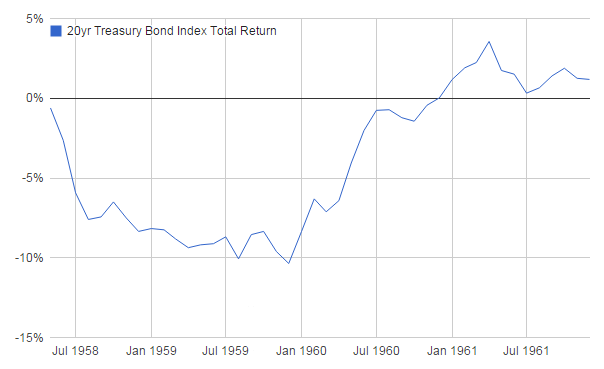
It was surprising to see a mere 10% maximum loss, given that yields were up 125 basis points during that period. This loss was mitigated by the fact that bonds continue to pay interest over time, which eases the impact of increasing yields.
Insight #2: The effect of changing yields on bond returns will depend heavily on the speed of the changes.
In the case study above, interest rates rose over the course of about a year and a half. During that time, 20 year bonds paid about 6% in interest. Returns would have been much worse had yields changed by 125 basis points overnight, or much better had it taken longer.
How this applies today
The idea that rates are so low that they 'must go up' is too simplistic. The speed at which they rise will have a significant impact on the rate of return. If the outlook for the economy remains slow to moderate, interest payments may continue to provide a positive return in the meantime.
Meanwhile, it is also worth noting how quickly bonds recovered once another recession took hold in the middle of 1960. The overall return for this period was 1.18%.
Period 2: The boom of 1961 to 1969, the second longest expansion in history
Another recession would not hit the US for almost a decade. The expansion was so strong that the Fed Funds Rate reached over 9% in 1969, and interest rates were rising nearly throughout. In theory, this should represent close to a worst case scenario for bonds. Let's examine what actually happened.
Effective Federal Funds Rate vs. 20 Year Nominal Bond Yield, January 1962 through September 1969
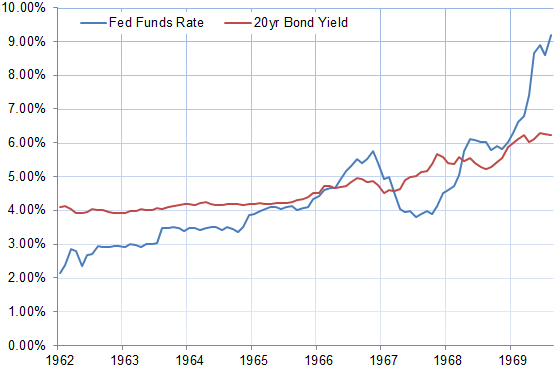
Surprisingly, from 1962 through the end of 1965, long-term yields remained basically unchanged. They began at 4.10% but had only risen to 4.30% in October 1965. The economy provided steady, predictable growth - so predictable that the bond market saw little reason to change their overall outlook.
Insight #3: Bond market yields are based on expectations. If everything continues to go exactly as expected, yields may not change at all.
Even though short-term rates steadily rose through this 3 year stretch, long-term yields were little changed. The most likely explanation for this is that the rate hikes were fairly predictable, and happened as the market expected. The perceived 20 year horizon did not change significantly as this was occurring. It may have seemed that the economy would continue at a 4% nominal growth rate forever. It was only the threat of unexpected inflationary pressure in 1966 that prompted a re-evaluation.
How this applies today
The market already has expectations built-in for every Fed announcement over the next few years. Rather than focus on whether rates change, the focus should be much more intently on whether rates change in a way that is different than the market predicted. There is a real possibility that long-term yields do not change at all even as short-term interest rates move up.
Performance of 20 Year Nominal Treasury Bonds, January 1962 through September 1969
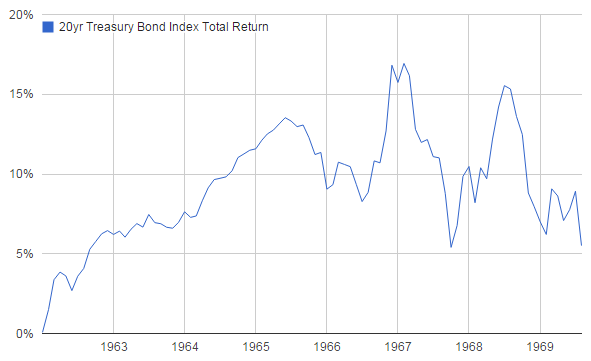
Bonds returned over 13% between 1962 and 1965 as rates remained steady around 4%.
By 1966, however, the strong growth of the past decade had begun to create a strong inflationary tailwind. The Fed began more aggressively increasing rates, only to back off again ahead as the economy headed towards another mild recession. However, it soon became clear that inflation was becoming a serious problem, and the Fed Funds Rate soared from 3.79% in July 1967 to 9.19% in August of 1969. Bond yields rose from 5% to 6.22% over the same period. However, the lessons from earlier in history held true: Bonds only lost about 10% from their peak, as the contraction extended over two years, and yields moved up significantly less than the short-term rate.
The total return of long-term bonds for the decade was about 5%. While this is certainly a poor return on investment, it is worth highlighting an emerging pattern.
Insight #4: The slow-changing nature of long-term interest rates, compounded with the receipt of coupon payments over time, mitigate the impact of bond losses in a bear market.
We have now observed two extremely bearish environments for bonds, but did not experience a loss of more than 10% in either. In fact, returns managed to be net positive from 1958 through 1969, even though the Fed Funds Rate went from 0.68% to over 9%.
How this applies today
The doomsday predictions for the bond market are likely overblown. While it would not be unexpected to experience a 10% loss in a given year, it would require a radical, sudden shift in the economic outlook to experience anything worse.
Period 3: Stagflation rears its ugly ahead, 1969 to 1975
The 1970s began a difficult era for the country. As the Vietnam War raged on and government spending increased, inflation persisted even as unemployment rose. The Fed was caught in a difficult trap, and wavered between combating the pressure on prices and stimulating the economy. OPEC added to the situation by quadrupling prices in the oil crisis of 1973. The US experienced a significant recession from 1973 to 1974, along with the crash of the Bretton Woods system and a dramatic devaluation of the US dollar.
Effective Federal Funds Rate vs. 20 Year Nominal Bond Yield, September 1969 through October 1975
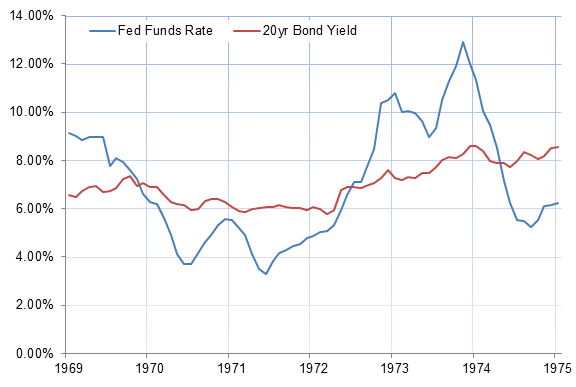
Amidst this, long-term bond yields vacillated as well. As the Fed tried to stimulate the economy in the early 70s, yields dropped slightly. However, once the oil crisis hit and inflation continued to rage, yields began a steady upward trajectory, hitting 8.57% in September 1975. Though the Fed teetered back and forth amidst the recession, it became clear to the bond market that the inflationary pressures were unlikely to abate.
Performance of 20 Year Nominal Treasury Bonds, August 1969 through October 1975
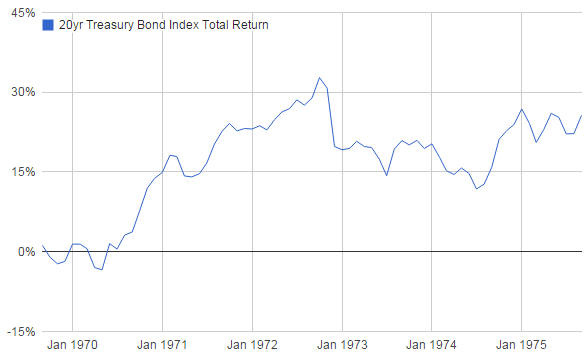
Even amidst this disruption, bonds still managed a net 25% return over this stretch. Though yields went from 6.5% to 8.57%, the economic turmoil and low rate of real growth created an extremely choppy environment. As yields swung back and forth, bonds continued to pay a relatively high interest rate, which more than made up for the downward pressure on bond prices.
Insight #5: A period of unexpectedly high inflation often has a negative impact on the economy as a whole, depressing real growth and creating the risk of recession. This mitigates changes in the bond yield.
While inflation is typically associated with rising yields and bond losses, the broader macroeconomic picture must be taken into account. If inflation becomes a big problem, prices will be going up across the board while wages typically lag behind. This can cause a rapid decrease in real spending, and plunge the economy into a recession. Thus, even as long-term bond yields increase due to inflation, the possibility of low or negative real growth keeps the yield in check.
How this applies today
Inflation hawks speak in terms that are too absolute as it relates to the bond market. If the Fed has really created systemic inflation risk in the economy, stagflation may become a much bigger problem than rising yields, in which case, bonds would remain a better investment than stocks (in particular, inflation-protected bonds). A period of prolonged, steady growth, like the 60s, is likely worse for bonds than high inflation would be.
Period 4: The Volcker Effect and 19% interest rates, 1975 to 1982
Ah, the final frontier. Paul Volcker made a dramatic stand against inflation in 1979 and 1980, raising the Fed Funds Rate to nearly 20% to stamp out the vicious cycle once and for all. While his efforts were successful, he set the stage for the bond market bottom in 1981 which is so liberally referenced nowadays. If this stretch, then, is the absolute worst that could happen, let's see what's in store.
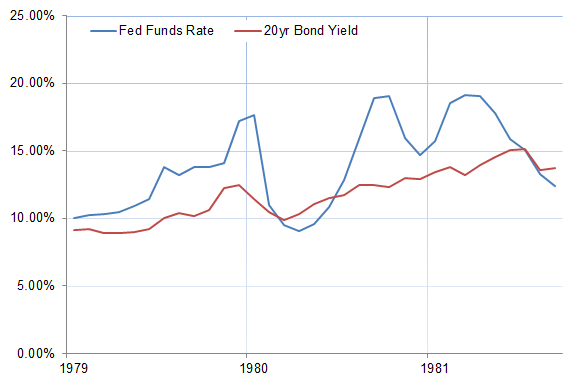
Effective Federal Funds Rate vs. 20 Year Nominal Bond Yield, October 1975 through January 1982
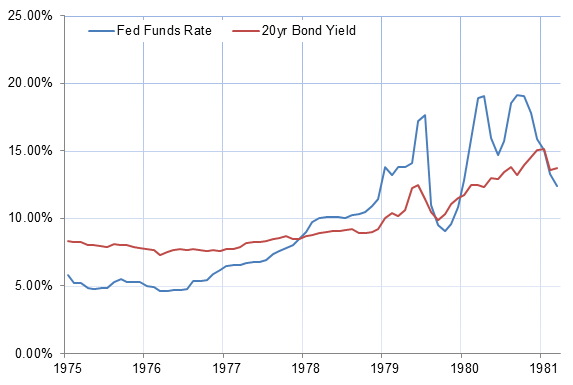
The Fed Funds Rate started at 5.82%, and ended at 12.37%. It peaked around 19% in June 1981. The 20 year bond yield started at 8.35% and ended at 13.73%, peaking at 15.13% in October 1981.
Performance of 20 Year Nominal Treasury Bonds, October 1975 through January 1982
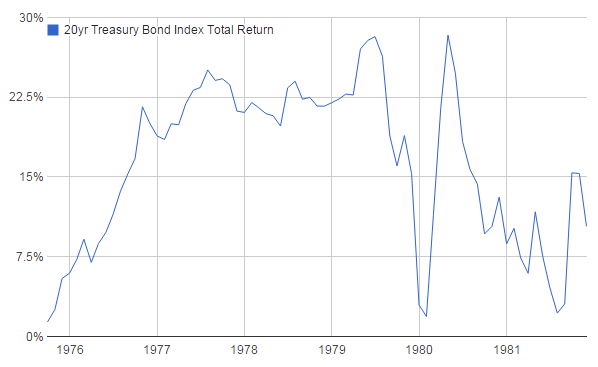 .
.
Don't worry, we'll zoom in a bit on the worst of this graph, but it is certainly worth pointing out that somehow, someway, net returns were still positive over this stretch. Of course, it is no mystery. From 1976 to 1979, yields were little changed. They started at about 8.35% and were barely changed by the end of 1978. Over this time period, they continued to pay interest. This is just another example of the economy moving sideways for a while, and bonds benefiting as a result.
Keeping that in mind, let's shrink the timeline to begin when interest rates took off near the end of 1979.The Fed Funds Rate nearly doubled by 1982, going from 10% to 19%, or a ridiculous 900 basis points. Bond yields went from 9.12% to a peak of 15.13%.
Effective Federal Funds Rate vs. 20 Year Nominal Bond Yield, April 1979 through January 1982
Performance of 20 Year Nominal Treasury Bonds, April 1979 through January 1982
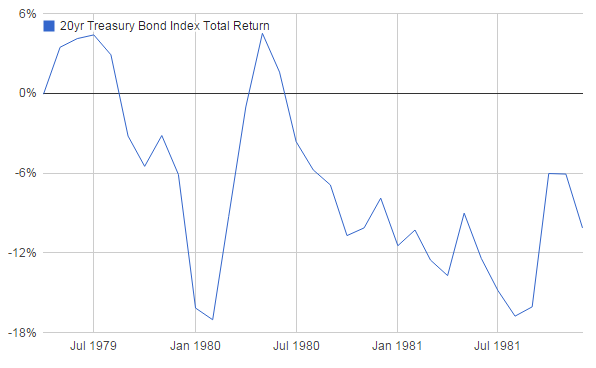
This is likely a picture of about the worst bond crash in the past century. Bonds were off a little more than 17%, once in 1980 and then again in 1981. The first dip happened in about 10 months, one of the fastest bond crashes in history.
Insight #6: The worst bond crash in history happened over the course of 10 months and resulted in a net loss of 17%. It is extraordinarily unlikely that we will witness something worse in the near future.
This period represents a reasonable baseline for the worst that it could get. It is also worthwhile to frame what would have to happen right now to repeat such a scenario.
How this applies to today
Given yields are so low right now, they would have to change much less to result in the same 17% loss. At today's yield of approximately 2.90%, it would take a sudden rise of about 140 basis points, to 4.30%, over the course of 10 months.
We can return to the 50s to better understand what kind of change in the Fed Funds Rate might be expected alongside such a shift. The last time yields were at 2.9%, in 1955, the Fed Funds Rate was 1.64%. Yields did not hit 4.30% until the Fed Funds Rate rose to 4.0% in 1959, or a 236 basis point increase.
That means the Fed today would have to have cause to raise rates 9 times, in a 10 month period (assuming a 25 basis point increase per adjustment). It would take something extraordinary to witness such a move.
Summary: Applying these insights to today
The bond market experienced an extremely strong pullback over the course of 2013, only to recover just as strongly this year. With the insights from 1958 to 1982 in mind, we now have more context to evaluate this shift.
Effective Federal Funds Rate vs. 20 Year Nominal Bond Yield, April 2013 through October 2014
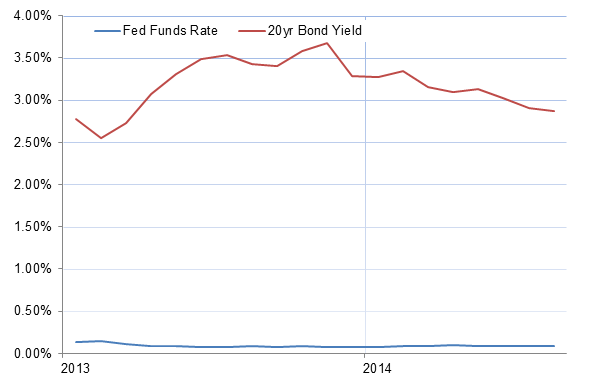
Performance of 20 Year Nominal Treasury Bonds, April 2013 through October 2014
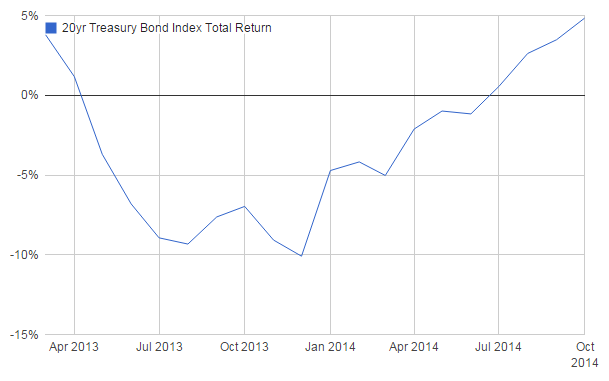
20 year bonds experienced an unbelievably rapid rise in yields without any corresponding shift in short-term rates in 2013. Losing 10% in a matter of months, this crash was on par with historical periods when either inflation or the economy was booming. Expectations were building in an incredibly rapid, and rare, succession of rate hikes that ended up not materializing.
While some bond fears are justified, and there is certainly the possibility of losses again in the future, the market is likely overreacting to the current low interest rate environment. It took over 20 years for rates to reach a peak last time this happened, over the course of which bonds often had positive returns. Many different recessions and expansions occurred throughout, all of which provided different investment opportunities. Just as no one can ever predict the future, don't listen to anyone predicting the imminent demise of long-term bonds. They might not be the best bet for the next 20 years if rates are going to hit 19% again, but does that really seem likely?
Perhaps the only thing that seems certain is that in today's age of sensationalism, markets will probably continue to overreact. Judging by how bonds have performed since bottoming last year, each overreaction may simply present a new investment opportunity.
Hopefully this historical perspective can help you better evaluate the next bond rally or crash.
Disclosure
This information does not constitute investment advice or an offer to invest or to provide management services and is subject to correction, completion and amendment without notice. Hedgewise makes no warranties and is not responsible for your use of this information or for any errors or inaccuracies resulting from your use. Hedgewise may recommend some of the investments mentioned in this article for use in its clients' portfolios. Past performance is no indicator or guarantee of future results. Investing involves risk, including the risk of loss. All performance data shown prior to the inception of each Hedgewise framework (Risk Parity in October 2014, Momentum in November 2016) is based on a hypothetical model and there is no guarantee that such performance could have been achieved in a live portfolio, which would have been affected by material factors including market liquidity, bid-ask spreads, intraday price fluctuations, instrument availability, and interest rates. Model performance data is based on publicly available index or asset price information and all dividend or coupon payments are included and assumed to be reinvested monthly. Hedgewise products have substantially different levels of volatility and exposure to separate risk factors, such as commodity prices and the use of leverage via derivatives, compared to traditional benchmarks like the S&P 500. Any comparisons to benchmarks are provided as a generic baseline for a long-term investment portfolio and do not suggest that Hedgewise products will exhibit similar characteristics. When live client data is shown, it includes all fees, commissions, and other expenses incurred during management. Only performance figures from the earliest live client accounts available or from a composite average of all client accounts are used. Other accounts managed by Hedgewise will have performed slightly differently than the numbers shown for a variety of reasons, though all accounts are managed according to the same underlying strategy model. Hedgewise relies on sophisticated algorithms which present technological risk, including data availability, system uptime and speed, coding errors, and reliance on third party vendors.