


Summary
- Many clients wonder whether they should adjust their approach depending on market conditions
- However, risk-managed strategies are constantly responding to the current environment, such that attempts at timing are usually counterproductive
- After a quick review of why this is consistent with the underlying theory, I'll analyze a few of the most common "timing" questions to see if they have any merit:
- Should I wait to put cash to work until after a period of large losses?
- Should I take cash off the table after a period of large gains?
- Should I invest elsewhere if I think an equity or bond bear market is approaching?
Risk Management versus Timing
If inflation, trade wars, data leaks, slowing global growth, or government instability has given you pause on the investment outlook, you are certainly not alone. It's hard not to wish that you had just sold everything in January, or not to wonder whether you should still sell everything now. The good news is that Hedgewise frameworks have already shifted to account for these market conditions, and the future outlook remains excellent. The bad news is that you will still likely wonder whether you can time it better yourself, but fortunately we can look to the theory and data for guidance.
While Hedgewise runs two different risk-managed frameworks - Risk Parity and Momentum - they are rooted in the same core financial principles:
- Investors generally expect a positive return on their investments, so in normal environments, markets appreciate over time
- Diversification across different kinds of assets, like stocks and bonds, reduces risk by offsetting short-term gains and losses
- As market risk goes up, so does the probability of large gains or losses
Hedgewise then uses financial engineering, like leverage and risk balancing, to most effectively apply these concepts to its products.
Note that none of these principles require you to figure out whether assets are over- or under-valued, which tends to be incredibly difficult. This kind of "timing" usually backfires because it requires that you know the exact right time to enter or exit. One of the main reasons that risk management is effective is because it avoids the need for such precision.
When relying on the relatively simple principles above, the focus shifts away from short-term returns and towards long-term stability and loss reduction. When this is done intelligently, it means your portfolio is constantly maximizing the odds in your favor. Positive returns are always more likely than not, even in the worst of market conditions.
Clients often find this counterintuitive because 1) it seems impossible that return expectations would be positive if markets are about to collapse, and 2) risk-managed strategies still undergo periods of loss, which in theory might be timed. However, because these periods of loss are driven by the relationships between different assets and their volatilities, they often have little to do with bear markets. For example, both Risk Parity and Momentum wound up with calendar year gains during four of the last five major stock crashes.
Put another way, to time a risk-managed strategy, you'd need to be able to predict when fundamental asset relationships and risk indicators are about to breakdown in conjunction with a major market crash - a tall order indeed! These kinds of events tend to be quite sudden, random, and short-lived by definition.
Now, it is true that the probabilities of gain or loss do shift in certain market conditions - for example, you have a better than normal chance that risk-managed strategies will do well after a period of loss. But in waiting around for a loss to happen, you'll probably miss substantial gains in the meantime. No matter which way you cut the scenario, the same theme arises: it's tremendously difficult to beat the simple approach of buy-and-hold.
Scenario 1: Waiting for a Loss
It's far easier to invest with confidence when assets look cheap, and many prefer to wait on the sidelines until after some kind of crash. This is always a tricky topic because, in hindsight, it's true that you make more money if you buy low, and cash also carries great comfort for the risk averse. The problem is that risk-managed strategies are hedged across many different kinds of assets, so a crash in a single market often doesn't result in net losses to the portfolio.
As an illustration, here are the rolling 1yr returns since 1972 for Risk Parity High, Momentum High, and a 50/50 split between the two.
1yr Rolling Returns By Strategy Since 1972
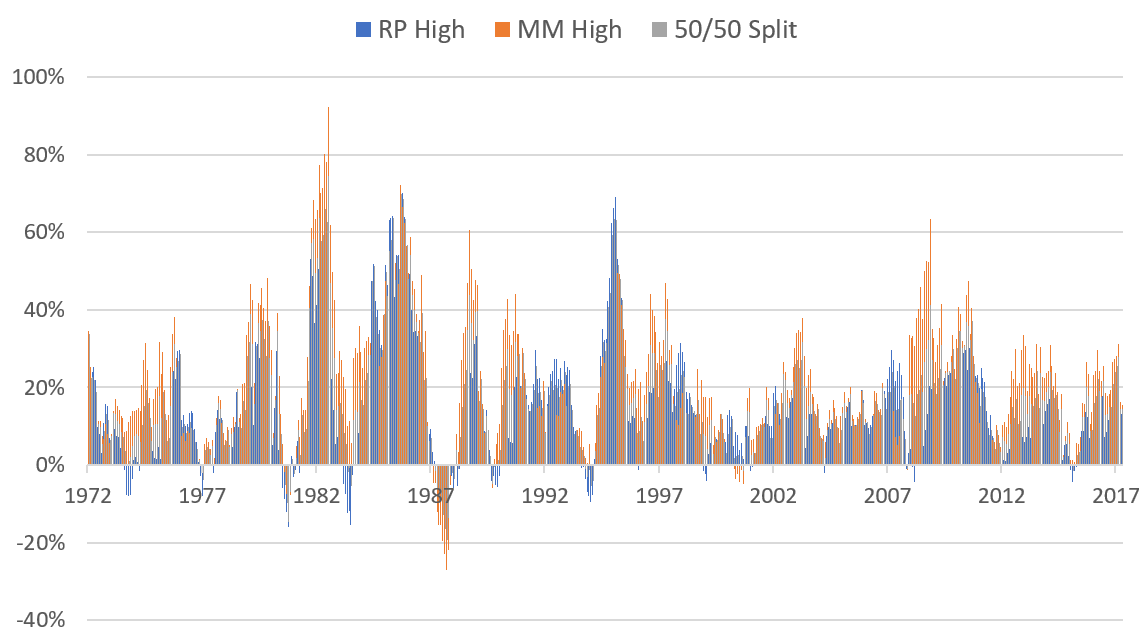
Depending on your strategy mix, you've historically had about a 6-10% chance of incurring a loss over the following 12 months, or conversely a 90-94% chance of incurring a gain. Most of these losses were also fairly minimal; there was a less than 2% chance of incurring a loss of 10% or more.
That said, you may still figure that waiting for one of these periods still bumps your odds up further, and you'd be right: if you happen to start after a twelve-month loss, your historical odds of a subsequent gain go up to over 98%. But the question is not whether the odds improve, but rather if it makes sense to wait around for that to happen.
A simple way to answer this question is to calculate a "breakeven point" in time. That is, the date where the gains you would have accrued before the subsequent drawdown were greater than the drawdown itself. This assumes that you also had the magical ability to invest right at the exact bottom of each pullback. Performance is drawn from the 50/50 split portfolio (though RP/MM alone show similar numbers).
| If you got in at the exact bottom in.. | You'd still be worse off than if you started.. |
|---|---|
| Jun 1978 | 7 months earlier |
| Sept 1981 | 17 months earlier |
| Jun 1984 | 8 months earlier |
| Aug 1988 | 23 months earlier |
| Sept 1990 | 5 months earlier |
| Nov 1994 | 17 months earlier |
| Aug 2001 | 2 months earlier |
| Jan 2016 | 4 months earlier |
On average, you lost about 10 months' worth of gains. In other words, to successfully take advantage of an upcoming period of losses, you need to a) correctly identify the 10% chance that losses are going to occur at all, b) be pretty sure it's not more than 10 months away, and c) know exactly when the drawdown hits bottom. If you fail on any single one of these conditions, you'd be better off investing now rather than waiting.
That said, there are understandable exceptions: you may keep a discretionary pool meant for more opportunistic investing, you may have new savings become available at a distinct point in a year, or you may be quite confident in your ability to foresee an upcoming loss. In these cases, you'd like to know when the probabilities for a near-term gain are the most favorable.
One way to study this is to compare the size of any current drawdown in the strategy framework to the subsequent returns. Performance is drawn from the 50/50 split portfolio, but RP/MM alone again show similar numbers.
Forward Return of the 50/50 Split Portfolio for Various Timeframes, by Size of Drawdown
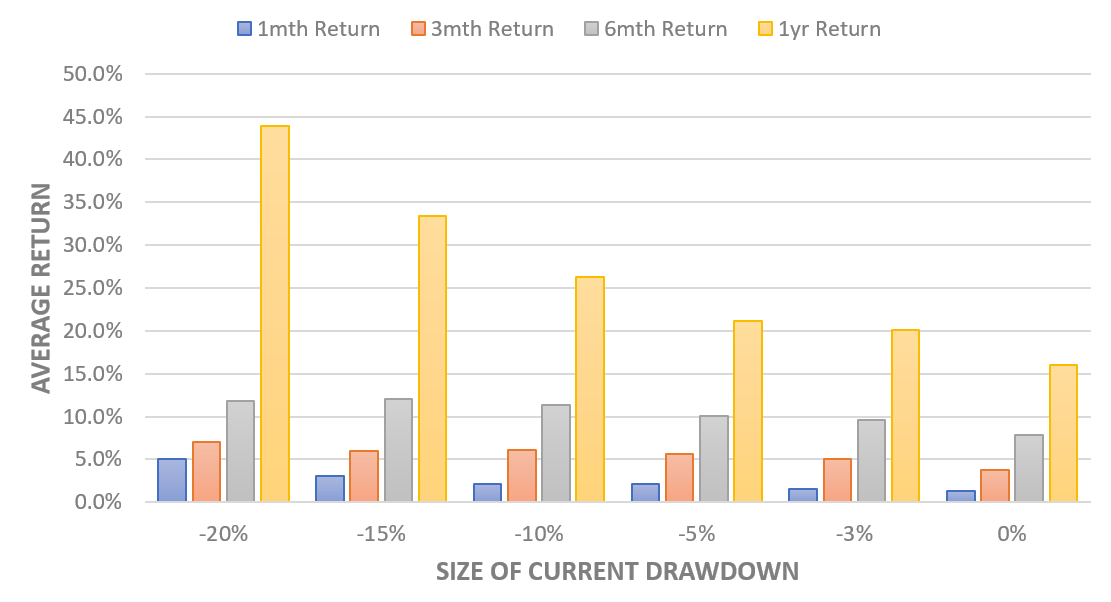
Interestingly, even drawdowns as small as 3% substantially increased the size of future returns. While it might seem tempting to wait and capitalize on the bigger losses, they are extremely infrequent: the last 15% drawdown happened in 1988. A more reasonable target would be anywhere in the 5-10% range, which you'll usually see every other year or so. But remember, if you sit in cash for more than a couple of months, you'll probably miss more gains than even a successful timing attempt will recoup.
Applying this analysis to today, we experienced a drawdown in the 50/50 strategy of around 10% from January 26th through February 8th. Historically speaking, there's around a 95% chance we are already past the bottom. While there's been some recovery since then - the current drawdown is now more like 7% - it is still quite an attractive time to invest if you happen to be sitting on cash.
Scenario 2: Selling After Gains
Looking back, it seems obvious that the initial fast gains in January were signs of overheating, and to wonder whether there was a way to identify that beforehand. However, nothing in the underlying theory suggests that gains of a particular size or speed should be worrisome. After all, we expect gains to happen 90% of the time, and the techniques of hedging and risk management are always limiting the impact of an individual asset bubble or crash. To test this, we can compare short-term gains in the 50/50 strategy to subsequent historical returns. To further isolate "overheating" scenarios, this data is also limited to months in which there was no recent drawdown.
Forward Return of the 50/50 Split Portfolio for Various Timeframes, by Size of Prior 1 Month Gain
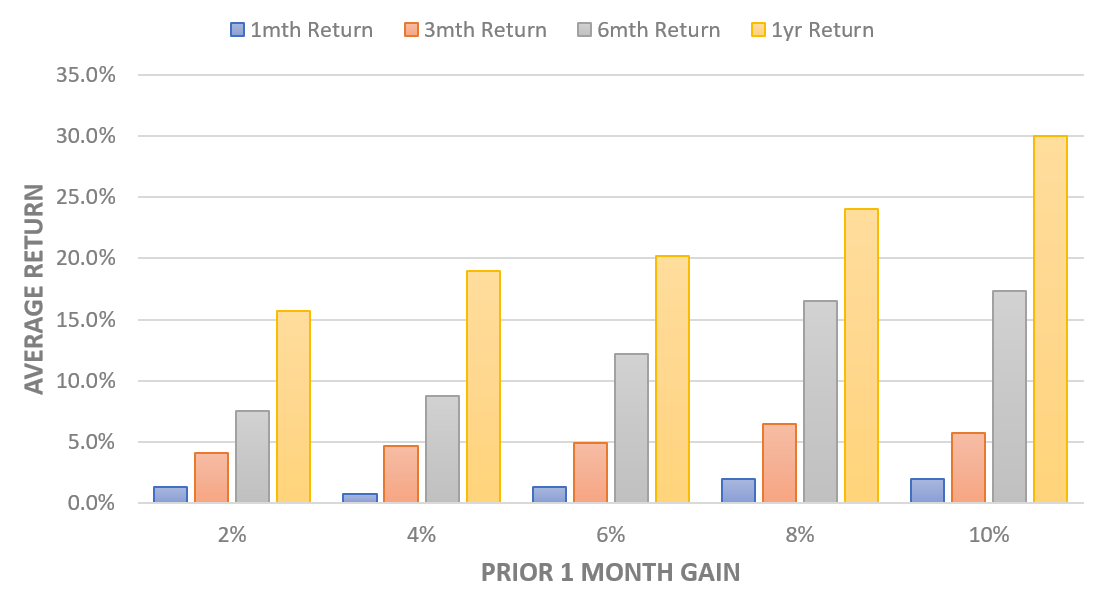
This data shows no indication that large gains typically precede losses. In fact, quite the opposite: forward-looking returns often increase instead! Digging into the numbers, it is unsurprising to learn that you see clusters of great returns in the middle of broad, calm bull markets - years like 1997, 2006, or 2017. In these periods, when you had a fantastic one-month gain, you typically went on to have many more of the same. This same pattern shows up using prior three-month, six-month, and one-year gains as well; there's simply nothing to suggest that big positive returns frequently reverse.
If a risk-managed strategy is implemented well, this is what you'd expect. While individual asset classes like equities may become "irrationally exuberant", such risks are explicitly built into the frameworks and minimized. Though occasional drawdowns are inevitable, they tend to be quite random, and certainly have nothing to do with recent performance trends.
Scenario 3: Timing Bear and Bull Markets
The final timing question that many clients wonder is: what if it is just a bad time to be invested in general? For example, if you knew that bonds and/or stocks were going to do poorly for the next year, wouldn't you be better off exiting?
Even if you had the ability to correctly forecast an upcoming downturn, that wouldn't necessarily mean that risk-managed strategies make a bad investment. Returning to the theory, different asset classes will perform differently depending on the underlying economic environment. For example, in a recession, gold and bonds will tend to rally while stocks will tend to fall. So long as these relationships hold up as expected, risk-managed strategies should be quite resilient against individual asset crashes.
To test this, we can examine the performance of the 50/50 split portfolio in the worst-performing stretches for both stocks and bonds. Starting with equities, the following table displays tranches of every rolling one-year period of losses in the S&P 500 since 1972 and summarizes how the 50/50 split portfolio performed over the same periods. Note that the "% Gain" and "% Loss" columns display the number of data points when the 50/50 portfolio had either a gain or loss out of the total number of data points within tranche.
Rolling 1yr Performance of the 50/50 Split Portfolio During Equity Drawdowns
| 50/50 Split Performance | ||||
|---|---|---|---|---|
| S&P 500 1yr Loss | Avg. | % Gain | % Loss | |
| 0-5% Loss | +5.4% | 67.7% | 32.3% | |
| 5-10% Loss | +4.3% | 69.6% | 30.4% | |
| 10-15% Loss | +7.6% | 87.5% | 12.5% | |
| 15-20% Loss | +9.8% | 90.9% | 9.1% | |
| 20-30% Loss | +8.7% | 94.1% | 5.9% | |
| Over 30% | +14% | 88.9% | 11.1% | |
In every single tranche, you averaged gains in the 50/50 split despite losses in the S&P 500. Your odds of a gain also significantly increased along with the size of the equity pullback. This is because risk-managed strategies tend to minimize equity exposure as losses increase, while safe-haven assets like bonds and gold rally. In fact, the strategies tend to be most vulnerable to "small" losses (under 10% or so) that occur when the market is still trying to "figure things out". For example, in our most recent pullback, bonds and gold have not rallied much despite the pullback in equities because it is not yet certain that a recession is imminent. Of course, these short periods are all the more difficult to time!
Now let's repeat these same numbers for bonds to make sure the story is consistent. Note that the loss ranges had to be reduced compared to equities as bonds are far more stable.
Rolling 1yr Performance of the 50/50 Split Portfolio During Bond Drawdowns
| 50/50 Split Performance | ||||
|---|---|---|---|---|
| 10yr Treasury 1yr Loss | Avg. | % Gain | % Loss | 0-1% Loss | +10.2% | 87.5% | 12.5% | 1-2% Loss | +13.5% | 88.2% | 11.8% | 2-3% Loss | +16% | 93.3% | 6.7% | 3-4% Loss | +14.1% | 91.7% | 8.3% | 4-5% Loss | +12.9% | 83.3% | 16.7% | Over 5% | +9.2% | 74.3% | 25.7% |
Bonds exhibit a similar story, though you do see slightly lower (albeit positive) returns for losses of over 4%. Many of the data points in this upper range come from periods of high inflation, during which both stocks and bonds tend to do poorly while commodities provide a hedge. This presents less opportunity for net upside as commodities are naturally a smaller portion of the portfolios. At worst, though, you averaged a 9.2% annual return and a 75% chance of gains.
Summing up the numbers, it really didn't make sense to avoid risk-managed strategies even if you had perfect insight about upcoming equity and bond pullbacks. Your worst-case returns were around 4-5% during smaller equity pullbacks, while in all other cases you achieved returns of 8% or more. Those are pretty stellar numbers in years of very rocky markets.
Conclusion: Staying the Course, Expecting a Few Bumps
Put simply, risk-managed strategies are really effective at dealing with worst-case scenarios. They assume that bubbles and crashes are part of the norm, but since this logic is already built-in, you can't apply traditional thinking like how to "get out at the top" or "get in at the bottom". Neither a stock crash nor a bond crash will necessarily result in losses; more often, the portfolio is vulnerable to quick pullbacks or markets that have a great deal of uncertainty. Even if you could time these situations, the losses are usually pretty small and not worth the headache of figuring out when to re-enter. If you try to time unsuccessfully, the gains you miss quickly outweigh any potential benefits.
None of this is to suggest that these frameworks are invulnerable, but rather that the probabilities are enormously in your favor if you invest early and stay patient. You will certainly have a few situations where this patience is tried: you may underperform the S&P 500 for stretches of time, hedges will fail to work in certain situations, and markets will sometimes be blindsided by the unpredictable. Despite all of that, there is an extraordinarily high chance that you will go on to perform wonderfully if you simply shrug your shoulders.
For discretionary pools, you've generally found good entry points during drawdowns of 5-10% or during periods of consistently large gains, regardless of surrounding market conditions. That said, if you don't currently have better uses for your discretionary funds, or if in reality you are just trying to optimize the entry point for your broader portfolio, the best path is almost certainly the simplest: invest now at your long-term risk level, and don't worry about the timing.
Disclosure
This information does not constitute investment advice or an offer to invest or to provide management services and is subject to correction, completion and amendment without notice. Hedgewise makes no warranties and is not responsible for your use of this information or for any errors or inaccuracies resulting from your use. Hedgewise may recommend some of the investments mentioned in this article for use in its clients' portfolios. Past performance is no indicator or guarantee of future results. Investing involves risk, including the risk of loss. All performance data shown prior to the inception of each Hedgewise framework (Risk Parity in October 2014, Momentum in November 2016) is based on a hypothetical model and there is no guarantee that such performance could have been achieved in a live portfolio, which would have been affected by material factors including market liquidity, bid-ask spreads, intraday price fluctuations, instrument availability, and interest rates. Model performance data is based on publicly available index or asset price information and all dividend or coupon payments are included and assumed to be reinvested monthly. Hedgewise products have substantially different levels of volatility and exposure to separate risk factors, such as commodity prices and the use of leverage via derivatives, compared to traditional benchmarks like the S&P 500. Any comparisons to benchmarks are provided as a generic baseline for a long-term investment portfolio and do not suggest that Hedgewise products will exhibit similar characteristics. When live client data is shown, it includes all fees, commissions, and other expenses incurred during management. Only performance figures from the earliest live client accounts available or from a composite average of all client accounts are used. Other accounts managed by Hedgewise will have performed slightly differently than the numbers shown for a variety of reasons, though all accounts are managed according to the same underlying strategy model. Hedgewise relies on sophisticated algorithms which present technological risk, including data availability, system uptime and speed, coding errors, and reliance on third party vendors.