


The Foundation of Outperformance
Hedgewise was founded on the idea that core financial theory can be used to improve returns and reduce risk. By focusing on 'first principles' of markets - why they function the way they do, what drives prices, and how they relate to broader economic trends - Hedgewise develops theories that are similar in nature to those found in the physical world, like the laws of gravity. Any truly superior and lasting investment strategy must have such a basis to be relied upon over many decades.
While it may initially sound outlandish to compare financial theory to the laws of nature, there are a number of well-known ideas that already rise to this level. Diversification is probably the most familiar, which asserts that holding a basket of assets will always result in better returns with less risk than holding just a few. This largely explains why more than 90% of stock-picking managers have failed to beat index benchmarks over the last 15 years.
On the other hand, there is also a misperception that passive index funds are the best and final application of financial theory. For example, if you are relatively young, should you invest entirely in equities? Should you account for radical events like the real estate crash? Should you use leverage in your portfolio? These questions can dramatically alter the composition of your portfolio, but passive funds provide few compelling answers.
The reality is that passive index funds are better building blocks of a portfolio than individual stocks, yet they only represent the tip of the iceberg in terms of understanding and applying financial theory. As time goes on, I believe 'active' management will remain alive and well, but will be represented only by funds which have developed a deeper and more accurate understanding of how markets operate, rather than a handful of individual stocks. These new kinds of portfolios will naturally outperform simple passive strategies in the same way that those simple strategies have outperformed stock-picking: because the theory represents something true and unavoidable in the marketplace.
Every Hedgewise product is built on this same philosophical foundation, and there have been a number of recent market developments that lend further proof that the theories in use are quite powerful, and already producing superior outcomes for Hedgewise clients.
Theory One: A Foundation of Risk Premia
A 'risk premium' is the amount that an investor discounts the expected returns from any investment to compensate for the possibility of loss, and to account for other competitive potential investments. For example, if you might realistically lose half your money, you'd expect a higher potential return than if you might only lose 5% of your money.
We can call the amount an investor is willing to pay for an investment today it's 'Present Value', and represent that calculation with the following formula:
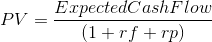
Where 'rf' is the risk-free rate, and 'rp' is the risk premium attached to that investment. The higher the risk, the less you are willing to pay for an investment today. The more skilled investors are at understanding and predicting the future, the closer you'd expect their realized return to match the risk-free rate plus the assigned risk premium.
If this theory holds, you'd also expect to see higher realized returns for stocks than government bonds, since you are basically guaranteed a return on bonds if you are willing to wait until maturity. You'd also expect a higher return on bonds than on commodities, since commodities have many various uses outside of being a pure investment (e.g., you can use sugar to make food products for a profit).
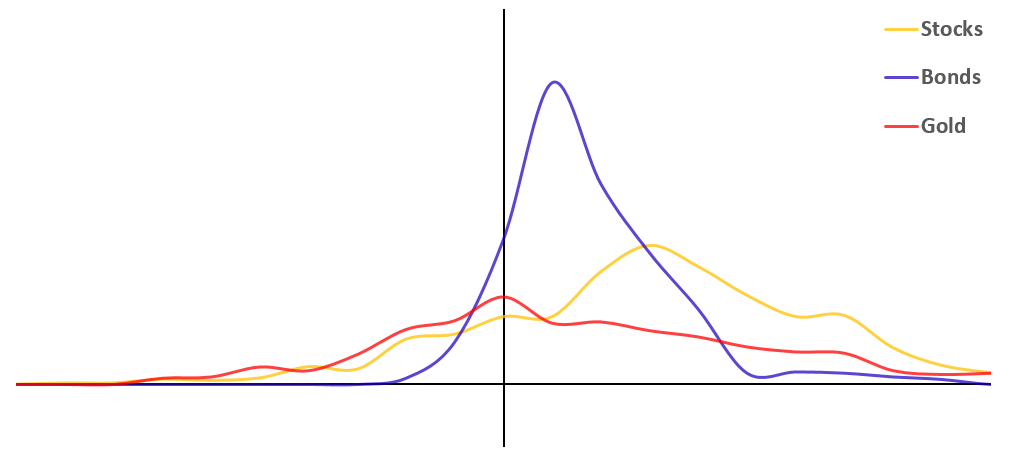
If this theory is true conceptually, you'd expect return curves to look something like the following:
Theoretical Realized Return Bell Curve, by Asset Class
This conceptual basis is important because it provides a framework for answering some interesting questions, mainly:
- How skilled are investors in different asset classes at predicting the future? The more skilled they are, the more that returns should converge with the assigned risk premium.
- Does the theory hold up over certain time horizons but not others? For example, if the theory generally holds up for annual returns but not for monthly returns, then it might be reasonable to attribute monthly returns to random noise and not worry too much about explaining them.
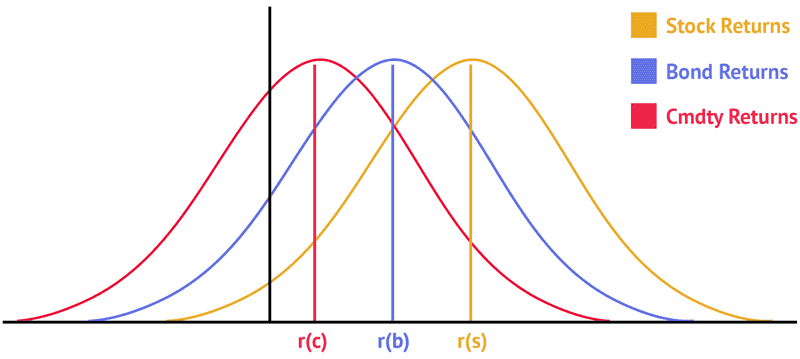
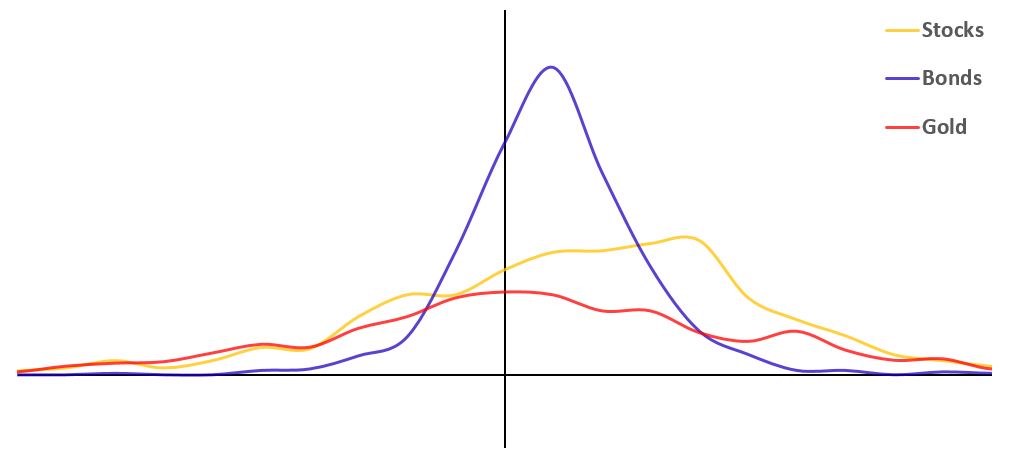
With that in mind, let's take a look at the actual bell curves of asset class returns over a number of different time frames. I'm using the returns of the S&P 500, 10yr Treasury Bonds, and gold as a proxy for commodities. These returns represent the trailing gain or loss for the given time frame, in other words, for the 1yr horizon, you are seeing the trailing 1yr returns for that asset class for every month in history.
One Month Trailing Return Distribution by Asset Class
One Year Trailing Return Distribution by Asset Class
Three Year Trailing Return Distribution by Asset Class
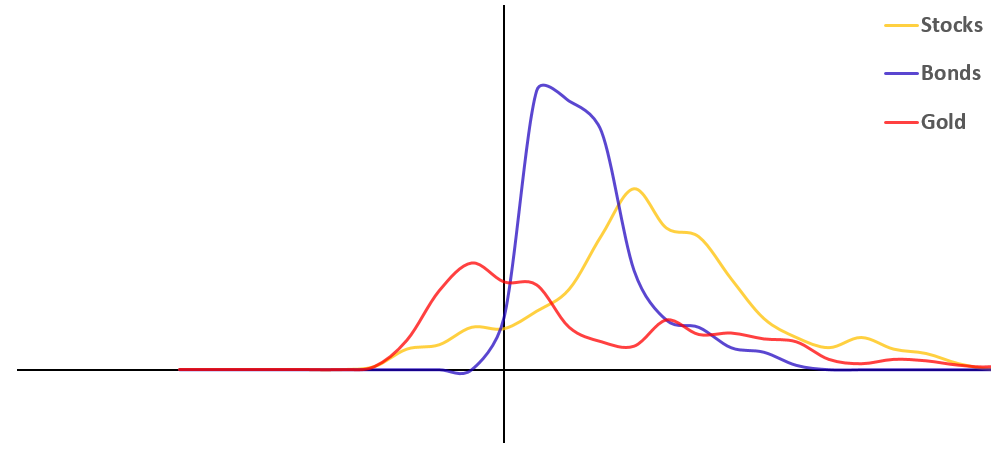
In the final graph using three year trailing returns, the curves are certainly starting to resemble what we expected in theory. This suggests that risk premia are a real force, and that investors are always expecting a positive return from the markets. Because the curves tighten as you look over longer timeframes, it's likely that investors are modeling risk well enough to smooth out most short-term volatility, especially over one month or one year. However, every asset class (especially stocks and commodities) still has a nagging 'left tail' of significant losses even over three years.
Since we just established that investors are formulaically expecting a return, and attempting to account for future risks, the only reasonable explanation for long-term losses are substantial, low probability, or entirely unforeseen negative events.
This leads to a few key parts of how Hedgewise manages its funds:
- I primarily care about gathering as many risk premia as possible, which means I never fight against the markets via things like covered calls or naked puts (although I may short negative risk premia, like in the oil markets).
- I care very little about the normal deviation of prices or upcoming events that are well-known, the impact of which are pretty efficiently smoothed out over time. Instead, almost all of my research is based on managing
potential hidden or poorly forecasted shocks that will radically shift markets.
Tying this back to the theory, this is how I think about the earlier bell curve of one month trailing returns:
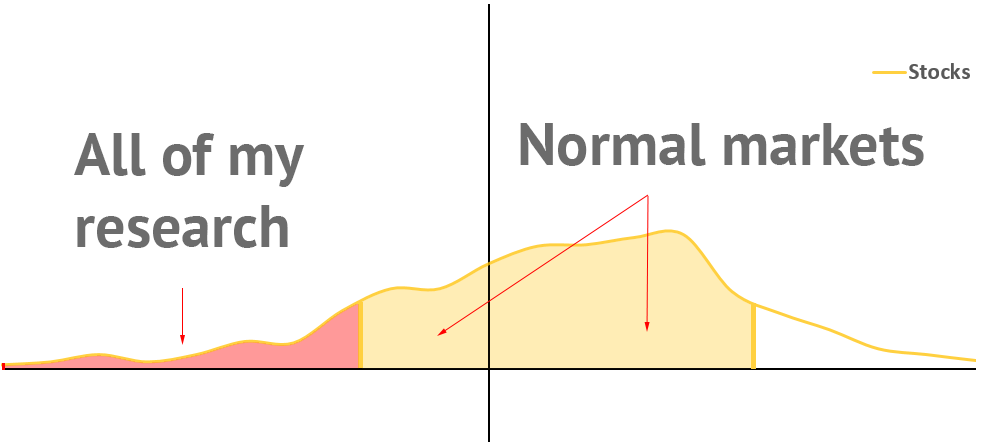
This also helps explain why I do not consider short-term losses, especially week-to-week or month-to-month, to be much of a concern. In other words, I am never trying to predict near-term price movements. Rather, I am managing the risk that a major, negative event might occur. Unless such an event happens, your best move is generally just to do nothing and trust that the odds are heavily in your favor.
Interestingly, this sheds light on why so many active investors get into trouble. There is an enormous amount of noise in short-term returns, and trying to predict it is both really hard and mostly unnecessary. It also dispels the notion that economic indicators like price-to-earnings ratios or the length of the current bull market matter. Investors are pretty reliable in applying risk premia to all currently known information, and they are still building in a positive return expectation. Given that, it's usually a bad idea to avoid the market because it feels 'overvalued'.
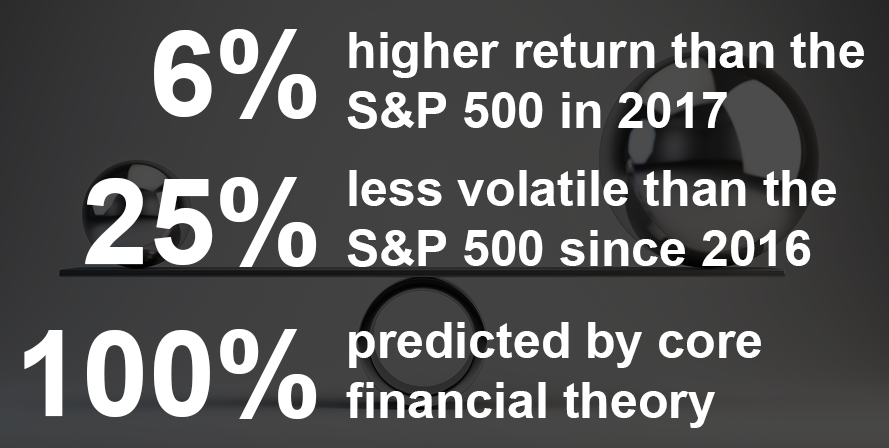
Since launching last November, the Hedgewise Momentum framework has provided a nice example of this theory in action. The theory suggests that most of the time, especially over periods of five years or more, equities will yield a positive return. Then it follows that most of the time, it is safe to be 100% in equities - in fact, it might even sometimes make sense to use leverage and go more than 100% into equities, especially if you ignore normal monthly noise and don't overreact to market events that aren't meaningful, like the types described earlier. The Momentum product is structured to primarily revolve around these ideas and is usually overweight equity markets to varying degrees.
Here's how the Momentum product has performed in live Hedgewise client portfolios since launch. This data is a composite of all live client portfolios using the "Max" risk level, and includes all costs, fees, and dividends as of end of day on June 14th, 2017.
| Month | Momentum | S&P 500 |
|---|---|---|
| November 2016 | 7.02% | 4.81% |
| December 2016 | 2.87% | 2.00% |
| January 2017 | 2.35% | 1.97% |
| February 2017 | 6.56% | 3.90% |
| March 2017 | -0.46% | 0.14% |
| April 2017 | 2.18% | 1.08% |
| May 2017 | 2.68% | 1.33% |
| June 2017 | 1.98% | 1.25% |
| Total | 27.87% | 17.64% |
The outperformance of the product so far ties directly back to the concepts being discussed: equity markets are behaving in a normal range, and the types of market events that have been unfolding over this period, like the US elections, are relatively normal and foreseeable. While the return looks great, it's simple market theory at work.
A natural question is whether this performance would quickly reverse if stocks start to do badly. However, unlike a purely passive index, Hedgewise layers on additional kinds of risk management to maximize the chance that clients will hold on to their gains.
Theory Two: Behave Conservatively in High Risk Environments
The other major piece of the puzzle is the ability to catch major negative market shocks. However, theory suggests that you don't actually need to do be able to predict such events with great accuracy; even if you are only right 20-30% of the time, you'd still expect such a bet to be profitable.
There are two main reasons for this. First, there is the simple law of percentages: If you lose 50%, you then need to then gain 100% to get back to breakeven. Every time you successfully avoid one negative return, you can afford to miss out on a positive return of a greater relative size.
Second, there is the assumption that markets will be working normally far more often than not. Essentially, you are not usually expecting to have an equal chance of making or losing a large amount. Rather, you are expecting a very small chance of losing a large amount and a very large chance of making a small amount. If this is true, you can afford to be wrong about negative shocks far more often then you are right (since you usually don't miss out on very much when you are wrong, but you save a ton when you are right).
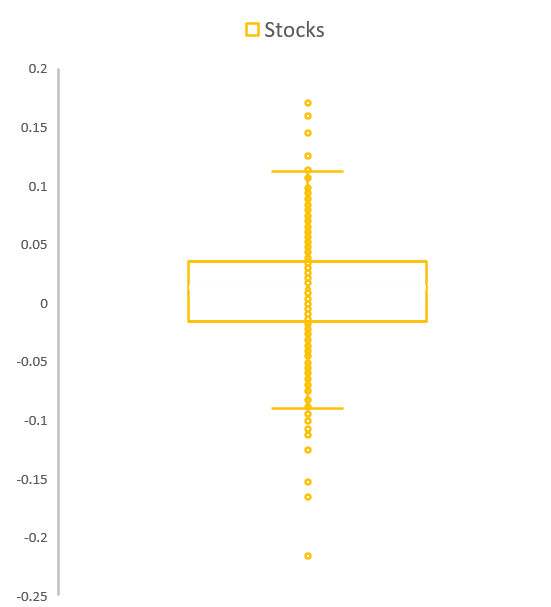
To understand this, it is useful to look at another view of the data. The following is a distribution of all realized one month returns for the S&P 500.
All One Month Trailing Returns of the S&P 500
The goal is to develop an ability to manage risk such that you can avoid a few of the extremely negative returns above. As laid out in the theory, you don't have to have a high probability of success for this to be worthwhile: avoiding one large negative return will compensate for missing many smaller positive returns. There is also no expectation that we can avoid every loss - we only expect that our overall returns will be higher than if we had done nothing to manage risk at all.
The following compares the original chart to a new distribution that removes all historical points deemed 'high risk' using the Hedgewise risk filter.
Comparison of All S&P 500 Monthly Returns to Risk Filtered Monthly Returns
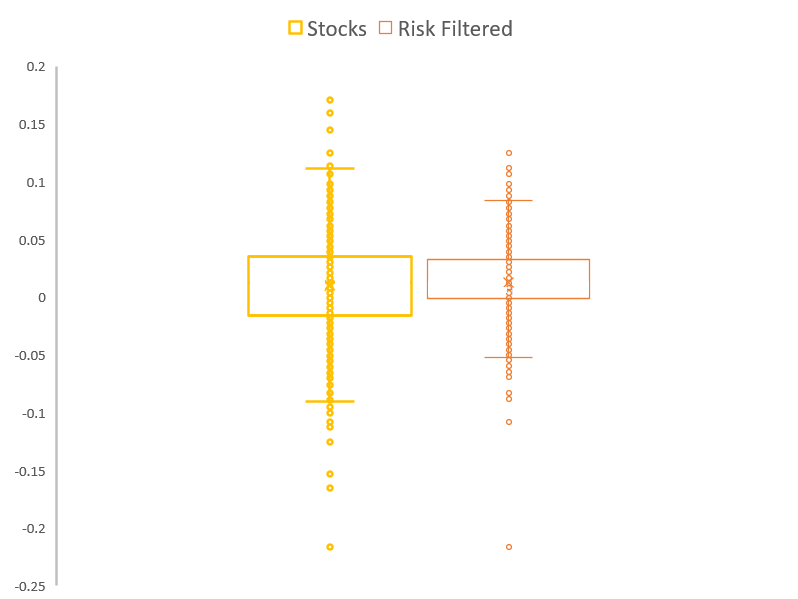
Notice that the overall distribution of the risk filtered returns has shifted slightly upward, resulting in an average monthly return that is 0.56% higher than the unfiltered data. Even though not all negative months were caught, the impact of removing a few was more than enough to significantly improve the result.
Of course, the results above depend entirely on the quality of the Hedgewise risk filter, which was modeled with the benefit of hindsight. Luckily, we now have a few live data points to examine how it has been performing in real portfolios.
The current iteration of the Hedgewise risk filter was rolled out to live client portfolios in August 2016, and there have been two asset classes which have had months identified as 'high risk' since then: bonds and energy. Let's take a look at how the risk filter performed over this time period.
Comparison of 10yr Bond Monthly Returns to Risk Filtered Monthly Returns Since August 2016
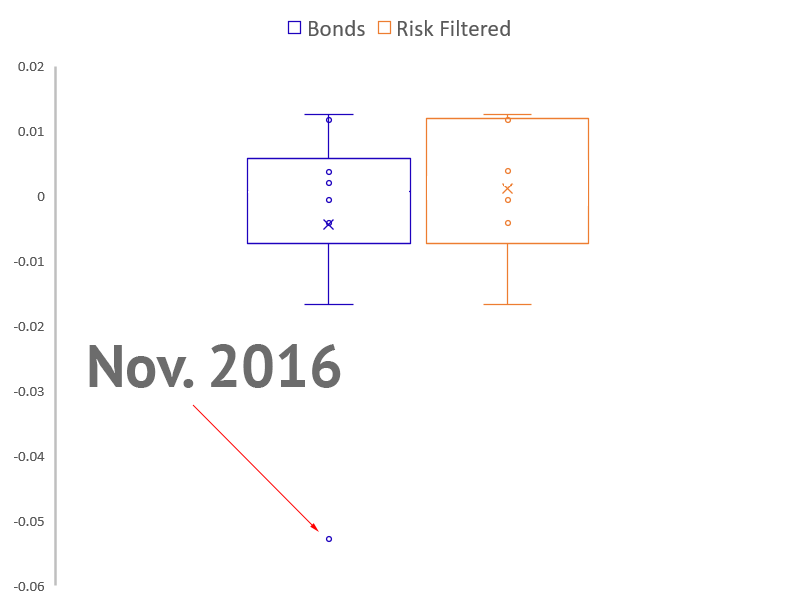
In the bond markets, the average monthly return shifted up by 0.55% using the live risk filter.
Comparison of WTI Oil Monthly Returns to Risk Filtered Monthly Returns Since August 2016
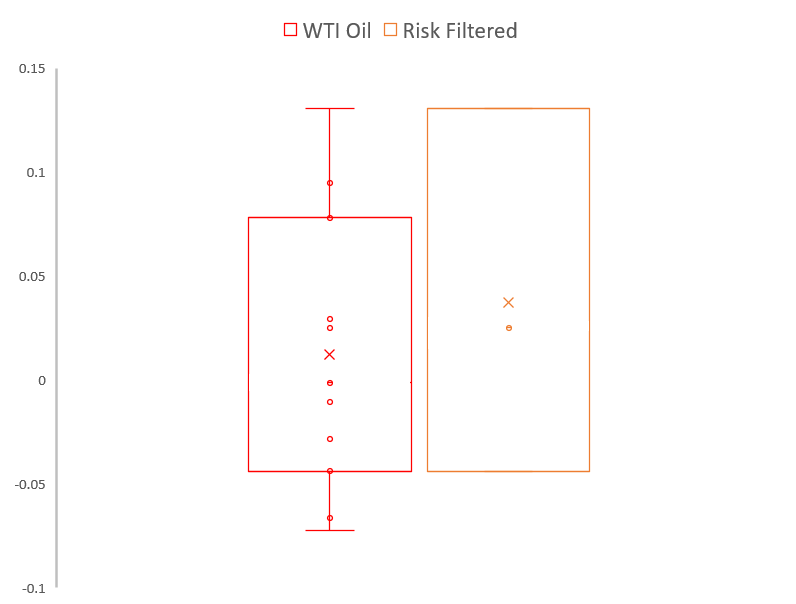
In the energy markets, the average monthly return shifted up by 2.5% using the live risk filter.
These results are incredibly encouraging but consistent with what was expected. To review, we are behaving conservatively in high risk environments even though we will be wrong most of the time. Because of the nature of markets, the few times that we are right will still lead to improved returns in the portfolio.
Creating risk filters for individual asset classes is only one pillar of risk management at Hedgewise, though. You can layer on additional techniques, like hedging, to improve even further.
Theory Three: Commodities as Free Insurance
I've already written a number of previous articles on how hedging works, so I want to focus here specifically on the role of commodities, specifically gold. As you may have noticed earlier, gold has a realized return close to zero, so it makes sense to wonder why it belongs in any portfolio. You may be even more surprised to learn that I usually expect gold to be a drag on the portfolio, but it is still absolutely worth holding.
To understand this, you need to reframe the different functions that an asset can have. The most intuitive function is to drive positive returns, and I discussed how risk premia drive such returns in assets like stocks and bonds in the first section. However, an asset can also serve a role as insurance, and if it does so effectively, it no longer requires any expectation of a return.
Consider a case where you could actually buy insurance on a portfolio invested 100% in equities. You'd expect to pay a premium to an insurer, who would then agree to reimburse you if stocks fell below a certain value. Most of the time, you'd be losing money by having the insurance, but it gives you protection against extreme events.
In theory, gold provides almost exactly the same kind of protection as this hypothetical insurance, but is basically available for free. As a physical metal, gold will generally retain value over time and keep up with inflation, as it is often used as a substitute for currency. This also makes it useful as a safe haven for investors who fear radical events like a run on banks or a government default, since their bank accounts or bond holdings would no longer be secure. As such, gold prices do particularly well in times of runaway inflation or when investors feel very afraid, like during a major global crisis.
Still, gold is not useful in a portfolio if you have to remove something with a higher expected return to make room for it. For example, a portfolio of 100% stocks would have a higher return over time than a portfolio of 85% stocks and 15% gold, since the gold portion would probably yield very little. However, you can transform gold into a form of insurance with no drag on returns if you introduce leverage to the portfolio.
For example, consider a portfolio of just 100% stocks versus a portfolio of 105% stocks and 15% gold. The latter portfolio is leveraged by 20%, meaning you took out a form of loan. This loan will have a small cost, typically near the risk-free rate, but in exchange you now have protection from global crises and runaway inflation. In theory, the cost of adding gold to the portfolio will be less than the amount you gain by leveraging extra exposure in other asset classes.
This theory is easy to test by modeling the exact portfolios mentioned. These numbers use end-of-day index prices, include the cost of leveraged measured as the rate on the 1yr Treasury Bond, and include all dividends and coupons re-invested. Gold first became tradable in 1970.
Comparison of 100% Stocks to 105% Stocks / 15% Gold, 1970 to Current
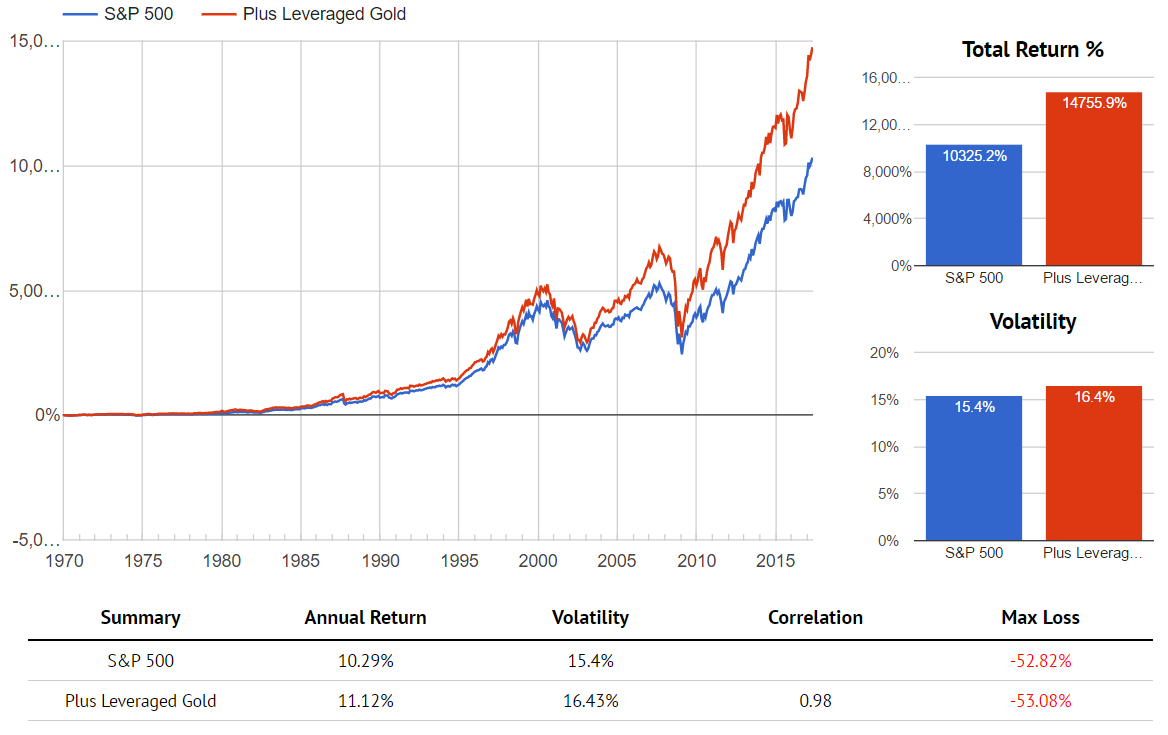
This result is both unsurprising but incredible at once: you increased your annual return by almost 1% with very little increase in risk or maximum losses! Yet this makes perfect sense: you increased your expected return by owning more stocks, but you mitigated the risk of that extra exposure by adding the insurance of gold. Leverage allows you to manipulate the portfolio to effectively gain insurance and boost returns at the same time.
However, just like insurance, gold will rarely have a positive return except in circumstances of elevated fear or inflation. Outside of these events, the expectation is that gold will be flat or negative. This in no way changes the fact that it is having a positive overall effect on your portfolio.
As a result, it is unfair to judge gold on its raw performance over a few months or even a few years. A better way to evaluate it is whether it is properly hedging the kinds of events you expect. While we haven't had any kind of major global crisis or hyperinflation since Hedgewise opened its doors, gold has still demonstrated its safety whenever the possibility has arisen. Here's how gold performed during the three worst months for the S&P 500 since 2015:
| Date | Stocks | Gold |
|---|---|---|
| August 2015 | -8.61% | 4.62% |
| December 2015 | -4.11% | 0.60% |
| January 2016 | -3.47% | 5.02% |
Gold nicely hedged the losses of August 2015 and January 2016, which were driven by worries of systemic economic problems in China. It didn't do much in December 2015, as that pullback was centered around actions at the Fed, but it clearly remains a safe haven whenever a global crisis gets more likely. There was another nice example of this on the day of the Brexit in June 2016, as gold rallied 5% overnight.
While none of these events materialized into an economic downturn, gold provides a persistent hedge that allows us to improve portfolio construction in other ways. When the next downturn finally does arrive, gold will even more dramatically redeem its value.
Wrapping Up: Financial Theory in Practice
The past two years have provided an excellent, real life demonstration of the financial concepts underlying every Hedgewise product. Unlike active managers of the past, Hedgewise rests on a foundation of theory that, if true, can fundamentally improve returns and reduce risk in the same way that simple diversification does. While it is still relatively early days, the evidence so far has been amazingly close to what you'd expect to see, and this has already been driving outperformance for clients.
By understanding and gathering risk premia, Hedgewise products have a basis of positive returns built-in. Then, multiple risk management techniques are layered on top of this to make the portfolio less likely to be impacted by sudden negative shocks. Portfolios gain a kind of 'free insurance' by more effectively managing and hedging high risk environments, and leverage is used to make this possible without weighing down returns.
In the short-term, this can sometimes be confusing to watch. Assets like gold frequently have a negative return, and sometimes there are large losses which cannot be avoided. Risk algorithms are imperfect, and frequently appear to move in or out of an asset at just the wrong time. Yet when you step back and examine the underlying theory, this is all within the range of expectations. Even better, when you look at the evidence available since Hedgewise opened, it's obvious that the net result has been quite positive. I'm very confident that the more time goes on, the clearer the benefits will become.
Disclosure
This information does not constitute investment advice or an offer to invest or to provide management services and is subject to correction, completion and amendment without notice. Hedgewise makes no warranties and is not responsible for your use of this information or for any errors or inaccuracies resulting from your use. Hedgewise may recommend some of the investments mentioned in this article for use in its clients' portfolios. Past performance is no indicator or guarantee of future results. Investing involves risk, including the risk of loss. All performance data shown prior to the inception of each Hedgewise framework (Risk Parity in October 2014, Momentum in November 2016) is based on a hypothetical model and there is no guarantee that such performance could have been achieved in a live portfolio, which would have been affected by material factors including market liquidity, bid-ask spreads, intraday price fluctuations, instrument availability, and interest rates. Model performance data is based on publicly available index or asset price information and all dividend or coupon payments are included and assumed to be reinvested monthly. Hedgewise products have substantially different levels of volatility and exposure to separate risk factors, such as commodity prices and the use of leverage via derivatives, compared to traditional benchmarks like the S&P 500. Any comparisons to benchmarks are provided as a generic baseline for a long-term investment portfolio and do not suggest that Hedgewise products will exhibit similar characteristics. When live client data is shown, it includes all fees, commissions, and other expenses incurred during management. Only performance figures from the earliest live client accounts available or from a composite average of all client accounts are used. Other accounts managed by Hedgewise will have performed slightly differently than the numbers shown for a variety of reasons, though all accounts are managed according to the same underlying strategy model. Hedgewise relies on sophisticated algorithms which present technological risk, including data availability, system uptime and speed, coding errors, and reliance on third party vendors.