


Summary
- Oil looks like a strong long-term play now that it has returned near decade-lows.
- However, funds like USO are a bad bet due to contango in the futures markets.
- We analyze whether gasoline futures are a smarter play using UGA, and present a cost model for monitoring this moving forward.
- Building gasoline futures into your broader oil exposure has been quite effective historically, but only if you understand when and why to use it.
Introduction
After its sharp rally in March, oil prices have fallen all the way back down to $50 per barrel. We continue to be quite bullish on the long-term prospects of the commodity, however, as these prices are extraordinarily cheap from a historical perspective. However, there is no direct way to invest in oil, and it can be quite treacherous to use popular options like the United States Oil Fund (USO), which utilizes oil futures contracts.
For example, since March, the spot price of oil is about breakeven, as it rallied about 20% but then gave it all back. USO, however, is off about 10% in this same timeframe. This is because futures contracts often have a natural underlying cost called "contango", which is when futures prices are more expensive than the spot price of oil today. This creates a constant drag that gets worse over time.
Given this, there are a number of articles suggesting gasoline as a reasonable alternative to get oil exposure. The reasoning makes sense at a high level: gasoline is a derivative of oil, and its futures market is often in backwardation, which is the opposite of contango and theoretically quite appealing.
Unfortunately, historical performance trends suggest that this relationship is not so simple. The United States Gas Fund (UGA), which invests in gasoline futures contracts, has severely underperformed the spot price of oil during some periods while outperforming it over others. Even worse, this divergence has not had any relationship to the gasoline futures curve like you might expect.
The good news is that a deeper understanding of the gasoline market helps to explain much of this variability, and even better, it can be used to evaluate how attractive gasoline futures are at any point in time. We present a model for doing so below, and you can also see what this model says about the current state of the market here.
Unfortunately, our analysis suggests that UGA is not a great oil bet right now, but it has been very useful over certain stretches in the past. In fact, if you overlay it on top of a broader long-term oil strategy since 2009, the impact has been quite dramatic.
Dispelling the Myth: Gasoline Futures Are No Sure Bet
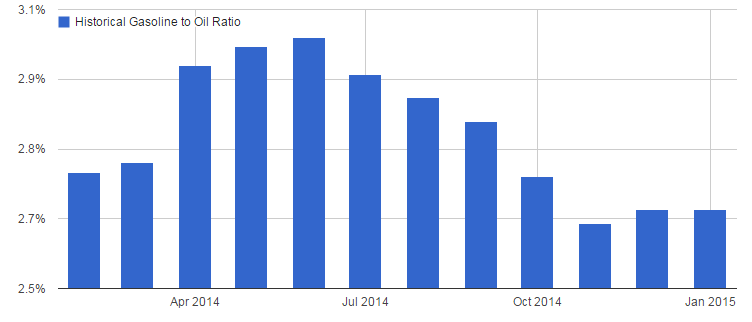
It is very easy to make an argument for gasoline as an effective way to gain oil exposure. Crude oil makes up about 70% of the pump price of regular gasoline. Plus, the gasoline futures market is much less often in contango compared to the oil futures market, which you can see by the historical shape of the gasoline futures curve. Figure 1 illustrates the historical gasoline futures curve and its frequent periods of backwardation.
Figure 1: Historical Gasoline Futures Curve, Monthly, 2005 - 2015
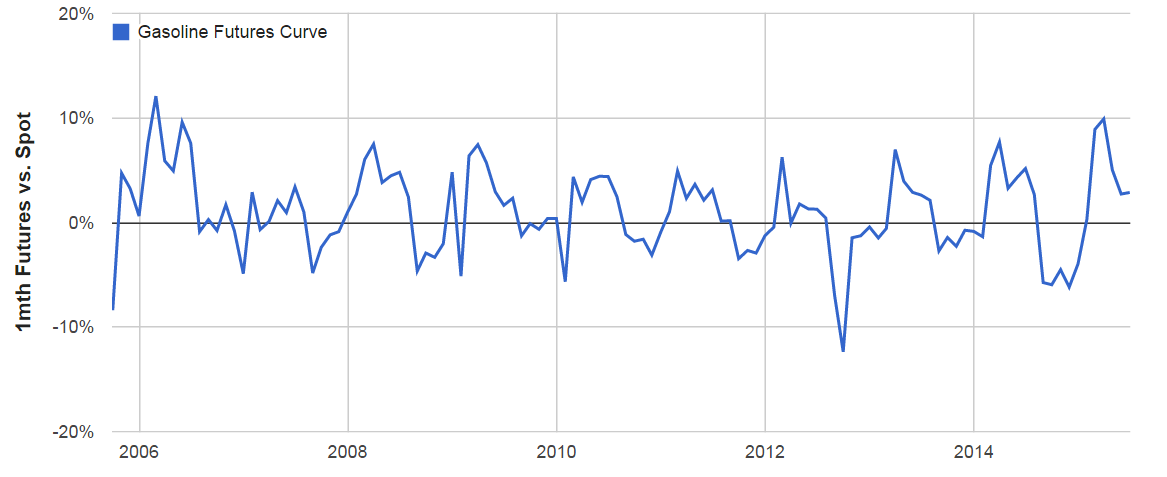
However, a quick look at history suggests this logic often fails. UGA has not kept up with the spot price of oil in a number of cases, including during the recent rally from March to June.
Figure 2: UGA vs. WTI Oil Performance, March - June 2015
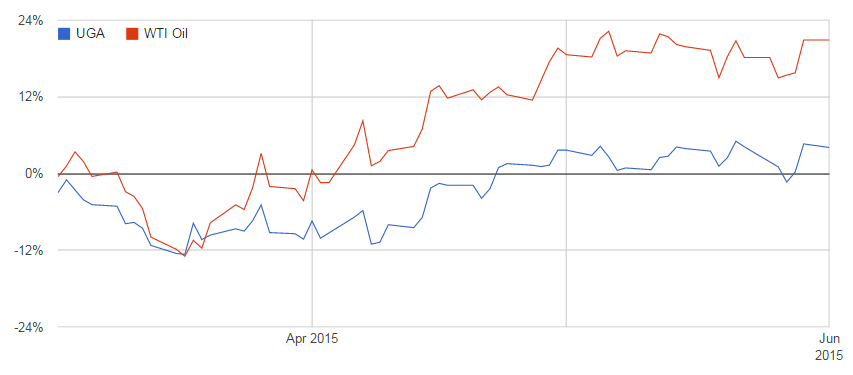
UGA also failed to track oil when the gasoline futures market was in deep backwardation during the fall of 2011, suggesting that the gasoline future curve alone is not a great indicator of relative expected performance.
Figure 3: UGA vs. WTI Oil Performance, October - December 2011
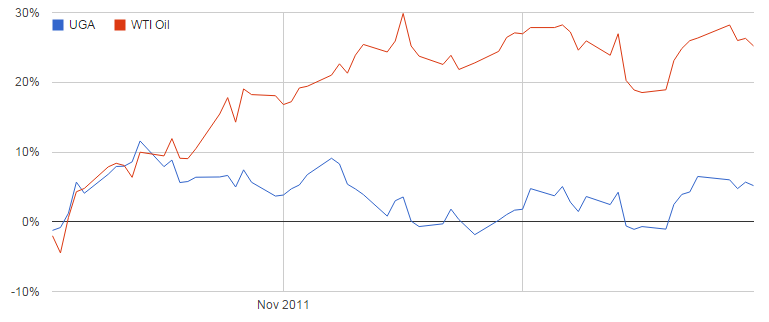
However, there have also been periods when UGA has tracked or even outperformed the spot price of oil, such as from the summer of 2013 through the fall of 2014.
Figure 4: UGA vs. WTI Oil Performance, July 2013 - November 2014
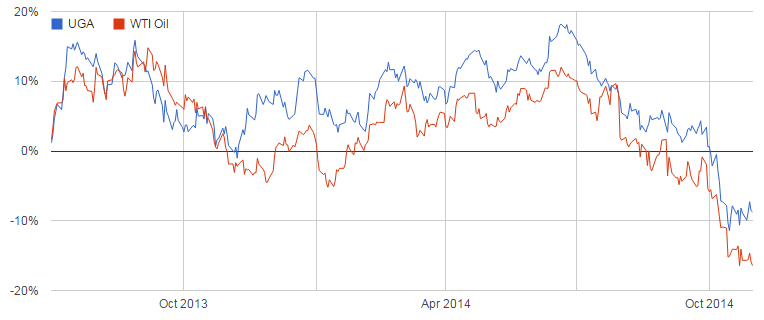
To better identify what is driving these vastly different outcomes, we need to break apart the fundamentals of the relationship between gasoline, gasoline futures, and oil.
Understanding Gasoline and Oil
While the two commodities are obviously related, gasoline prices move independently for a variety of reasons. They have natural seasonality, and tend to be more expensive in summer than winter. They are affected by outside factors like tropical storms, nationwide driving patterns, and seasonal formulation requirements. They also tend to have a slight asymmetric 'lag' to oil prices, in which gasoline prices tend to fall slowly when oil is falling but rise quickly when the reverse occurs.
Together, these independent drivers can cause a significant divergence in price between oil and gasoline. For example, say a tropical storm is about to hit the Gulf Coast, and the price of oil also just fell 10% in the last few days. Gasoline prices will tend to stay quite high due to nervousness about the effect of the impending storm on refineries, and because of the expected lag behind the oil price change. If you bought gasoline right at this point as a way to track oil, you'd probably do quite badly.
However, if you assume that such divergences tend to be temporary, you can actually use this information to your advantage. Since so much of the price of gasoline is driven by oil, this makes natural sense. Price lags will eventually reconcile if the price of oil remains steady for long enough. Storms eventually pass. When normal conditions prevail, you'd expect the historical relationship to remain fairly consistent.
Given that, we simply need an estimate for this relationship so we can evaluate the relative attractiveness of gasoline prices at any point in time.
Modeling the Relationship
The goal of this model is to remain simple and broad-based. We are not trying to identify every factor currently influencing the price of gasoline. Rather, we just want an indicator for whether current gasoline prices are inconsistent with current oil prices.
To capture this, we are using a historical average of the relative price of gasoline futures contracts to the spot price of oil upon expiration. For example, if every June, the gasoline futures contract costs $2/gallon when the price of oil is $50/barrel, we can say that this is the average expectation. If next June, oil is at $50/barrel but gasoline is at $3/gallon, then it would indicate that gasoline prices look expensive.
Figure 5 shows the historical averages and validates that this is appropriately accounting for factors like seasonality.
Figure 5: Average Ratio of the Price of Gasoline to the Price of Crude Oil, Monthly, 2006-2015
Validating the Model
To validate this model, we can apply these estimates to the gasoline futures curve at any point in time and see whether that served as a useful predictor for relative gasoline performance.
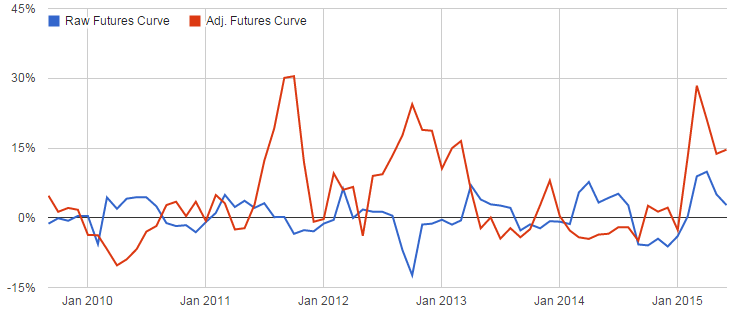
To begin, we can create a "new" gasoline futures curve that accounts for the historical relationship. Figure 6 shows the original shape of the curve as well as the "adjusted" shape given the expected price ratio. This illustrates that what at first appeared to be backwardation may have actually been contango, and vice versa. Note that the data needed to create this model became available in late 2009.
Figure 6: Raw vs. Adjusted Gasoline Futures Curve, 2010 - 2015
Now let's return to our example periods to see whether this new curve was a better indicator of relative gasoline performance. We noted that UGA underperformed the spot price of oil in the Fall of 2011 and during the oil rally which began in March of this year. Figures 7 and 8 show the adjusted futures curve over these timeframes.
Figure 7: Raw vs. Adjusted Gasoline Futures Curve, Fall 2011
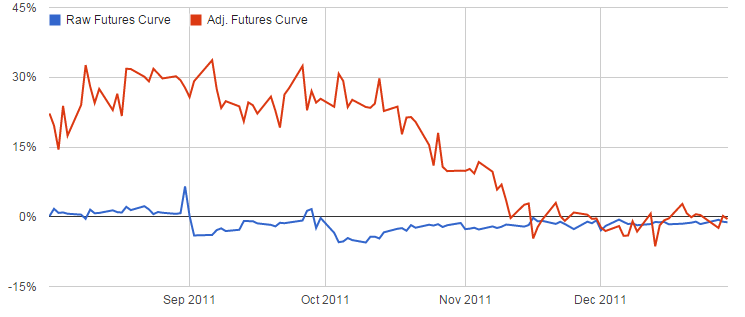
Figure 8: Raw vs. Adjusted Gasoline Futures Curve, 2015
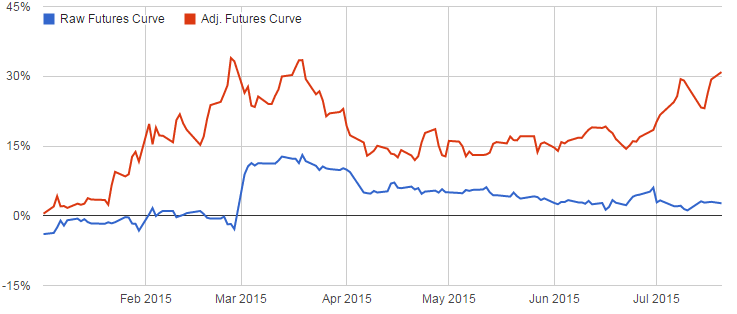
These results affirm what we had expected: gasoline futures prices looked "expensive" over these periods, and our adjusted curve much more accurately reflected this compared to the raw curve.
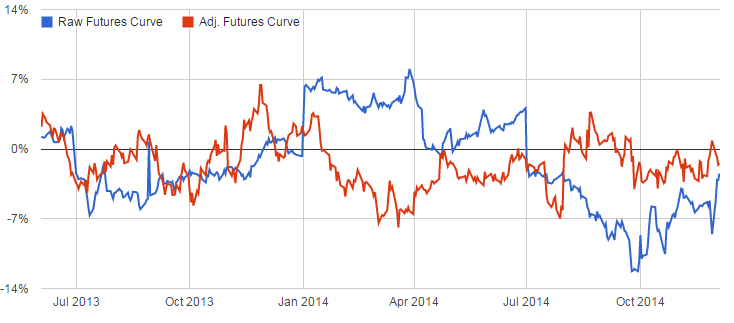
Finally, we can look over one of the periods of gasoline outperformance to see if the reverse was also true. Figure 9 shows how the curve looked from July 2013 through November 2014, when UGA outperformed the spot price of oil. If our logic holds, the red curve should often be in negative territory.
Figure 9: Raw vs. Adjusted Gasoline Futures Curve, July 2013 - November 2014
Warnings and Caveats
While this model does indeed seem to have some predictive power, it is far from a sure thing. The primary issue is that gasoline prices may deviate from oil prices for long periods before returning to their averages, and until they do, performance may suffer. This makes it quite difficult to rely on UGA for only a short-term bet. There is also the possibility that something fundamental about this relationship shifts, and historical averages in the future permanently deviate from those of the past. This would be extremely difficult to predict and would significantly reduce this model's viability.
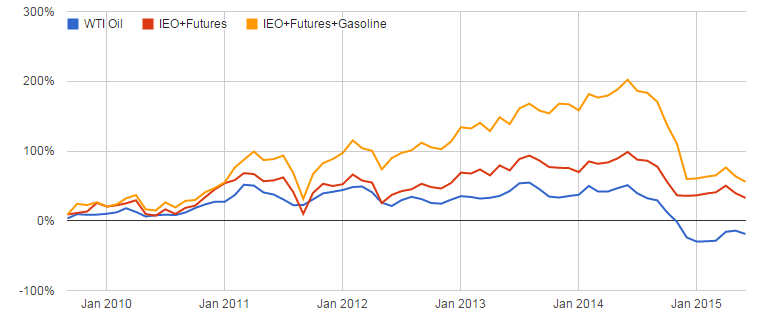
In addition, it is generally quite difficult to try and time short-term market movement, and futures contracts will often be bad investments across the board, as they appear to be right now. This is why we recommend a longer-term approach (linked in the introduction) that intelligently uses futures contracts when they make sense, but switches into broad energy ETFs otherwise. We recommend you refer to our other article for more detail, but Figure 10 shows the model impact of such a long-term, dynamic approach since gasoline data was available. This highlights the difference between a switching strategy that uses only oil futures contracts versus one that uses both oil and gasoline futures contracts. This does not include any estimate of commissions or fees and is a hypothetical simulation only.
Figure 10: Dynamic Oil Investment Model, 2009-2015
Relevance Today
Unfortunately, gasoline futures remain relatively expensive, and UGA is unlikely to outperform USO. Both will probably fail to keep up with an immediate oil rally, probably because all markets are pricing in a higher oil price than we have today.
However, if you have conviction in oil over the long-run, both oil and gasoline futures contracts remain appealing options in combination with a broader strategy. By keeping track of the different markets and intelligently switching when it makes sense, you may be able to keep up with or even outperform the price of oil over time. This approach will often fail to catch short-term rallies, but avoids the significant drag of relying solely on futures. Given there is no perfect option, this may be your best bet - and with oil near historic lows, that bet is looking pretty strong.
Disclosure
This information does not constitute investment advice or an offer to invest or to provide management services and is subject to correction, completion and amendment without notice. Hedgewise makes no warranties and is not responsible for your use of this information or for any errors or inaccuracies resulting from your use. Hedgewise may recommend some of the investments mentioned in this article for use in its clients' portfolios. Past performance is no indicator or guarantee of future results. Investing involves risk, including the risk of loss. All performance data shown prior to the inception of each Hedgewise framework (Risk Parity in October 2014, Momentum in November 2016) is based on a hypothetical model and there is no guarantee that such performance could have been achieved in a live portfolio, which would have been affected by material factors including market liquidity, bid-ask spreads, intraday price fluctuations, instrument availability, and interest rates. Model performance data is based on publicly available index or asset price information and all dividend or coupon payments are included and assumed to be reinvested monthly. Hedgewise products have substantially different levels of volatility and exposure to separate risk factors, such as commodity prices and the use of leverage via derivatives, compared to traditional benchmarks like the S&P 500. Any comparisons to benchmarks are provided as a generic baseline for a long-term investment portfolio and do not suggest that Hedgewise products will exhibit similar characteristics. When live client data is shown, it includes all fees, commissions, and other expenses incurred during management. Only performance figures from the earliest live client accounts available or from a composite average of all client accounts are used. Other accounts managed by Hedgewise will have performed slightly differently than the numbers shown for a variety of reasons, though all accounts are managed according to the same underlying strategy model. Hedgewise relies on sophisticated algorithms which present technological risk, including data availability, system uptime and speed, coding errors, and reliance on third party vendors.