


Summary
- Since the market bottom this spring, Hedgewise Risk Parity has gained 8% and Momentum has gained 10%, demonstrating the resilience of both frameworks and the power of remaining patient regardless of market conditions.
- Generally, most quantitative and traditional frameworks have underperformed Hedgewise over this period, which can be traced to core theoretical principles that give Hedgewise a persistent edge.
- While US equities have been the best performing asset class this year, substantial risks such as the trade war and rising interest rates remain. Protecting against these downside risks has resulted in a slight lag compared to the S&P 500, but that is entirely by design.
Few Winners in 2018 Amidst Market Chaos
If you look anywhere outside of US stocks, 2018 has been a pretty terrible year for investors. Both emerging markets and many commodities have entered a full-fledged bear market, and the general environment of heightened volatility led to many funds taking money off the table and missing the ensuing recovery. Bonds failed to hedge the market pullbacks in February and March given fears of runaway inflation, and other typical safeguards like gold were beaten down by a strong US dollar.
Performance by Asset Class, YTD
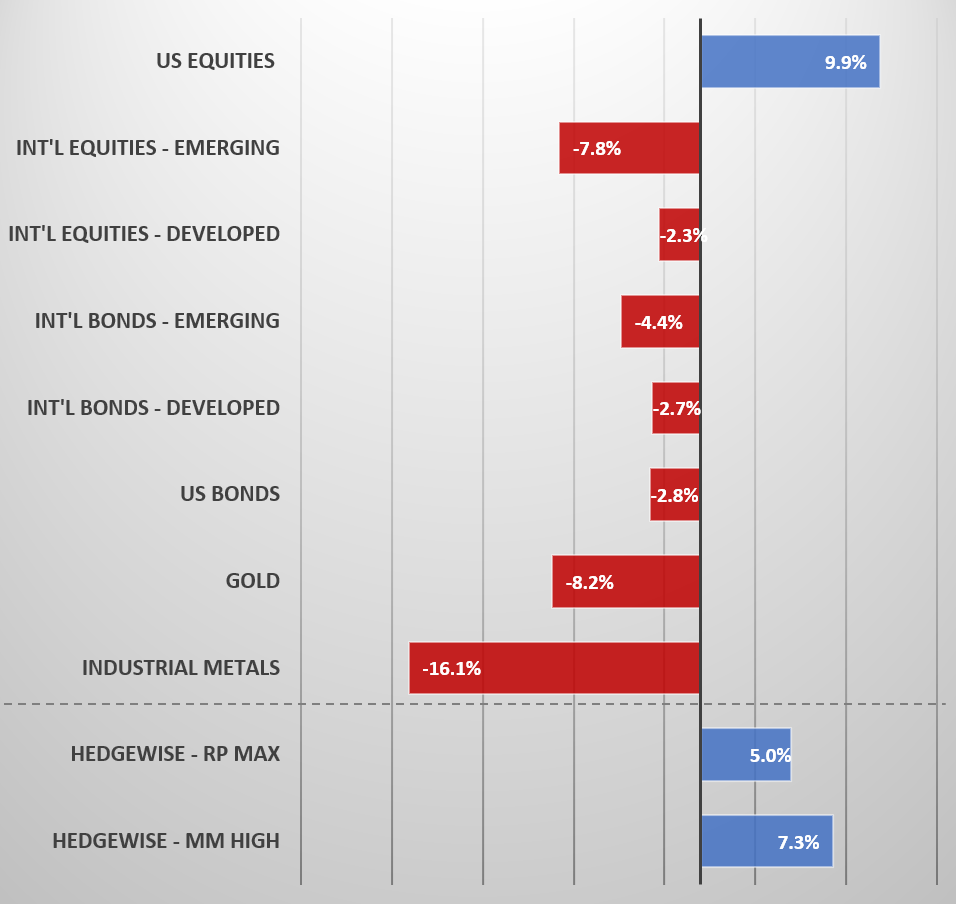
Despite this difficult environment, both Hedgewise strategies have performed quite well, with Risk Parity up 5% (at the Max risk level) and Momentum up 7.3%. Given that both frameworks are frequently exposed to bonds and commodities, these results are quite powerful and add significant weight to the narrative that Hedgewise clients have no need to time the markets.
The challenges of navigating this kind of environment can be seen in the poor year-to-date performance across the majority of quantitative funds and even in traditional diversified portfolios:
Competitive Risk Parity Funds YTD Performance
| Mutual Fund | YTD |
|---|---|
| AQR | -2.9% |
| Invesco | -1.1% |
| Wealthfront | -6.8% |
Traditional Diversified Mix YTD Performance
| Type (Ticker) | YTD |
|---|---|
| Conservative (AOK) | -0.9% |
| Moderate (AOM) | -0.2% |
| Aggressive (AOA) | 1.4% |
The outperformance of Hedgewise products can be traced directly to its hyper-focus on avoiding what is known as "asymmetric risk". Simply, this is when there's a chance that some part of your portfolio will perform badly in isolation, and nothing else in your portfolio offsets it. For example, normally a commodity crash would be accompanied by a rally in bonds, since it would suggest lower overall inflation. But this year, commodities have crashed while bonds have lost money as well. Similarly, international bonds would usually rally when international equities crash, but both are negative year-to-date.
The reason for both trends is that the US dollar has had an incredible rally this year, which lowers the value of international stocks and bonds as well as dollar-priced commodities. This is a classic asymmetric kind of risk, and it is exactly why Hedgewise avoids international exposure and has a measure for asymmetric risk built into every asset class.
However, Hedgewise clients are often less interested in comparisons to competitive funds and more interested in performance versus the S&P 500 itself. After all, the goal is to achieve equity-like returns (at the High and Max risk levels) with substantially less risk. Given that, I want to focus the rest of this analysis on how years like this current one fit into the bigger strategic picture, and why underperformance compared to equities is often exactly what you'd expect.
Risk Parity: Stability Above All
Risk Parity is all about balance; it accounts for every possible economic scenario, and constantly builds in a hedge for each. As a result, it will always be holding a mix of bonds, commodities, and equities. Thus, it is somewhat intuitive to achieve a return lower than equities when bonds and commodities are underperforming. But as soon as you hit one period of recession (when bonds usually rally) or high inflation (when commodities usually rally), you easily make up the difference.
The key is that you are constantly trading near-term upside for long-term stability; you'd rather have a boring, steady 8% return every year regardless of what equities are doing. The rub is that you'll probably underperform equities about 50% of the time! You can also run into lots of bull markets where you'll lag the net performance of the S&P 500 for many years. In exchange, you can worry much less about whether next year is going to be a repeat of 2008. Historically speaking, so long as you've waited at least 10 years, you've outperformed the S&P about 85% of the time at the High risk level and 99% of the time at Max.
Still, it is difficult to gauge the strategy's success in years like this one, as you wonder whether a simple stock portfolio might make sense. Fortunately, there is a way to directly measure the 'stability' effect even over shorter timeframes to gauge how well the theory is working.
The following chart shows the distribution of all daily returns of the S&P 500 thus far in 2018. Notice the long 'left-tail' of negative returns; you had to deal with a couple of single days with losses as high as 4%!
S&P 500 Daily Return Distribution, YTD
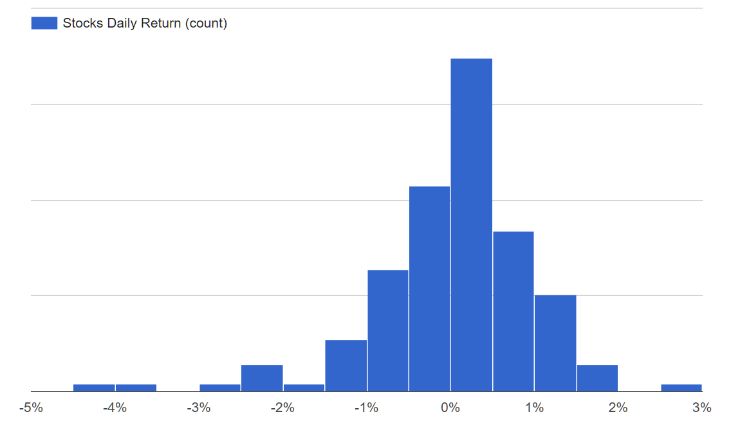
Now let's look at the same distribution for the Risk Parity High strategy. If it is working as it should, the distribution should be much tighter, and have a shorter left-tail.
RP High Daily Return Distribution, YTD
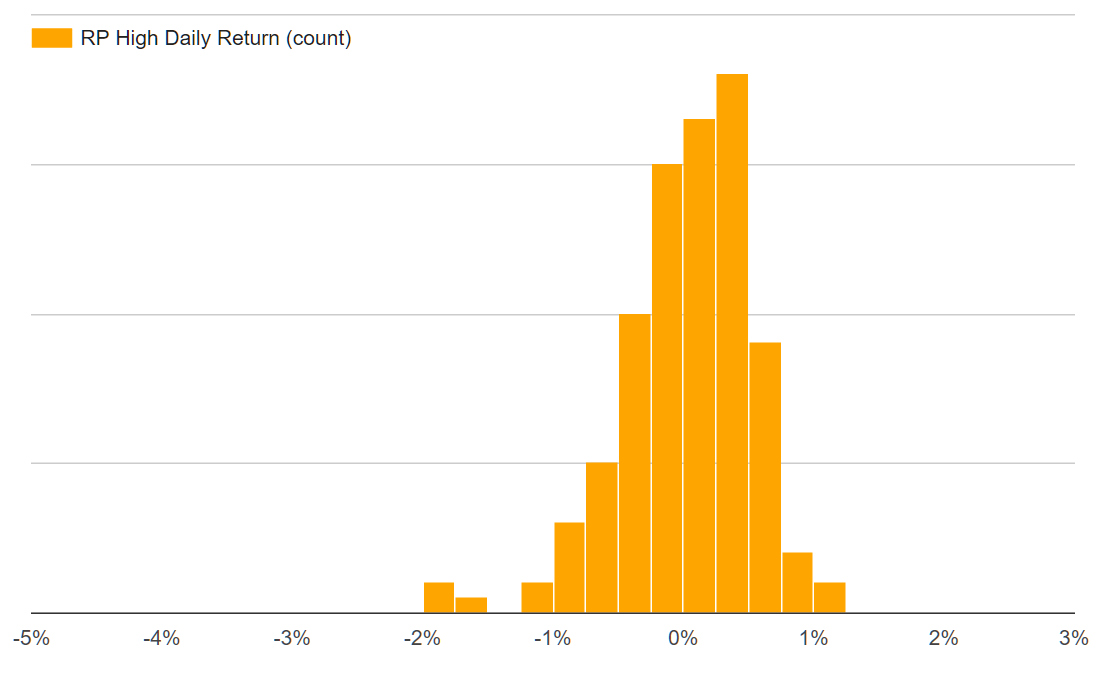
Exactly as the theory predicts, the Risk Parity portfolio achieved a far higher level of stability compared to equities. The portfolio had more positive daily returns, and fewer negative ones; it also protected clients from the worst of the equity volatility. These attributes are what will continue to drive the portfolio's resilience over the long-run, though equity underperformance will very frequently be part of the story.
Momentum: Lean Into Safety, Away From Risk
Unlike Risk Parity, the Momentum framework does not rely on underlying balance. While it can hold various asset classes, it is usually dominated by equities, as its goal is to outperform the S&P 500 at a similar level of risk. To achieve this, it is constantly evaluating the current environment for stocks. When it is deemed relatively 'safe', the portfolio will overweight equities, and vice versa.
Importantly, this means that it will often be underweight stocks in risky environments, since this is what helps protect the portfolio from downside. Given the events of this year, perhaps it is little surprise that equity exposure has generally been lighter than it was in 2017.
The theory behind this is that stocks generally yield a positive return in 'normal' environments, since any reasonable investor demands that. However, once in a while, asymmetric risks appear to the downside (e.g. real estate bubble, dot-com crash, junk bond crisis, etc.). Hedgewise simply behaves more and more conservatively as the risk builds. Roughly speaking, Hedgewise trims exposure as the risk of a systemic event reaches between 20-30%; in other words, Hedgewise expects to be wrong about a crash occurring about 70-80% of the time.
To visualize the impact of this, the following chart isolates every year of gains in the S&P 500, and compares the returns of the Momentum "High" strategy over the same period. The dots under the red line mean the Momentum strategy did worse than equities, and vice versa.
S&P 500 Performance vs. MM High Performance, 1972 to Present (Only Stock Gains)
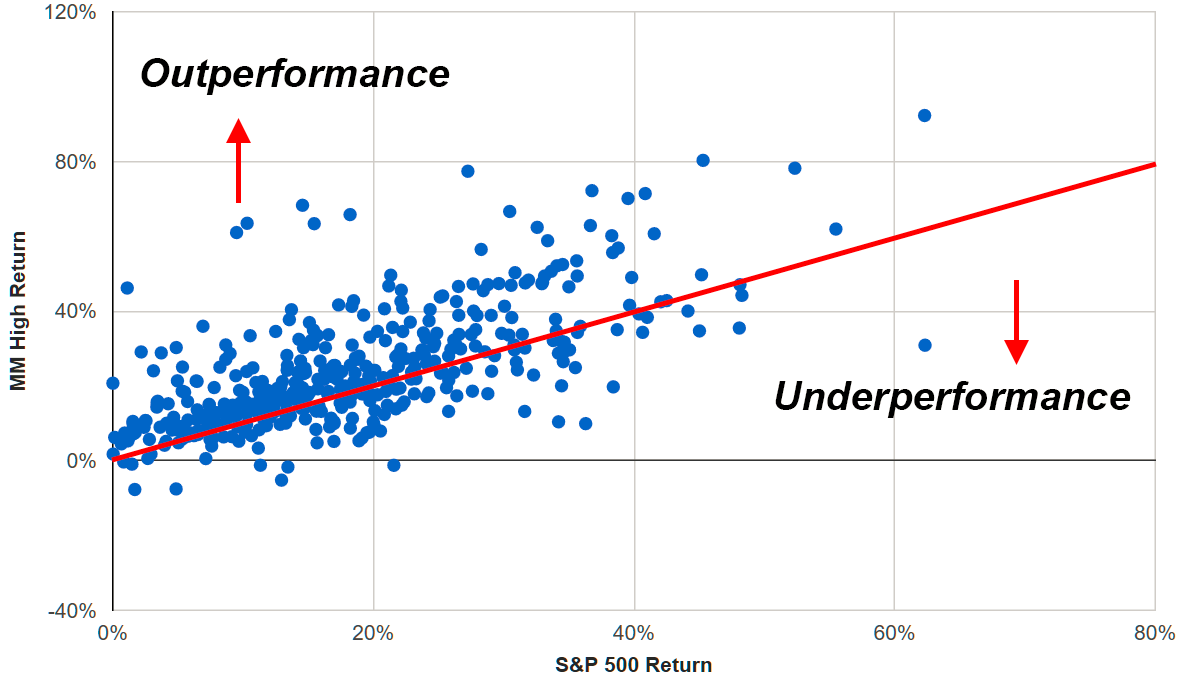
It may initially be surprising to see so many years of underperformance! However, there are very compelling reasons to give up these gains. Notice that you tend to make much more in the good years than you lose in the bad ones, and there are also about 2x as many dots above the red line as below. Even more importantly, playing it safe allows you to avoid the occasional catastrophe, as you can see in a similar chart that isolates all of the years of S&P 500 losses:
S&P 500 Performance vs. MM High Performance, 1972 to Present (Only Stock Losses)
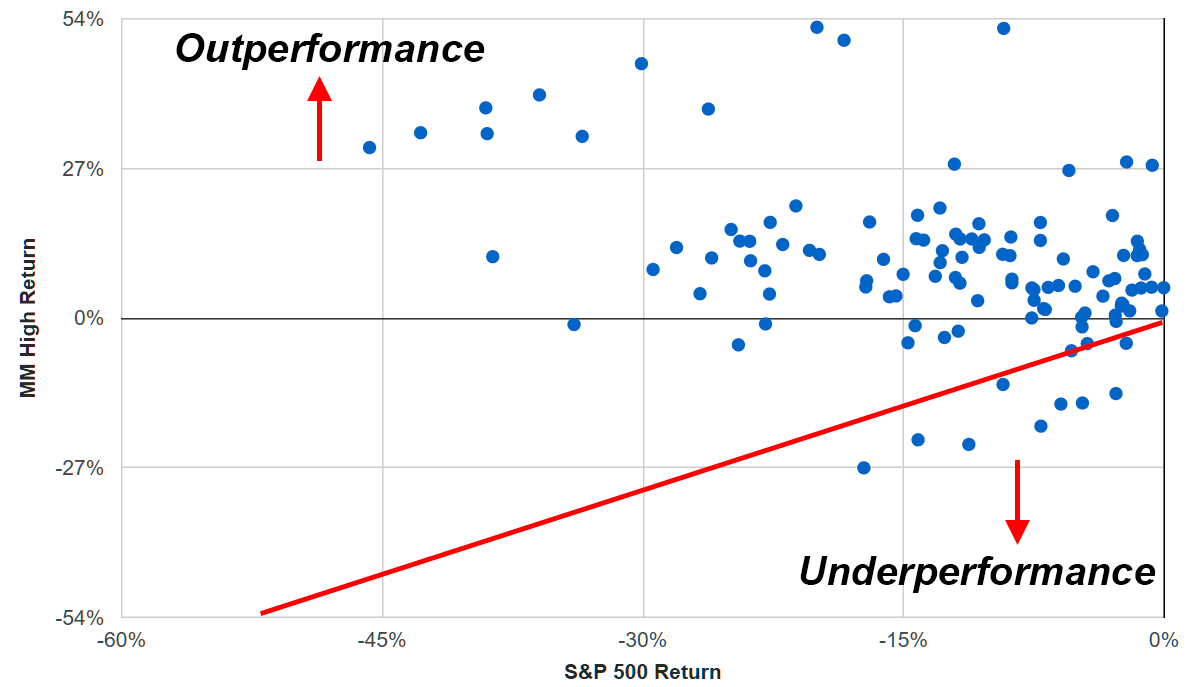
Because the strategy behaves so conservatively in risky environments, it has historically avoided about 90% of stock crashes. Essentially, this boils down to a philosophy of being aggressive in good times but cautious in dangerous ones; you lean into safety, but away from risk.
As a result, you'll frequently underperform the S&P 500 in volatile years like 2018, but the amount you give up will be relatively small compared to your outperformance in better years and your ability to avoid significant crashes.
Comparing this to the available live client performance, the Momentum "Max" product had a return of 31% in 2017 compared to 22% in the S&P 500, or a difference of +9%. Year-to-date, it has a return of 7.3% compared to 9.9% in the S&P 500, or a difference of -2.6%. This is exactly consistent with expectations! Last year's outperformance more than outweighs the lag of this year, and while a more significant crash didn't wind up occurring, the risks were high enough to demand caution.
Looking Forward: Not Chasing the Peak
Perhaps the most consistent theme of 2018 is that the world feels much less steady than it did last year. The Fed is threading a nearly impossible needle of controlling inflation without impeding growth, and no one quite knows what to make of the ongoing trade wars. Various emerging markets are on the brink of crisis, and the Chinese economy suddenly appears quite vulnerable.
None of these risks have weighed much on the US economy so far, and it's entirely possible that they never will. But it feels increasingly likely that we are near a peak, and dangerous to try and predict its top. Luckily, there's no need to do so with either of the Hedgewise frameworks. Clients have continued to accrue gains regardless of external market conditions and have vastly outperformed most competitive funds. While there has been slight underperformance compared to the S&P 500, this is quite consistent with theoretical expectations. So long as you stay the course, the odds remain heavily tilted in your favor.
Disclosure
This information does not constitute investment advice or an offer to invest or to provide management services and is subject to correction, completion and amendment without notice. Hedgewise makes no warranties and is not responsible for your use of this information or for any errors or inaccuracies resulting from your use. Hedgewise may recommend some of the investments mentioned in this article for use in its clients' portfolios. Past performance is no indicator or guarantee of future results. Investing involves risk, including the risk of loss. All performance data shown prior to the inception of each Hedgewise framework (Risk Parity in October 2014, Momentum in November 2016) is based on a hypothetical model and there is no guarantee that such performance could have been achieved in a live portfolio, which would have been affected by material factors including market liquidity, bid-ask spreads, intraday price fluctuations, instrument availability, and interest rates. Model performance data is based on publicly available index or asset price information and all dividend or coupon payments are included and assumed to be reinvested monthly. Hedgewise products have substantially different levels of volatility and exposure to separate risk factors, such as commodity prices and the use of leverage via derivatives, compared to traditional benchmarks like the S&P 500. Any comparisons to benchmarks are provided as a generic baseline for a long-term investment portfolio and do not suggest that Hedgewise products will exhibit similar characteristics. When live client data is shown, it includes all fees, commissions, and other expenses incurred during management. Only performance figures from the earliest live client accounts available or from a composite average of all client accounts are used. Other accounts managed by Hedgewise will have performed slightly differently than the numbers shown for a variety of reasons, though all accounts are managed according to the same underlying strategy model. Hedgewise relies on sophisticated algorithms which present technological risk, including data availability, system uptime and speed, coding errors, and reliance on third party vendors.