


Summary
- Commodities have been hit with a rare 'perfect storm' of economic factors over the past 15 months.
- Weak global demand combined with one of the strongest dollar rallies in the past 30 years has brought prices to recession-level lows.
- There are many reasons to believe this cannot persist, making commodities a great play looking ahead to 2016.
- We break down the underlying economic story, its place in history, and how to play this situation in your own portfolio.
Introduction: The Perfect Storm
Since last July, here is a look at the relative performance of the three major US asset classes (stocks, bonds, and commodities):
Performance of Major US Asset Classes, July 2014 - December 2015
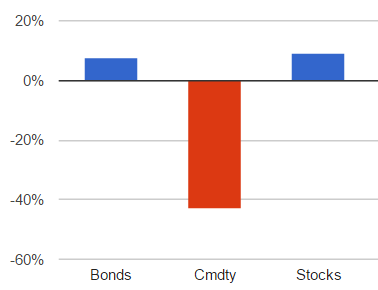
We've had a combination of a relatively strong economy, low inflation, and plummeting global prices for raw materials. Put simply, this situation is not particularly normal. In fact, it has only occurred a handful of times over the past 30 years, almost all of which involved a major geopolitical event, such as the beginning and subsequent end of an oil embargo. Today, we are witnessing a similar economic situation despite the absence of any such event, and there are many reasons to believe it cannot last.
Most importantly, the US dollar has been surging in an unsustainable fashion, taking the price of all commodities down with it. This has been tied very closely to expectations of the Fed rising interest rates while the rest of the world continues monetary stimulus. However, since a stronger dollar has a negative effect on the rest of the economy, you quickly run into a catch-22.
The Fed can only raise rates if our economy remains strong, yet the economy will struggle to remain strong with the US dollar at current levels. This basically creates a cap for how much stronger the dollar can get before the economy shows cracks or the Fed backs off. In both cases, the dollar will be forced to reverse its course - buoying commodities along the way.
Perspective on the Current Environment
While most of the headlines have been dominated by the plunge in the price of oil, recent trends are not limited to the energy market.
Performance of Various Commodities, July 2014 - December 2015
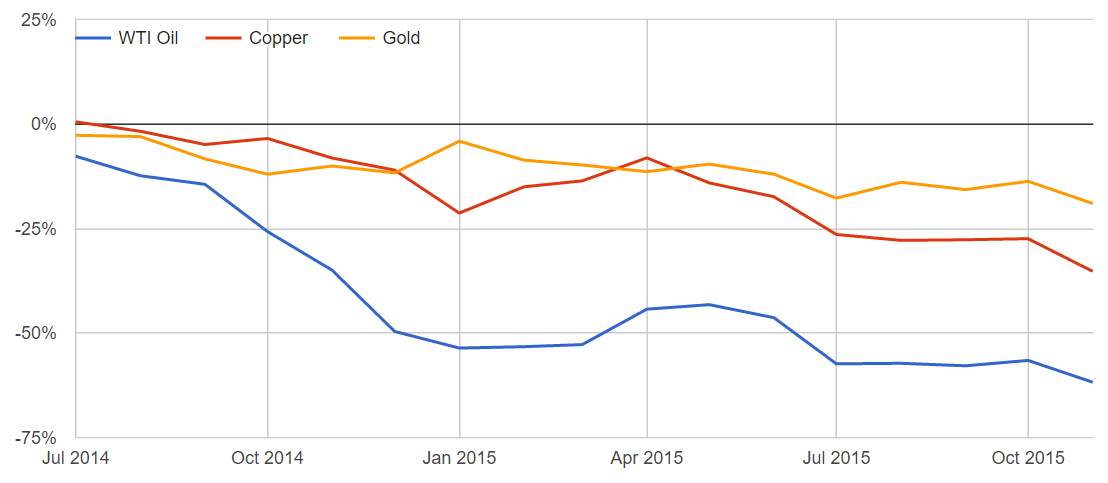
These trends can be more easily understood by examining the relative price of the US Dollar over this same timeframe. Keep in mind that since commodities are dollar-based, a stronger dollar will result in cheaper commodity prices.
Trade Weighted US Dollar Index, December 2005 - December 2015 (Emphasis placed since July 2014)
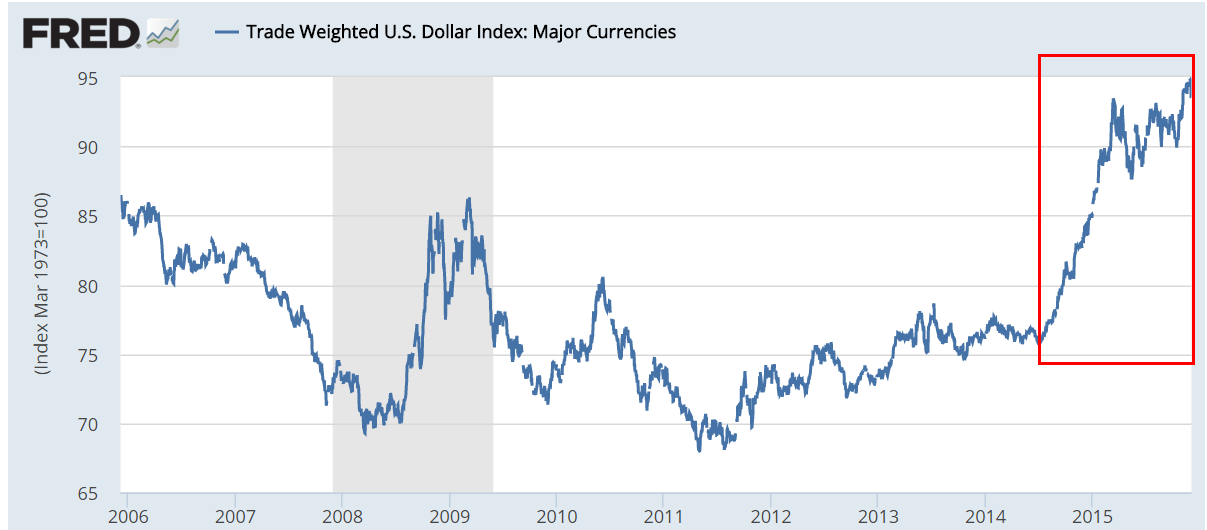
The US Dollar Index has increased from 76 to 95 since July 2014, or a whopping 28% rise. This factor alone explains almost half of the movement of the energy market (which is down 60% total), and basically all of it in the other major commodity markets (which are down between 15% and 30%). While supply and demand and global economic weakness have certainly played some role here, the movement of the dollar has been at least equally important.
Also note that the dollar is now far stronger than it was even in the depths of the 2009 recession, when the world was flocking into US Treasuries for safety. Even stranger is the lack of any recent major geopolitical event, which has historically been an absolute requirement for this kind of dramatic currency movement.
In fact, if we look at commodity prices since 1980, there have only been three other periods that witnessed a simultaneous decline in the price of oil, gold, and copper on the heels of a massive dollar rally.
The first was in the early 1980s, when the Fed just defeated the hyperinflationary pressures in the US caused in part by the "oil shocks" of 1973 and 1979.
The second was in 1991, after the oil price spike that occurred in response to the start of the Gulf War.
The last was after the 1997 Asian financial crisis.
In this case, there has been no oil shock, and inflation certainly hasn't been a problem. The aftermath of the Asian financial crisis probably provides the closest proxy for today - and examining it more closely reveals why our current situation is vastly different.
Relating the Dollar Strength of the Late 1990s to Today
In brief, the Asian financial crisis was the result of a 'bubble' popping in Southeast Asia, leading to the devaluation of many of those countries' currencies and resulting in significant economic repercussions around the world. This global economic weakness deeply impacted the price of raw materials like oil and copper, while raising the value of more stable, developed currencies like the dollar.
Despite the global crisis, the US escaped relatively unscathed. While there was a 'mini-crash' in the stock market in October 1997, markets wound up positive for the year. In short, the US was independently strong enough and isolated enough to weather the storm.
Today, there are a few similarities in that commodity prices are crashing due to weakness in the global economy, and that thus far, the US seems to be relatively unaffected by the struggles in the EU and Asia. Yet far more differences abound.
First, the Asian economies impacted in the 1997 crisis were not even remotely close to representing a large part of the global economy. For example, Thailand's GDP was not even ranked in the top 100 at the time. Let's compare this to GDP size in countries experiencing economic weakness today.
World's Largest Economies, 2014
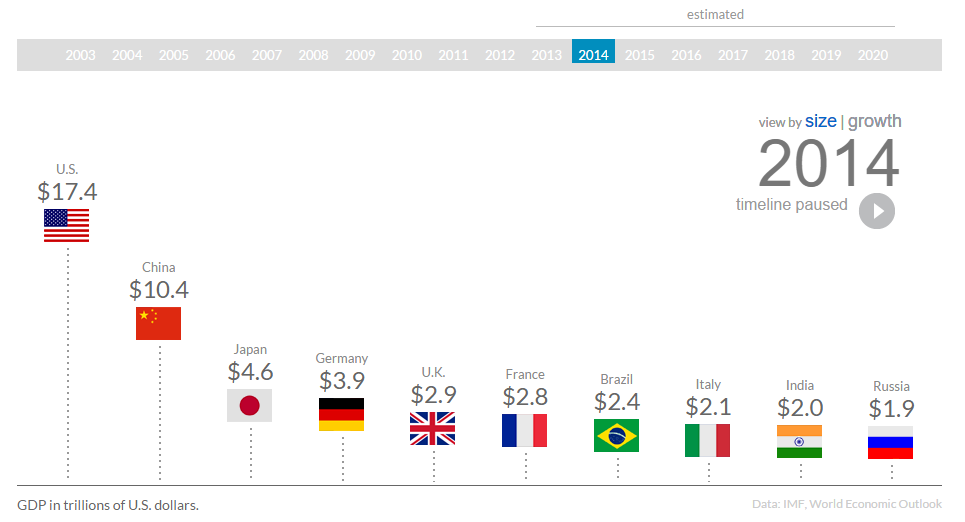
Which of these countries is currently contributing to global weakness? China? Check. Japan? Check. Germany? Check. The list goes on.
Second, the US was in a period of robust growth driven by the beginning of the dot-com revolution at the time. For the year ending 1997, US GDP growth was over 6%. As of last quarter, US GDP growth is currently around 3%.
If the rest of the developed world is in trouble in our fully globalized and still fragile economy, you can bet the US is going to be in trouble, too. It just isn't realistic to expect that the US can again be an independent and unaffected engine of growth.
Looking Forward, All Signs Point to a Weaker Dollar
With these facts in mind, there's really only two realistic scenarios. Either the signs of global weakness that have been driving up the dollar are overblown, or the US is going to struggle to remain strong. Both cases lead to a weaker dollar.
In the first scenario, the current stimulus efforts across the EU and Asia prove effective in keeping the global economy on a reasonable path. As those economies strengthen, so too will their currencies. The Fed will be relatively justified in its current path of raising interest rates, but it won't be as if the US is the only country on the planet in good shape.
In the second scenario, continued global weakness will inevitably take its toll on US GDP. With the strong dollar already hurting our growth prospects, the Fed will be hard pressed to take anything but a dovish stance. With the strength of our economy in greater doubt, and interest rate expectations held further in check, the dollar will cool off as well.
So far as commodities are related, you could see a rally in either scenario simply as a function of the US dollar. If the global economy appears on a better path, then that will even further push up prices as higher demand expectations return. If not, any additional weakness in demand will likely be offset by changes in the dollar, creating a situation with little further downside.
Wait, But What If the Dollar Rally Continues?
A continued dollar rally would be contingent upon further weakness in other global economies while US GDP strengthens and interest rates rise. Absent some major shift in consumer spending or a new US-led technological revolution, it is extremely difficult to envision this reality. Our economy would have to endure higher interest rates, a strong dollar, and weaker global demand all at once.
It is more likely that investors have piled into US assets with the Fed guiding upward after so many years, but the combination of a stronger dollar and global weakness should quickly ease aggressive expectations for US growth and higher interest rates.
Okay, So What's the Play in My Portfolio?
Commodities as an asset class look like a great bet for 2016, especially with so many dangers lurking in both the stock and bond markets, and an allocation of 20-35% as part of a broader portfolio may be sensible. Stay diversified in order to avoid issues with individual supply and demand curves, but avoid generic ETFs like the PowerShares DB Commodity Tracking ETF (DBC), which suffers badly from problems like contango. Instead, consider building your own basket of the major tradable commodities, such as gold (iShares Gold Trust: IAU), oil (Energy Select SPDR ETF: XLE or United States Oil Fund: USO), and copper (iPath Bloomberg Copper ETN: JJC), and split your exposure evenly across each. This way you can keep an eye on the individual underlying costs and adjust accordingly depending on market conditions.
If this seems too complex, a simple passive basket that avoids the complexities of the futures market might look like 50% in gold (IAU) and 50% in a diversified oil ETF (XLE). Alternatively, strategies like risk parity intelligently build in commodity exposure for you.
It's rare to come across a year of 40% losses in any major asset class. With the US dollar likely at or near its peak, there's even further reason to view commodities as a great bargain and a key piece of any savvy investor's portfolio in 2016.
Disclosure
This information does not constitute investment advice or an offer to invest or to provide management services and is subject to correction, completion and amendment without notice. Hedgewise makes no warranties and is not responsible for your use of this information or for any errors or inaccuracies resulting from your use. Hedgewise may recommend some of the investments mentioned in this article for use in its clients' portfolios. Past performance is no indicator or guarantee of future results. Investing involves risk, including the risk of loss. All performance data shown prior to the inception of each Hedgewise framework (Risk Parity in October 2014, Momentum in November 2016) is based on a hypothetical model and there is no guarantee that such performance could have been achieved in a live portfolio, which would have been affected by material factors including market liquidity, bid-ask spreads, intraday price fluctuations, instrument availability, and interest rates. Model performance data is based on publicly available index or asset price information and all dividend or coupon payments are included and assumed to be reinvested monthly. Hedgewise products have substantially different levels of volatility and exposure to separate risk factors, such as commodity prices and the use of leverage via derivatives, compared to traditional benchmarks like the S&P 500. Any comparisons to benchmarks are provided as a generic baseline for a long-term investment portfolio and do not suggest that Hedgewise products will exhibit similar characteristics. When live client data is shown, it includes all fees, commissions, and other expenses incurred during management. Only performance figures from the earliest live client accounts available or from a composite average of all client accounts are used. Other accounts managed by Hedgewise will have performed slightly differently than the numbers shown for a variety of reasons, though all accounts are managed according to the same underlying strategy model. Hedgewise relies on sophisticated algorithms which present technological risk, including data availability, system uptime and speed, coding errors, and reliance on third party vendors.