


Summary
- Since January 2023, the Risk Parity Max strategy has gained almost 10% despite a persistent drawdown in fixed income and heightened market volatility. It has also outperformed its benchmarks by over 6%.
- Equities, gold, energy, and copper have all contributed to net gains in the portfolio since the peak in January 2022. Bonds have also contributed gains since October 2022 despite rising yields, which highlights the resilience of fixed income once rates have become restrictive.
- Bonds are expected to gain at least 25% once rates fall back to 3.5% or below. However, there is no rush for this to happen, as they should yield 5-6% annually through a combination of higher coupons and volatility management.
- Overall, the recovery has gone very well and in line with expectations. Unfortunately, short-term volatility in the bond market can distract from this bigger picture despite it posing little threat to long-run returns.
Introduction: The Big Picture Recovery Looks Excellent
A remarkable feature of the post-pandemic investing landscape has been its short-termism. Between the retail crowd, the dominance of options contracts, and the hyper-short news cycle, there is now much greater interest in what might happen over the next few days rather than the next few years. This has resulted in many bizarre market outcomes, most easily viewed through the lens of “meme stocks”, but also applicable to entire asset classes like Treasury bonds.
For example, last fall, we saw yields on the 30yr bond jump from 4% to 5% almost overnight, only to fall back below 4% a few months later. As discussed in prior newsletters, this had little to do with any fundamental shift to the economy; the best explanation is that a notable hedge fund manager tweeted that he thought yields were too low and set off a panic chain-reaction. Once this subsided, yields quickly reversed.
12 Month Trailing 30yr Treasury Bond Yield
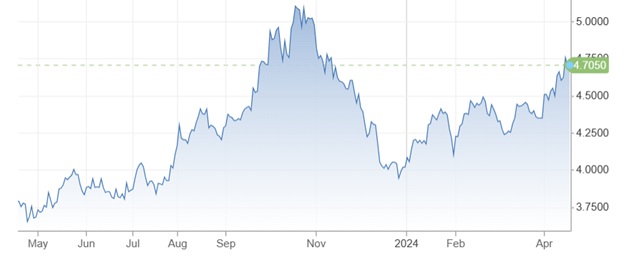
While rates have surged yet again this year, the story rhymes. The dominant explanation this time is that the Fed is going to leave rates higher for longer, but more restrictive short-term rates are designed to slow future growth and inflation. The more time that the Fed leaves rates at 5.5%, the more likely that 30yr rates eventually fall.
Debate will go on about why the market appears frequently hijacked by fast money and irrational prices, but it does not matter from a Hedgewise perspective. This is true across all asset classes, but especially so for Treasury bonds given their formulaic nature. Unfortunately, this meaningless yield rollercoaster can make it much harder to recognize how well the Hedgewise strategy has been performing.
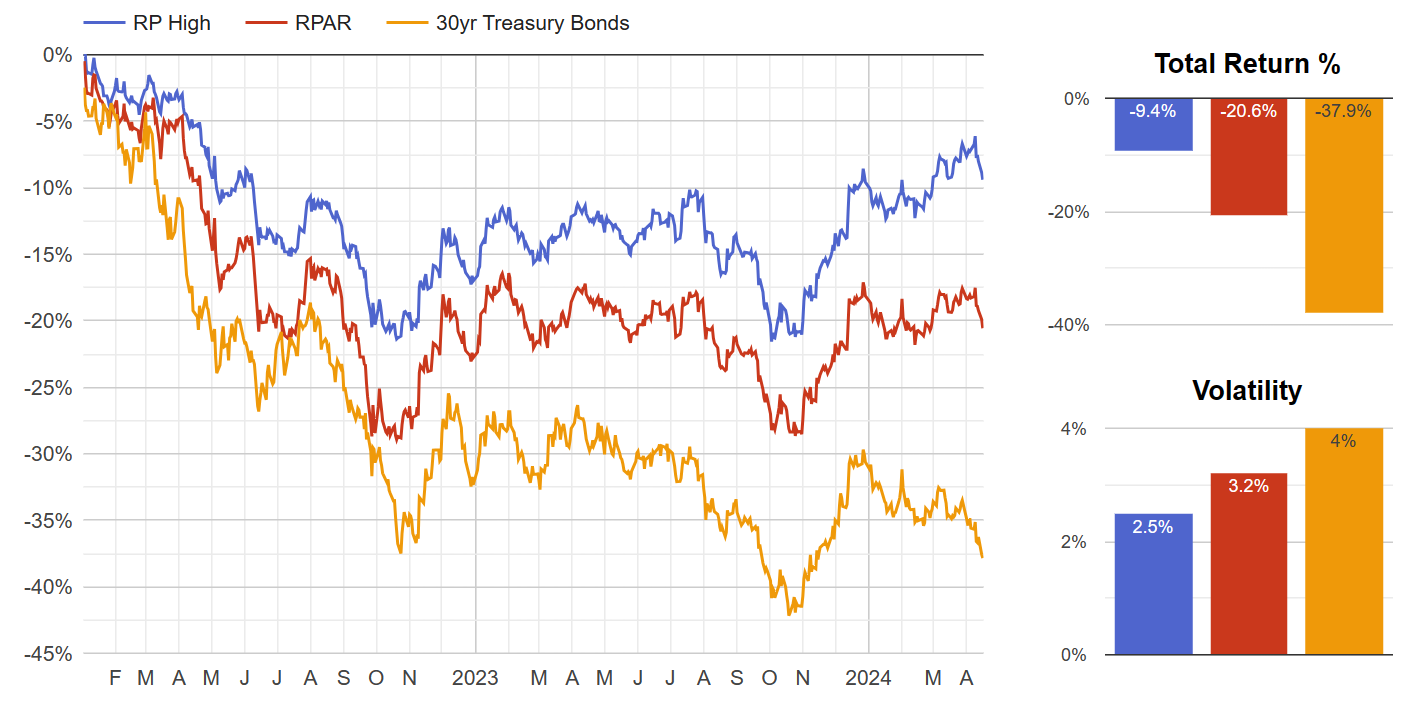
Hedgewise Significantly Outperforming Its Benchmarks Since 2022
Since 2022, Hedgewise has outperformed a passive Risk Parity benchmark (as measured by the RPAR ETF) by over 5% annually, and it has outperformed a passive investment in 30yr Treasury bonds by 14% annually.
We can also zoom in on the period from 2023 to confirm the consistency of this relative outperformance.
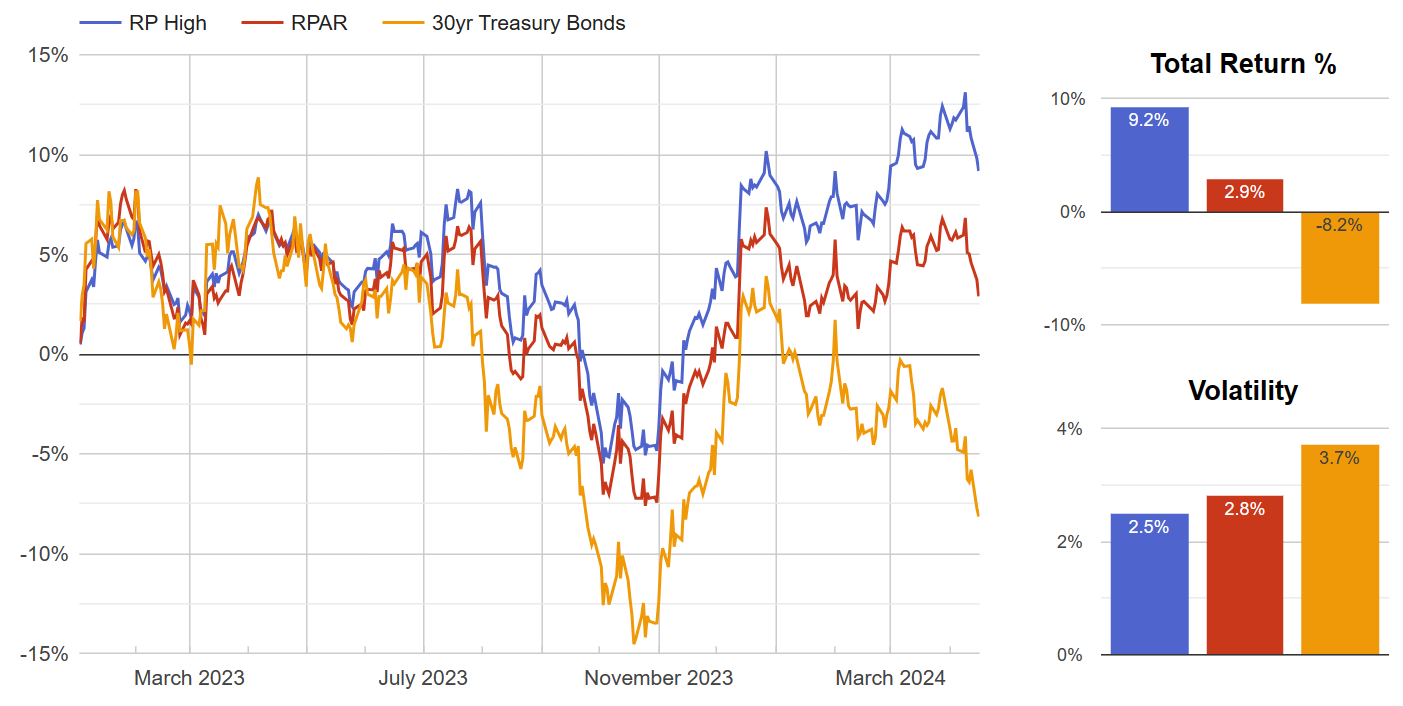
A differential of over +6% (compared to RPAR) is remarkable over such a short timeframe.
The Recovery Is Precisely On Track
Back in July 2022, this newsletter projected that Hedgewise would eventually "create" new gains of 5-20% as a function of the drawdown that year. More specifically, since Hedgewise had successfully mitigated losses, it merely had to return to historically average asset weights to generate an outsized recovery. To visualize this, the following chart compares the live RP Max strategy to a model portfolio composed of historically average asset weights at the same risk level.
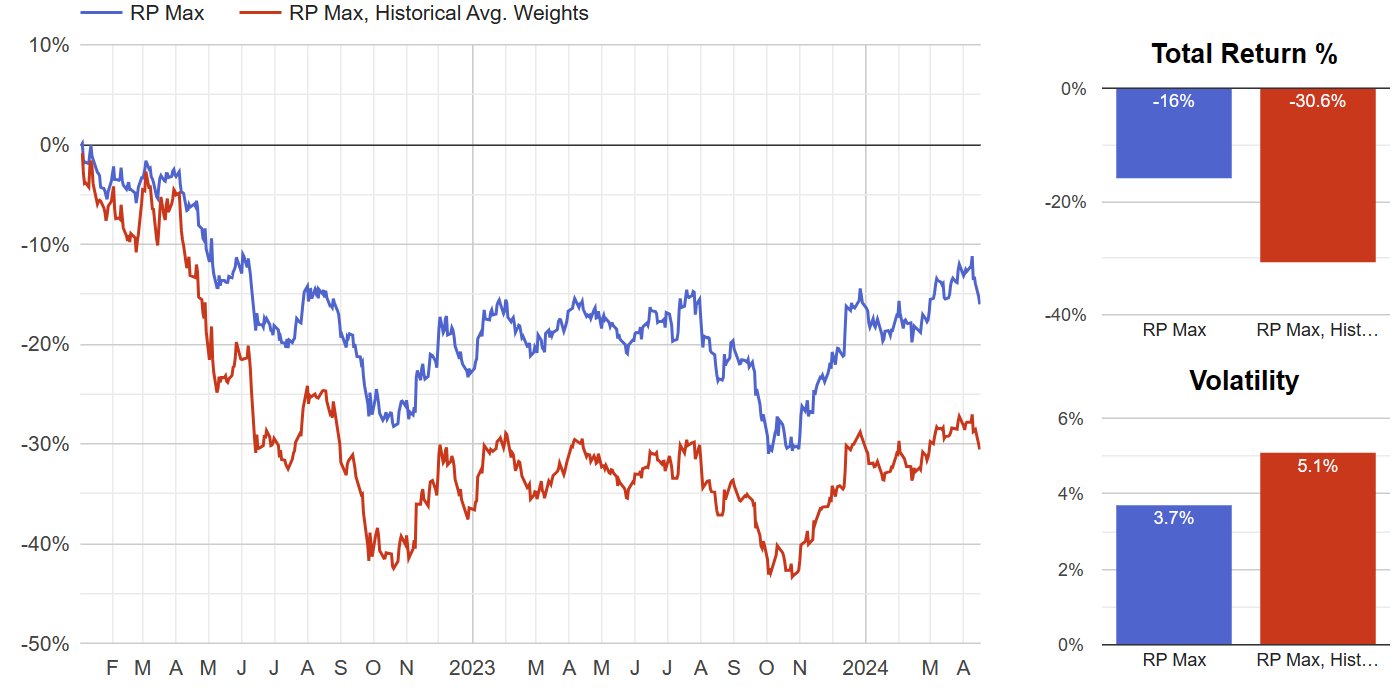
The gap between the blue and red lines represents these potential "new" gains, or the amount that the Hedgewise Max strategy would expect to gain when the red line returns to breakeven. As of April 16, this is worth around 21%, which is north of the upper end of the original estimates. The key to fully realizing this gain is simply to track the red line as it recovers. The following chart zooms in on how this has gone since January 2023.
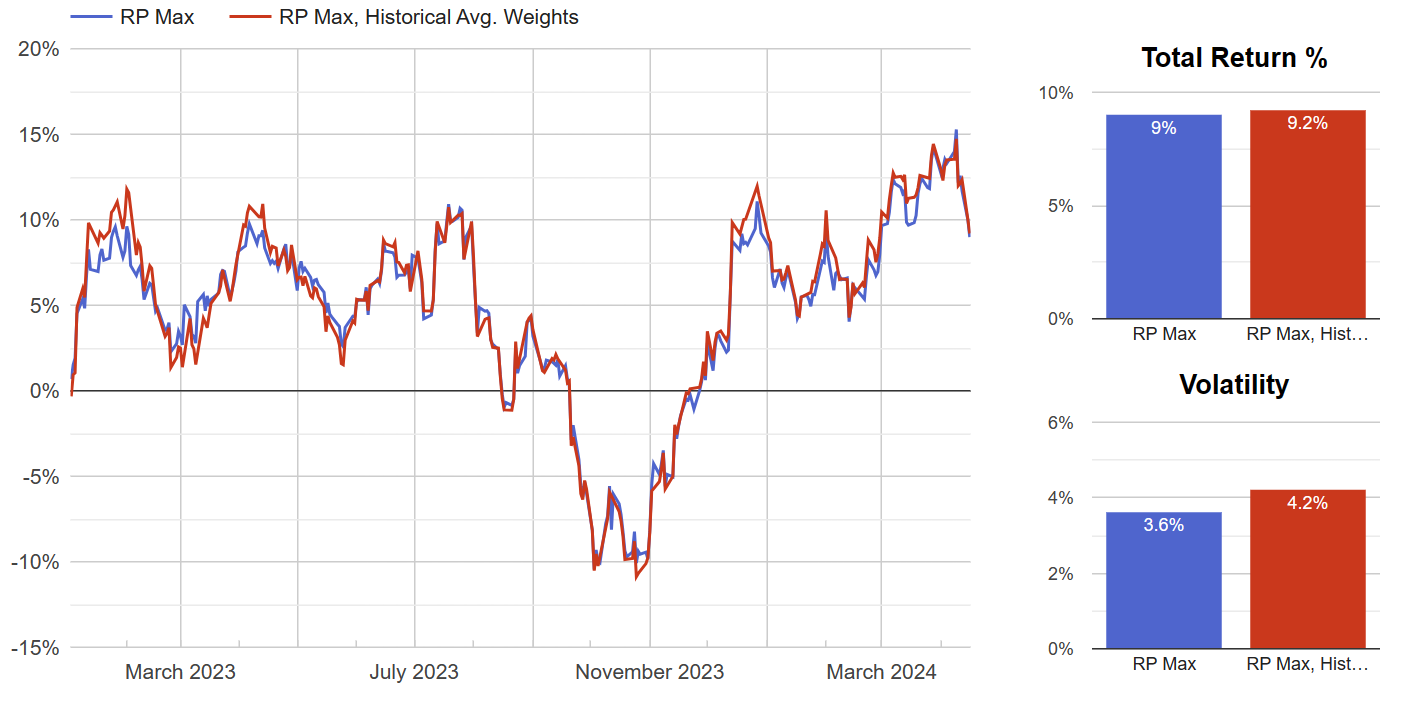
This story is simple and compelling. Hedgewise avoided a big drawdown, and is now fully participating in the recovery, which had reached 9% in April. This is a great outcome in a little over a year, and there is still a huge amount of upside remaining.
Every Asset Class Has Generated Net New Gains, Except Bonds
A more granular way to analyze the recovery is to break down how each individual asset class has impacted the Hedgewise portfolio since the peak in January 2022, which is shown in the following table.
| Asset | Net Impact on RP Max Since Jan 2022 |
|---|---|
| S&P 500 | 2.5% |
| Commodities | 9.9% |
| Bonds | -24.3% |
| Est. Leverage Cost | -4.1% |
| Total | -16% |
Both equities and commodities have already reached or surpassed their January 2022 peaks. Just as the model predicted, these asset classes have also generated net new gains for the RP Max portfolio. This highlights how the theory is no longer hypothetical; the goal was achieved in line with expectations for these cases. We are simply waiting for bonds, but bonds are unique in how little it matters whether the recovery happens in six months or six years.
Why Bond Math Is Amazing and Often Misunderstood
Once interest rates become restrictive, fixed income has three tailwinds that make it very compelling as an investment. First, investors receive higher coupons. Second, assuming rates truly are dampening economic activity, they will tend to reverse lower once inflationary pressure has abated. Third, and unique to Hedgewise, there is an opportunity to systematically take advantage of bond volatility, as it makes sense to add exposure as rates go higher and vice versa.
Taken together, these factors make it very hard to lose money in bonds over a medium time horizon (i.e., 2 years or longer). However, it can be difficult to see this benefit without the proper perspective. For example, 30yr Treasury bonds have lost over 37% since January 2022. But it is more useful to separate it into two periods - the initial drawdown from January to October 2022, and the period thereafter. This allows for a more accurate assessment of how bonds have performed once rates became restrictive.
30yr Treasury Bond Performance Since October 2022
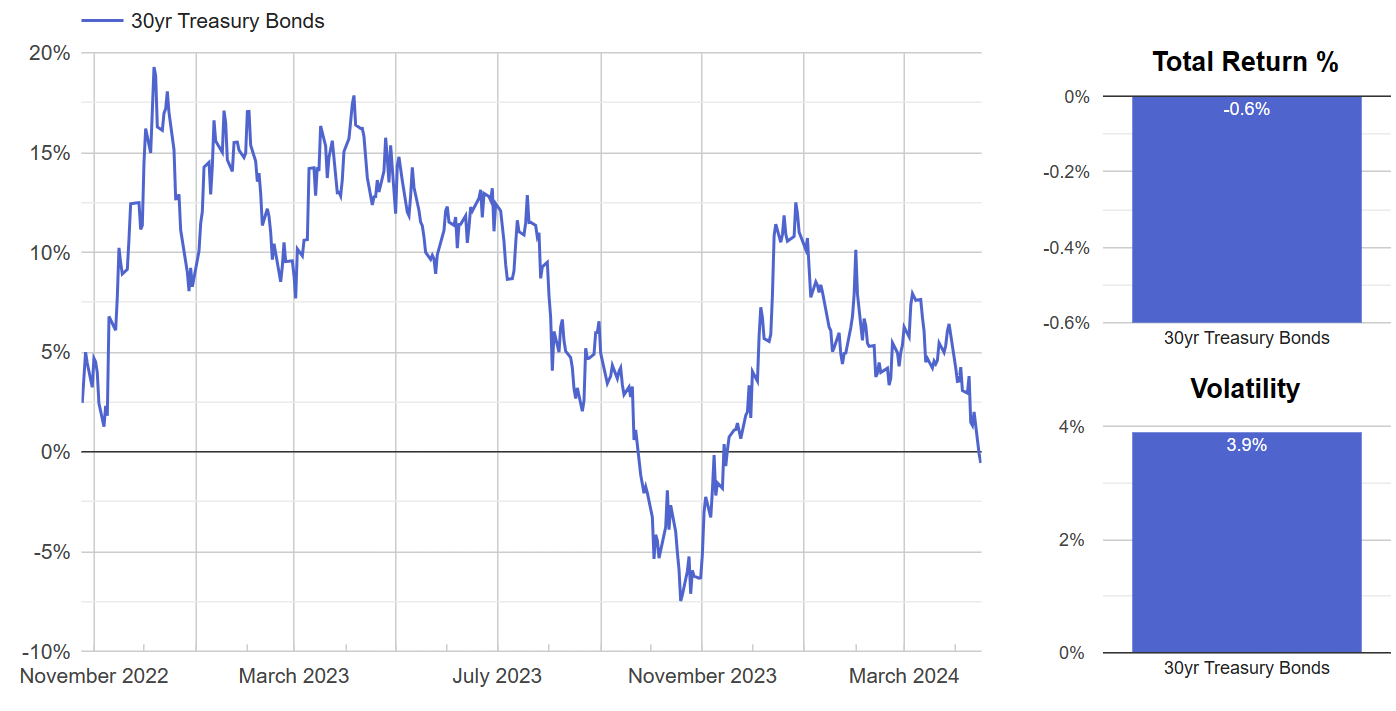
Since the end of October, 30yr bonds are basically breakeven. This is even though bond yields have risen from a peak of 4.4% back then to 4.8% today. Within the Hedgewise portfolio, volatility management has also added another 3% over this timeframe, making it a net positive investment. If rates merely return to the original level of 4.4%, bonds will have provided north of a 10% gain.
This is why the wild short-term swings over the past year and a half have been relatively meaningless in the larger scheme. Once rates get this high, bonds are a sound investment because there is such a large buffer accruing over time. We take advantage of the volatility on the margins, but these month-to-month movements, however large, do not change the underlying investment thesis.
From this perspective, there isn't much to second guess about how the framework has managed bonds since October 2022. But what about the initial drawdown? It's all part of the same theory, and it's all still going to plan.
Evaluating the Initial Bond Drawdown
The basic idea of risk-managed drawdowns is always the same: the impact of the initial loss needs to be less than the subsequent gain. We explored earlier how this has already been successful for equities and commodities since January 2022. Bonds are replicating the same process, just on a longer timeframe. For bonds uniquely, the length of this timeframe does not really matter.
It is easier to understand this with data and scenario planning. For a moment, imagine that 30yr bonds return to a 3% yield at some point in the future. The following table models the expected net impact to the RP Max portfolio from January 2022 to that final date, with the only variable being how long it takes to resolve. For example, the first row assumes that 30yr rates fall to 3% by this July. In that scenario, bonds would gain a total of +7% in the RP Max portfolio, measured from January 2022 (equal to 2.6% annualized over two and a half years), and 38% measured from today. Note that this is incorporating live data through April, and model assumptions begin looking forward from today.
Scenario 1: 30yr Rates Fall to 3%
| Time | Return From Jan 22 | Annualized | Return From Today |
|---|---|---|---|
| 2 months | 7% | 2.6% | 38% |
| 2 years | 16% | 3.3% | 50% |
| 4 years | 26% | 3.5% | 62% |
| 10 years | 59% | 3.7% | 105% |
The longer it takes for rates to fall, the larger the expected annualized return. The math behind this is not complicated - bonds yield somewhere between 5-6% annually in the model through a combination of coupon and volatility management. The longer you get this yield, the higher the final annualized return will be. All these numbers include the initial drawdown, which is more than recovered regardless of when rates return to 3%.
There are a few big takeaways. The first is that much of the work was done during the initial drawdown from January to October 2022, when Hedgewise approximately halved bond losses compared to a passive investment. This is the amount that can be recaptured upon recovery and anchors the numbers in the prior table.
Second, bonds are the unique asset class where time amplifies expected returns. You do not get a higher coupon or the benefit of volatility management in equities or commodities, but this is a systematic feature within fixed income.
Finally, though we are ambivalent to the interim volatility, the fact that rates have swung as high as 5% recently only increases the likelihood that they will fall to 3% or below in the future. Any company or individual that refinances at these punishing levels will be impacted for years, and it is worse the higher rates go. In fact, a recent paper by the San Francisco Fed found tight monetary policy can reduce potential output for over a decade.
Fun With Rate Scenarios
The biggest underlying assumption is that 30yr rates eventually fall to 3%. Considering the Fed pegs its neutral rate at 2.7%, that we spent the better part of a decade with rates under 3%, and that current rate levels have essentially frozen entire parts of the economy (e.g., housing and car loans), I don't think this is a big stretch. To settle at 3.5% or above, productivity and/or population growth would need to surge in the years ahead. But just for fun, we can model a couple other rate scenarios.
Bear in mind that any final rate below today's (roughly 4.8%) represents a gain, and that a 0% return measured from January 2022 is the same as a ~30% gain measured from today.
Scenario 2: 30yr Rates Fall to 3.5%
| Time | Return from Jan 22 | Annualized | Return From Today |
|---|---|---|---|
| 2 months | -2% | -0.9% | 26% |
| 2 years | 6% | 1.3% | 37% |
| 4 years | 16% | 2.2% | 49% |
| 10 years | 48% | 3.2% | 91% |
Scenario 3: 30yr Rates Fall to 4.5%
| Time | Return from Jan 22 | Annualized | Return From Today |
|---|---|---|---|
| 2 months | -18% | -7.2% | 6% |
| 2 years | -10% | -2.2% | 17% |
| 4 years | -1% | -0.1% | 28% |
| 10 years | 31% | 2.1% | 69% |
I think the most interesting number is the 10yr annualized return in the 4.5% scenario. Even in this edge case, bonds will still have contributed a 2% annual gain to the portfolio measured from January 2022. This drives home the bigger picture that the 2-4% annual return range is boringly consistent. If rates settle higher, it just takes longer to eventually get to the same place.
The other notable observation is how high the return from today is across all scenarios. Outside of a permanent rise in yields above 4.8%, bonds should be an excellent investment irrespective of how it compares to January 2022.
Addressing a Few Outstanding Questions
But what if rates do go up to 5% or 6%? Such levels would very likely break the economy and cause a recession like the Volcker-induced slowdown in the early 1980s. Otherwise, you need to assume some combination of permanently higher inflation (3.5%+) and permanently restrictive rates (2.5%+), and it requires mental gymnastics to imagine this realistically. Presuming rates do get this high but only temporarily, the analysis of this article remains the same with a small boost from higher coupons and additional volatility management.
The initial bond losses from January to October 2022 were significant. Could that have been better managed? For reference, 30yr Treasures lost around 33% in those 10 months, compared to an impact of -17% on the RP Max portfolio. Historically speaking, this was both the largest bond drawdown and the most successful loss reduction as far back as data can be modeled. A more aggressive intervention would have required some level of active management and timing.
Finally, why does it make sense to ignore the bond volatility since October 2022 rather than try to take advantage of the swings? Hedgewise has been adjusting exposure throughout, and that is referred to as bond volatility management. It is just in small amounts (i.e., 1-5% monthly) by design. This is because bonds have an asymmetric payoff profile with rates this high. If yields go up another 1%, bonds lose 14%, but they gain 18% if yields fall by the same amount. There are also the tailwinds discussed earlier: a 5-6% annual yield, plus the constant squeeze on the economy from restrictive rates. Lastly, the swings in the market have been rapid and often driven by nothing fundamental - from a risk management perspective, it is much more dangerous to try and time such an environment than to simply wait it out.
Conclusion: But Why Is All This Happening?
Short-term fluctuations have never been very meaningful to Hedgewise, and hopefully this analysis makes it easier to look past the noise. Yet the frequency, extremity, and seeming irrationality of the markets over the past few years has understandably drawn attention. It is not necessary to demystify this for Risk Parity to be successful, but I'd say the crux of it is that the Fed messed up badly, and as a result has become excessively data-dependent and backwards looking. This has fed into post-pandemic market dynamics of leveraged short-term bets and price dislocation that often overwhelms fundamentals over periods of a few months.
The big questions are whether interest rates are restrictive and why it may take a little longer than usual to see the impact. Instead, the Fed is saying "we don't know what is going on", which forces the broader market to react similarly. If one bad inflation print happens, maybe rates are not restrictive, maybe we have to re-think everything. Maybe rates will have to go up even more!
There is a relatively easy story to contextualize this: interest rates are restrictive for the parts of the economy where debt is required, like mortgages and car loans, but not enough of the economy has been impacted yet. It is not realistic to expect growth and inflation to slow down until it affects more individuals and companies. The main question is how long that will take, not how high rates have to be or whether rates matter at all.
If the Fed had strong credibility and conviction, it could explain this. Perhaps it will take 3 years to have enough bite, and inflation will slowly drift down from 3.5% over that time, but there isn't really a way to speed it up that involves interest rates alone. A coherent narrative like this would stabilize long-term interest rates and limit overreactions from month-to-month, but since it doesn't exist, we are left with the current situation.
Interest rates may already be too restrictive, meaning that the parts of the economy that are affected are being punished too severely when they won't meaningfully impact headline inflation either way. This would likely remain true even with higher rates, which would then only matter if they had a psychological impact of pushing the economy into a downturn. Yet inflation may already be on its way to being under control if the Fed could present this forward guidance believably. Unfortunately, it lost too much credibility in 2021 to do so.
If this is happening, rates will stay too high for too long. If the Fed cannot tolerate 3-3.5% inflation while this process plays through, a hard landing may be the only option. Keep this in mind if we do see additional pressure on yields and try not to sweat the volatility.
Disclosure
This information does not constitute investment advice or an offer to invest or to provide management services and is subject to correction, completion and amendment without notice. Hedgewise makes no warranties and is not responsible for your use of this information or for any errors or inaccuracies resulting from your use. Hedgewise may recommend some of the investments mentioned in this article for use in its clients' portfolios. Past performance is no indicator or guarantee of future results. Investing involves risk, including the risk of loss. All performance data shown prior to the inception of each Hedgewise framework (Risk Parity in October 2014, Momentum in November 2016) is based on a hypothetical model and there is no guarantee that such performance could have been achieved in a live portfolio, which would have been affected by material factors including market liquidity, bid-ask spreads, intraday price fluctuations, instrument availability, and interest rates. Model performance data is based on publicly available index or asset price information and all dividend or coupon payments are included and assumed to be reinvested monthly. Hedgewise products have substantially different levels of volatility and exposure to separate risk factors, such as commodity prices and the use of leverage via derivatives, compared to traditional benchmarks like the S&P 500. Any comparisons to benchmarks are provided as a generic baseline for a long-term investment portfolio and do not suggest that Hedgewise products will exhibit similar characteristics. When live client data is shown, it includes all fees, commissions, and other expenses incurred during management. Only performance figures from the earliest live client accounts available or from a composite average of all client accounts are used. Other accounts managed by Hedgewise will have performed slightly differently than the numbers shown for a variety of reasons, though all accounts are managed according to the same underlying strategy model. Hedgewise relies on sophisticated algorithms which present technological risk, including data availability, system uptime and speed, coding errors, and reliance on third party vendors.