


Summary
- Hedgewise products have significantly outperformed benchmarks in 2017, with YTD returns of over 8% for clients in higher risk levels.
- The tumultuous political environment has pushed many investors to be overly cautious due to a misperception of how much influence the President has on the economy.
- Meanwhile, Hedgewise risk algorithms have navigated the environment quite smoothly, including a significant reduction of oil exposure prior to the recent pullback.
- While Hedgewise performance has been strong, there were moderate losses in the first two weeks of March. However, this was quite natural and no cause for concern. In fact, it presents a great case study for why short-term losses rarely matter within the Hedgewise framework.
Politics Dominate the News, but Not the Economy
Recently, the headlines have been overwhelmed by news coming from the White House. There has already been post-election euphoria, a failed Repeal and Replace effort, an escalation of conflicts in the Middle East, and an endless stream of Russian intrigue. Given that, many pundits have naturally attributed the stock market rally since November to optimism over President Trump, and now worry that recent turmoil will quickly reverse the gains.
While this makes for a good story, it doesn't hold up in the real world. Outside of major economic crises requiring government intervention, like the bailouts in 2009, policy doesn't have all that much to do with Wall Street. Investors are largely rational, and value every individual company based on its bottom line and future growth prospects. Given that, it's hard to imagine that every company was suddenly worth 10% more because Trump might reduce regulation, cut taxes, and invest in infrastructure. Even if all of this happened - and everyone knows that is a big if - it wouldn't come close to justifying such an increase in valuation.
The reality is that the US economy had significant tailwinds up until the last month or so. Unemployment continued to drop, inflation finally started to pick up, and the Fed became confident enough to significantly accelerate interest rate increases. This explains most of the stock rally, as well as the dramatic correction in bonds last October and November. The macroeconomic data coming in for the first quarter has cooled off a bit, though, and stocks along with it.
The point is that it makes far more sense to follow the data than to follow the news. Thus far, the numbers say that investors aren't particularly worried about Trump destroying the economy. He would need to bungle something major (like starting a trade war) to have any real impact, but nothing that has happened so far has caused much worry.
Against this backdrop, it has actually been a relatively stable few months in terms of risk. Since the Hedgewise framework is entirely quantitative, there was no chance of overreaction to the news, leading to significant gains for most clients. To better frame relative performance, I've compared Hedgewise products to more "traditional" portfolio mixes, represented by the iShares Conservative ETF (AOK), the iShares Moderate ETF (AOM), and the iShares Aggressive ETF (AOA). I've also shown a separate graph of the Hedgewise Risk Parity+ strategy compared to the largest competitive mutual funds.
Hedgewise YTD Performance vs. Traditional Portfolio Benchmarks
| Product | YTD | Benchmark (Ticker) |
|---|---|---|
| RP+ Medium | 4.22% | 2.51% (AOK) |
| RP+ High | 5.34% | 2.9% (AOM) |
| RP+ Max | 7.51% | 5.19% (AOA) |
| Momentum | 8.55% | 5.96% (SPY) |
| L/S Oil | -6.86% | N/A |
Hedgewise Risk Parity+ vs. Largest Competitive Mutual Funds
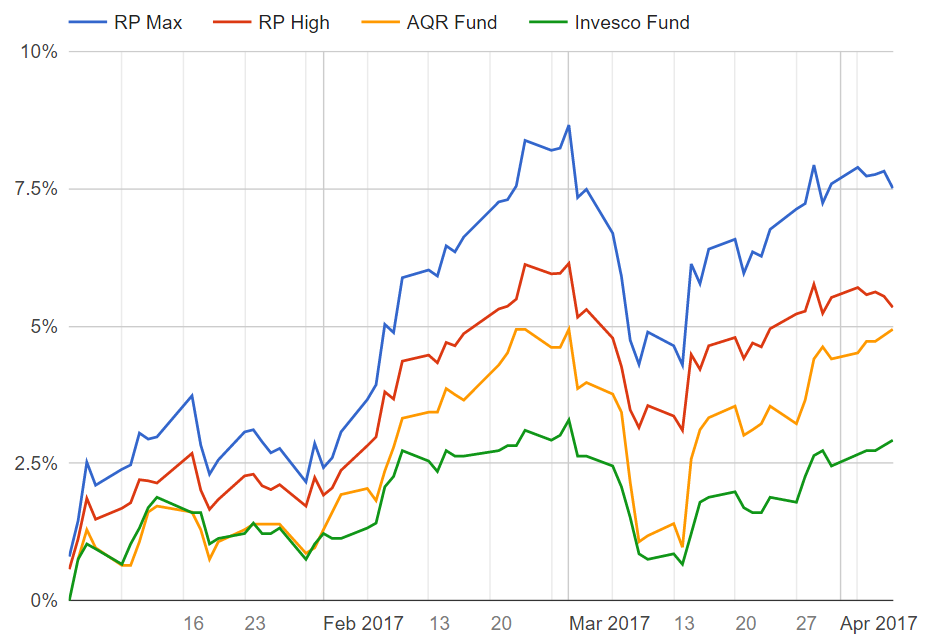
These performance numbers are exactly what you'd want to see: for a given level of risk, clients have generally achieved higher returns. While Long-Short Oil has incurred losses, they are quite typical of the swings inherent to that strategy, which tends to be both streaky and extremely volatile (Note that I generally will not provide more detail on alpha products due to their proprietary nature).
Looking forward, it's likely that one of stocks, bonds, or gold will reverse course, as it doesn't really make sense for them all to have appreciated together. While this may result in a short-term dip, as we saw in early March, this is a natural part of the process and has no bearing on long-term returns. As risk unfolds, Hedgewise algorithms shift to ensure your outlook remains bright regardless.
How Risk Algorithms Are Driving Performance
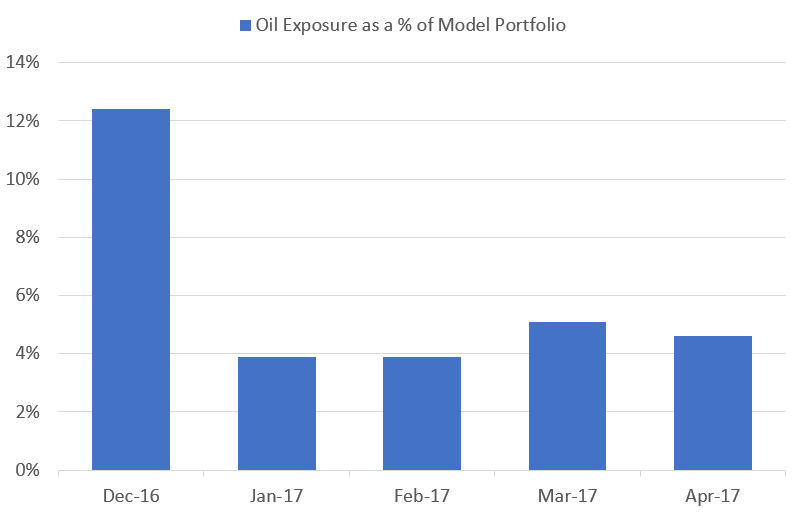
In the first quarter of this year, risk signals were relatively low in every asset class besides oil, which had its exposure reduced beginning in January. These signals are not meant to be predictive of positive or negative returns; rather, they reflect some possibility of a large correction. Oil provided an excellent example of such a risk unfolding over many months. Even though net losses have not been significant, the system was still accurate in identifying the possibility of severe downside.
Oil Exposure By Month In Hedgewise Risk Parity+ Model
YTD Price Change of WTI Oil
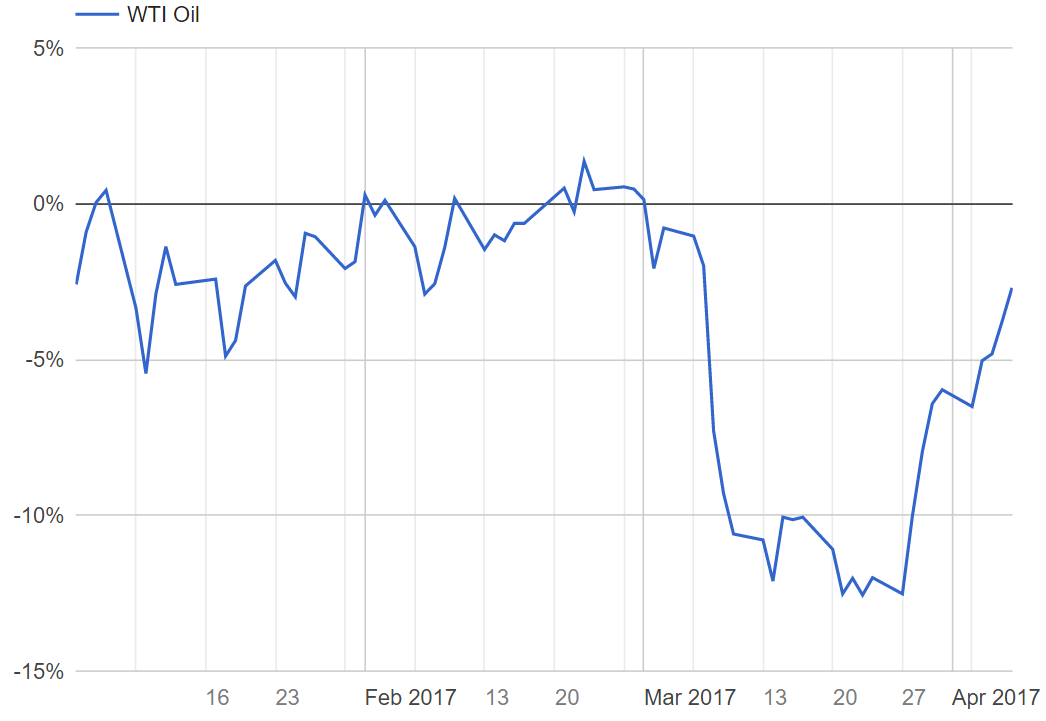
This is a great example of the kind of risk that is the primary focus at Hedgewise. As intended, the system was overly conservative, and reduced exposure to oil all the way back in January. Oil went on to rally slightly from mid-to-late February, but this had little impact on the overall risk assessment since short-term movements are not the focus. By March, the risk had been fully realized, with oil prices dropping by over 10% in a matter of days. Despite a subsequent recovery, the risk assessment was spot on. Even if oil manages to fully recover from its losses, it was still absolutely worthwhile to trim exposure given the general environment.
Conversely, all other major asset classes have been relatively stable (in other words, not demonstrating a risk of a major downside event). This doesn't mean all these assets were expected to appreciate; in normal conditions, you'd expect some to do well and others to do poorly, and thus drive a balanced positive return. However, markets frequently behave oddly over short periods of time, as can be seen by the YTD returns below.
YTD Returns by Asset Class
| Asset | YTD |
|---|---|
| S&P 500 | 5.96% |
| Treasury Bonds | 2.0% |
| TIPS Bonds | 2.11% |
| Gold | 8.98% |
| Oil | -2.7% |
While these returns suggest some disagreement across markets, they still led to a great few months of performance for Hedgewise clients. That said, it's easy to see that this is not sustainable. If real economic growth is high, TIPS should be doing terribly unless there is a great deal of inflation. However, in that case, Treasury Bonds should be tanking. This generally indicates that the players in the different markets have different views, at least one of which is not correct.
This means that one of these asset classes is probably overvalued, but no one knows which one yet. This is a very different category of risk than the one discussed in the oil markets: this involves short-term price distortion despite a generally solid base. To address it, you'd need to accurately predict weekly directional price movements - which is incredibly difficult and resource-intensive.
Rather than seek such precision, Hedgewise simply waits for these forces to play out and bets on an overall positive return regardless. A good example of this process happened in early March which is instructive to examine in greater detail.
Examining the March Dip
Here's a closer look at the pullback in the Risk Parity strategy in March.
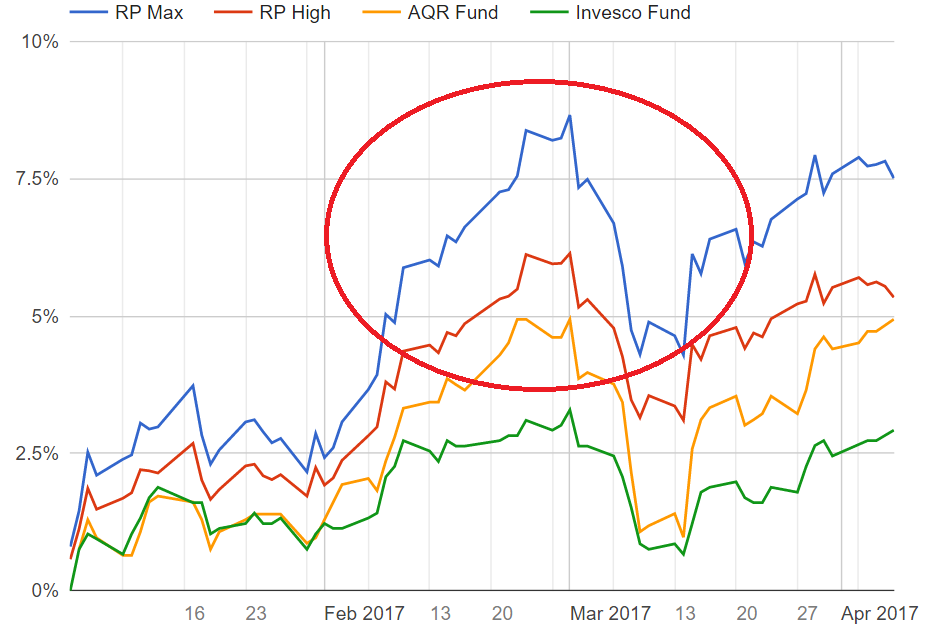
There's three key reasons this particular pattern should raise no concern. First, notice the symmetry in the graph: almost immediately prior to the pullback, there was a nearly equivalent rally. Such fast gains, especially in a balanced portfolio like Risk Parity, often suggest that something is out of balance and will need to correct. Second, there's absolutely no need to try and avoid that correction because it won't matter in the big picture. Finally, attempts to manipulate performance in this short of a time period are very dangerous and can easily backfire.
To better prove this, I took a look at the limited Risk Parity model that runs back to 1972, and isolated all of the years in which there was a single month with losses of 7% or more. I compared that alongside the annual return for that same year to see how much of an effect those large short-term losses had overall.
Impact of Large Short-Term Losses on Annual Returns, Risk Parity Model
| Year | Worst Mth | Ann. Return |
|---|---|---|
| 1973 | -7.0% | -7.49% |
| 1976 | -7.1% | 35.44% |
| 1978 | -12.4% | -3.06% |
| 1979 | -7.8% | 34.94% |
| 1980 | -8.1% | 44.36% |
| 1981 | -10.7% | -11.59% |
| 1982 | -8.8% | 69.10% |
| 1984 | -7.3% | 1.56% |
| 2000 | -7.6% | 9.77% |
| 2003 | -8.2% | 28.41% |
| 2004 | -8.0% | 8.95% |
| 2011 | -7.8% | 31.18% |
| 2012 | -7.1% | 8.05% |
| 2015 | -8.1% | -11.89% |
| Avg. | -8.28% | 16.98% |
In years when you lost 8% in a single month, you went on to gain an average of 17% regardless! While this may seem counterintuitive, it all comes back to balance and effective risk management. Since all assets tend to appreciate over time, you almost always win simply by waiting for markets to work things through.
Looking Ahead
Summing all this up, the outlook is generally positive but with expected chop along the way. Too many assets have gone up together in the past few months, but it's impossible to say how long that will last or what is currently overvalued right now. That's perfectly fine, though, as the Hedgewise risk algorithms have continued to catch major events and short-term swings will have little impact by the end of the year.
More importantly, Hedgewise has already driven significant gains for clients in 2017 and beaten most major benchmarks, and I fully expect that trend to continue.
Disclosure
This information does not constitute investment advice or an offer to invest or to provide management services and is subject to correction, completion and amendment without notice. Hedgewise makes no warranties and is not responsible for your use of this information or for any errors or inaccuracies resulting from your use. Hedgewise may recommend some of the investments mentioned in this article for use in its clients' portfolios. Past performance is no indicator or guarantee of future results. Investing involves risk, including the risk of loss. All performance data shown prior to the inception of each Hedgewise framework (Risk Parity in October 2014, Momentum in November 2016) is based on a hypothetical model and there is no guarantee that such performance could have been achieved in a live portfolio, which would have been affected by material factors including market liquidity, bid-ask spreads, intraday price fluctuations, instrument availability, and interest rates. Model performance data is based on publicly available index or asset price information and all dividend or coupon payments are included and assumed to be reinvested monthly. Hedgewise products have substantially different levels of volatility and exposure to separate risk factors, such as commodity prices and the use of leverage via derivatives, compared to traditional benchmarks like the S&P 500. Any comparisons to benchmarks are provided as a generic baseline for a long-term investment portfolio and do not suggest that Hedgewise products will exhibit similar characteristics. When live client data is shown, it includes all fees, commissions, and other expenses incurred during management. Only performance figures from the earliest live client accounts available or from a composite average of all client accounts are used. Other accounts managed by Hedgewise will have performed slightly differently than the numbers shown for a variety of reasons, though all accounts are managed according to the same underlying strategy model. Hedgewise relies on sophisticated algorithms which present technological risk, including data availability, system uptime and speed, coding errors, and reliance on third party vendors.