


Summary
- Nearly all risk parity funds lost money in 2015 due to poor performance across bonds, stocks, and especially commodities
- This has led many to question the viability of a 'risk-balanced' approach, especially in a low interest, low growth environment
- However, a quick look at history reveals that last year was not particularly surprising, nor any indication that the risk parity framework no longer makes sense
- In fact, the current state of the markets makes it increasingly likely that risk parity funds will soon experience a resurgence in both relative returns and popularity
Introduction: A Quick Review of Risk Parity
At its core, risk parity is no more than a broad and well-balanced portfolio. The idea is quite simple: diversification allows you to achieve a steadier return with less risk of loss, which is basically the oldest concept in finance. If you run the numbers for the past 60 years, you'd find that the most optimally diversified portfolio (i.e., with the highest return given its risk of loss) is about 60% in bonds, 30% in stocks, and 10% in commodities like gold.
Risk parity proponents looked at this and observed two things. First, that it was fairly sensible if you considered that bonds are quite a bit less risky than stocks, which are quite a bit less risky than commodities. If your goal was to balance returns between the different asset classes, the proportions roughly made sense. Second, they thought it was odd that this mix didn't look very much like the composition in most investor portfolios, but quickly realized it was probably because a portfolio of 60% bonds won't have very high expected returns, even if they are quite steady. Instead of changing the mix, though, they just recommended adding some leverage to the portfolio while keeping the proportions steady.
We can model the performance of such a portfolio by using a mix of 60% 10 Yr Treasury Bonds (IEF) / 30% S&P 500 (SPY) / 10% gold (GLD) as a reasonable proxy. We can also model the effect of leverage (we chose 50% for illustrative purposes), and we assume its cost is equivalent to the rate on one-year bonds at any point in time. Note that 1970 is the earliest that data is available for all three of these assets, all dividends are included and assumed to be reinvested, and that this is only a hypothetical model based on index data.
Performance of the S&P 500, the 60/30/10 Mix, and the Mix Plus 50% Leverage Since 1970
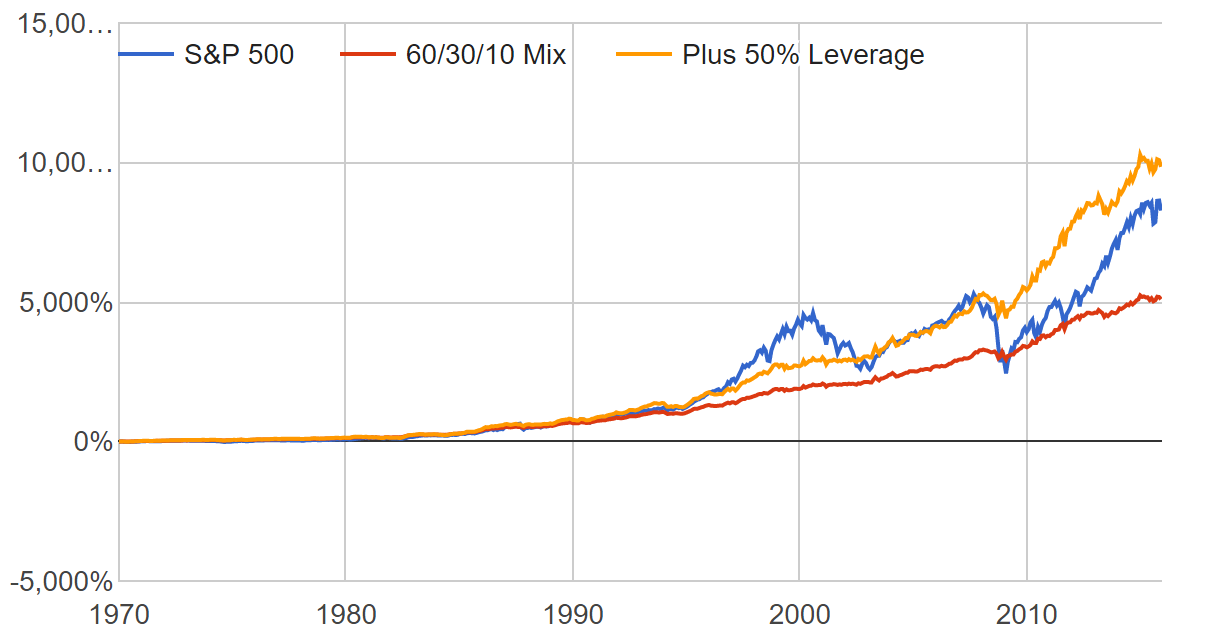
Perhaps unsurprisingly, the diversified mix tends to be far more steady, with about half the volatility and max drawdowns. You do need to add in leverage to get up to similar returns as the S&P 500, but once you do, you wind up with net outperformance over the long run with less overall risk. Sounds great, right?
Of course, investing decisions are far easier when you are looking at fifty years. In a more immediate timeframe, a few natural issues can cast doubt over the viability of risk parity. First, it will definitely lag the S&P 500 over stretches, like the late 90s, when bull markets are in full swing. Second, it will still experience drawdowns, and they very well may happen when more traditional strategies are performing well. Finally, since its very nature is to hedge your exposures, you will have to constantly tolerate poor performance in a few of your assets.
Nonetheless, you can only achieve the benefits of diversification if you patiently allow all of these things to happen. To help reconcile these facts, we've directly addressed each of the problems raised above, provided context for how it relates to the 2015 performance of risk parity, and presented the case for why risk parity may be one of the best bets for 2016.
Myth #1: It Doesn't Make Sense Because It Lags the S&P
One of the biggest hurdles to maintaining faith in any investment strategy is when everyone else seems to be doing better than you. Since the depths of the last crisis, this is the relative performance of each of the strategies discussed above.
Performance of the S&P 500, the 60/30/10 Mix, and the Mix Plus 50% Leverage Since January 2009
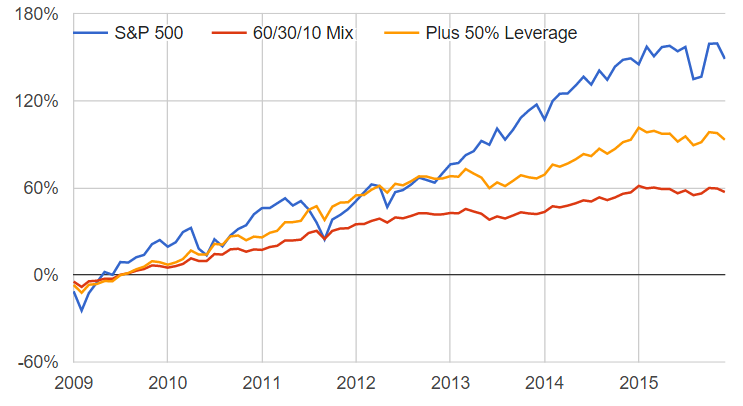
Of course it is difficult to watch this without making changes, or to believe that the diversified mix is still somehow superior. Keep in mind, though, that one asset class is outperforming the rest 100% of the time. You can draw this same graph in the 80s and prove that bonds are the best investment, or in the 70s to prove that commodities are the best investment, and so on and so forth. Diversification continues to be superior because no asset rallies forever, and slow and steady always wins the race.
Not convinced? This will help. Check out the rolling 10 year returns of the risk parity portfolio as far back as the data goes.
Rolling 10 Year Returns of the Leveraged Risk Parity Mix
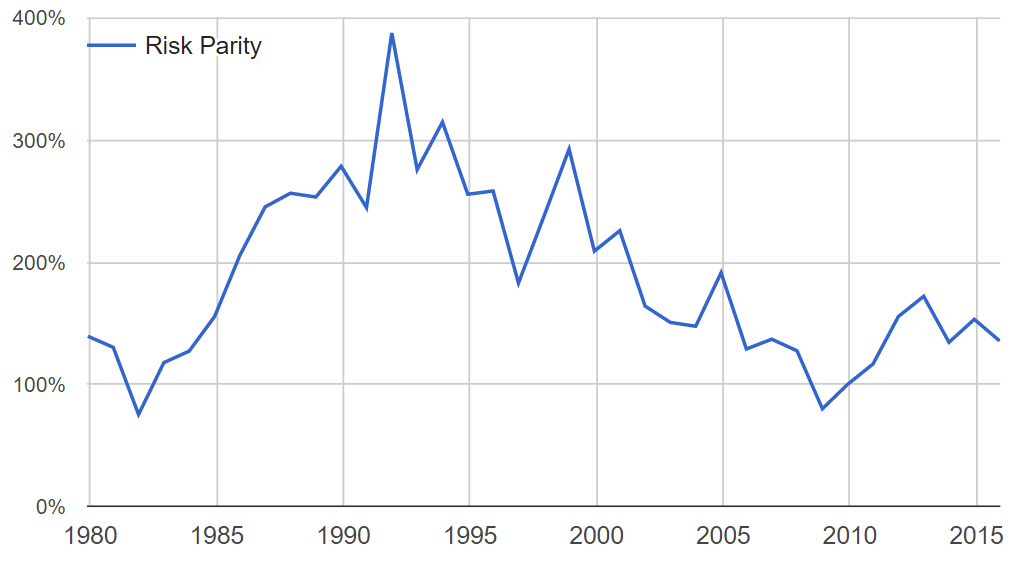
Next, consider this: if you had started investing in the S&P 500 in December of 1999, you would have gone on to lose 6% over the next 10 years. As illustrated in the graph above, the worst 10 year performance for risk parity was about a 100% gain. The magic of diversification is that it frees you from having to time the markets, and from the horrible possibility that you are about to face an enormous crash. Make no mistake: there will be another recession, and it will blindside most people. You can switch away from diversifying and pray you know when to get in and out, or you can be happy even if you underperform a few bull markets because you'll make it up when the bear returns.
Myth #2: It Doesn't Make Sense Because It Lost Money Last Year
No investing strategy is immune to loss. Even in a diversified portfolio, you will lose money if one asset experiences a significant crash, or all assets have a relatively bad year. In 2015, both things happened: bonds, stocks, and commodities all wound up in the negative and commodities had one of their worst years in history.
This had a particularly negative impact on the perception of risk parity because commodities dragged down its performance, while most traditional strategies have little to no exposure to that asset class. However, when you are diversifying, your goal is to own assets that perform very differently from one another, such that their movements tend to offset over time. Commodities clearly fit this definition, and history has shown that adding them to your mix has clear benefits, especially as a protection from high inflation or currency devaluation.
Consider the following two cases. From January 2008 to February 2009, this is how each of the major asset classes performed:
S&P 500: -50% loss
10yr Treasury Bonds: 12% gain
Gold: 10% gain
When stocks are the culprit, it is quite easy to see the benefits of maintaining exposure to other assets. Let's now compare this to asset class performance during 2015:
S&P 500: -0.14% loss
10yr Treasury Bonds: 1% gain
Gold: -8% loss
Commodities happened to be the worst performer last year, but why should that be viewed differently than what happened to stocks in 2008? In both cases, it helped to own a broad mix of assets. In both cases, you would have lost money for the year. Neither is any indication that diversification is failing to do its job. Such periods are a natural part of the ebb and flow of a balanced portfolio.
Myth #3: But This Time It Might Be Different
Still, there is often a lingering fear that maybe this time, balance will not return - maybe a certain asset class is somehow doomed to an extraordinarily long period of poor performance that will drag everything down.
To assuage those fears, let's zoom in on the return performance of the risk parity mix over a shorter timeframe.
Rolling 3 Year Returns of the Leveraged Risk Parity Mix
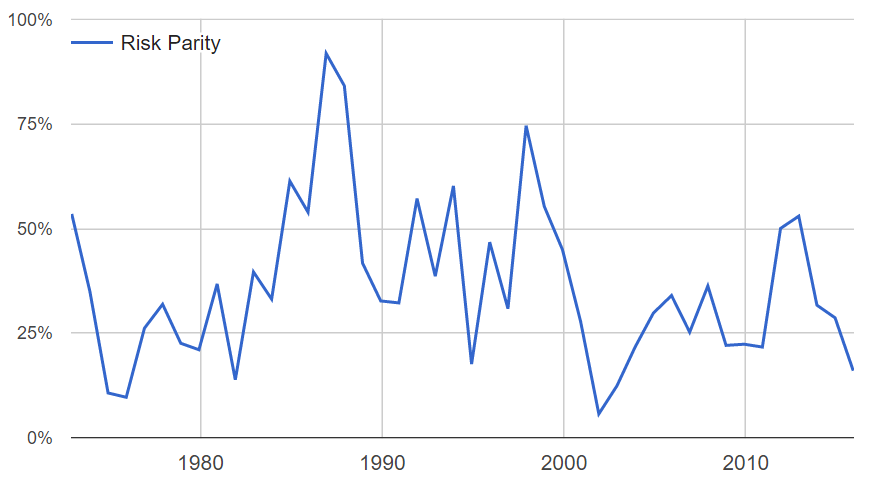
If you can afford to wait even 3 years, the diversified portfolio has never lost money. This isn't to say that every asset class always quickly recovers; commodities had a prolonged down period during the 80s, but this was offset by a rally in stocks and bonds. Stocks had a horrible decade beginning in 2000, but bonds and commodities performed quite well. Even when single asset classes fall and fail to recover, balance still eventually prevails.
Here's one more great fact for you. This portfolio has also never experienced two consecutive years of loss. It's not to say that it couldn't happen - anything is possible - but in 45 years, it hasn't yet. Historically speaking, you'd have been 100% wrong if you declared diversification dead after a single bad year.
Nonetheless, our current environment is particularly fear-inducing because interest rates have been so low for so long. What if rates skyrocket amidst a struggling global economy? What if bonds are sure to lose money? What if all asset classes keep performing badly at once, like in 2015?
Even if all of these scenarios have a chance of unfolding, diversification still remains your best bet unless you can predict the future with certainty. If all assets were going to go down at once, your only option would be to go short or move to cash. As we just mentioned though, this bet has been wrong 100% of the time after just experiencing a year of losses. You could remove exposure to particular asset classes, like bonds, but Germany recently witnessed interest rates near 0%, while U.S. rates are still above 2%. How sure are you that rates cannot go lower?
It's absolutely true that the diversified risk parity mix has underperformed stocks for a few years now. This is also exactly why it is a fantastic bet for 2016.
Looking Forward: Is Risk Parity About to Make a Comeback?
When stocks are the best performing asset class, they inevitably outperform any form of diversification until the bull market ends. Because of this, diversified strategies like risk parity will have natural cycles of underperformance and outperformance compared to stocks over time.
The following graph indicates the difference between the total cumulative return of the leveraged risk parity mix to the S&P 500 since 1970. When positive, it means that risk parity is outperforming stocks. When negative, it means that it is underperforming.
Leveraged Risk Parity Performance Minus S&P Performance Since 1970
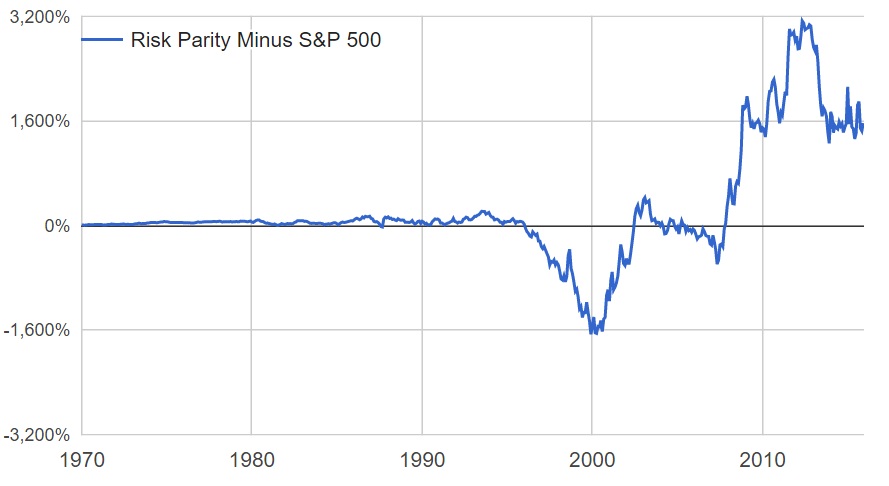
There are two immediate highlights. First, the leveraged risk parity mix has indeed outperformed the S&P 500 for a majority of the time, but it goes through constant up and down cycles (note that scale distorts this picture; most 10 year spans look similar to the period since 2000). We can zoom in on the period since 2003 to more vividly see the current one.
Leveraged Risk Parity Performance Minus S&P Performance Since 2003
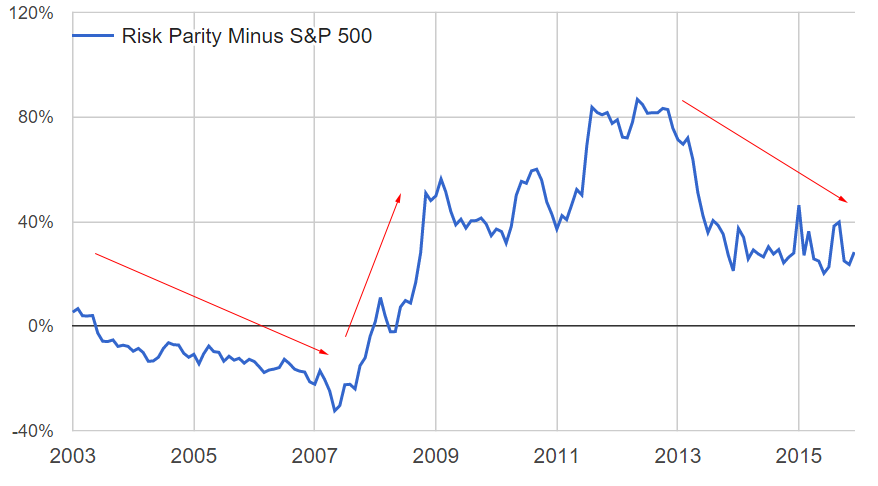
The point is that risk parity tends to look bad in a relative sense if you begin measurement from the start of any bull market. As soon as you expand the horizon to include at least one bear, its outperformance over the long run becomes far more clear.
In short, as soon as the next recession comes along, risk parity will look really smart again. The current bull market is the third longest in history, right behind the 1920s and the 1990s. It may have room to run yet, but it is already facing some stiff headwinds from global growth, the strong dollar, and rising interest rates. When it ends (and it inevitably will), the gains in a non-diversified portfolio will quickly vanish and perhaps take a decade to recover. For risk parity, on the other hand, it will just be another normal year.
If you believe you will live through even one bear market in your investment lifetime that you are unable to avoid, you will do better by staying diversified even through the longest of bull markets. You will have years of losses when others gain, and you will be holding assets that go through crashes, but when the dust settles, you will still wind up on top.
By the time the pundits rally back around risk parity, it will probably already be too late for most investors. So far in 2016, equities are off around 5%, while risk parity is closer to breakeven. If you are already well-diversified, well done and keep faith. If not, it's still not too late - but be sure to make some changes before the next bear market hits.
Disclosure
This information does not constitute investment advice or an offer to invest or to provide management services and is subject to correction, completion and amendment without notice. Hedgewise makes no warranties and is not responsible for your use of this information or for any errors or inaccuracies resulting from your use. Hedgewise may recommend some of the investments mentioned in this article for use in its clients' portfolios. Past performance is no indicator or guarantee of future results. Investing involves risk, including the risk of loss. All performance data shown prior to the inception of each Hedgewise framework (Risk Parity in October 2014, Momentum in November 2016) is based on a hypothetical model and there is no guarantee that such performance could have been achieved in a live portfolio, which would have been affected by material factors including market liquidity, bid-ask spreads, intraday price fluctuations, instrument availability, and interest rates. Model performance data is based on publicly available index or asset price information and all dividend or coupon payments are included and assumed to be reinvested monthly. Hedgewise products have substantially different levels of volatility and exposure to separate risk factors, such as commodity prices and the use of leverage via derivatives, compared to traditional benchmarks like the S&P 500. Any comparisons to benchmarks are provided as a generic baseline for a long-term investment portfolio and do not suggest that Hedgewise products will exhibit similar characteristics. When live client data is shown, it includes all fees, commissions, and other expenses incurred during management. Only performance figures from the earliest live client accounts available or from a composite average of all client accounts are used. Other accounts managed by Hedgewise will have performed slightly differently than the numbers shown for a variety of reasons, though all accounts are managed according to the same underlying strategy model. Hedgewise relies on sophisticated algorithms which present technological risk, including data availability, system uptime and speed, coding errors, and reliance on third party vendors.