


It has been quite the week! As of last Thursday, stocks were up 5% year-to-date. Since then, they've undergone the fastest stock correction in history, falling about 13% or so through February 27. Given these extreme events, I wanted to provide a few thoughts on how to think about this situation and how I expect this to play out over the next few months. In short, I attribute a large portion of these losses to panic and uncertainty, as even the worst-case scenarios with the virus should only have about a 10% impact on asset valuations. Regardless, the two Hedgewise frameworks have balanced each other appropriately thus far, and I expect that to continue.
To first address the elephant in the room, let me explain why the Coronavirus isn't quite as scary as the markets might have you believe. This is by definition a temporary event; while it persists, it creates damage, but once it is gone, it is gone. This is different than financial contagion like that of 2008. When the real estate market collapsed, there was a permanent, rather than temporary, loss of wealth. Many mortgages simply couldn't be paid, and the houses were bought at improperly inflated prices. Contrast that to the Coronavirus: once it ends, there's no reason to expect it to continue to impact asset prices. We'll all return to our jobs, pay our bills, and asset prices (whether houses or otherwise) should be worth about what they were beforehand.
Given that, any economic damage must be framed as one-time rather than ongoing. With that in mind, there are three main possibilities for the virus of increasing potential economic damage:
For the sake of argument, I want to focus on this final scenario. First of all, there is nothing to suggest so far that the Coronavirus is nearly as deadly as the Spanish flu. But let's assume that somehow it becomes that way. Back in the days of the SARS outbreak, the World Bank estimated that:
"Something as bad as the 1918-19 Spanish flu would cut the world's economic output by 4.8 percent and cost more than $3 trillion. "Generally speaking," the report added, "developing countries would be hardest hit, because higher population densities and poverty accentuate the economic impacts."
While $3 trillion is a large number, the S&P 500 also yields a profit of about $1.4 trillion annually. The question becomes what losing about 2 years (i.e., $3 trillion divided by $1.4 trillion) of profit should do to corporate valuations. If you do this via a cash flow analysis, and basically chop off the most immediate two years of earnings for a company, but otherwise leave the future cash flows untouched, you get an expected discount of about 8%. And that's for an outbreak the level of the Spanish Flu!
Yet here we are with stock losses of 13% before we've even entered a full-blown pandemic. I could certainly be convinced that there are bigger indirect impacts at work, or that if this causes a recession directly, there will be other damaging financial ripples. But it would be really, really difficult to envision it lopping off more than 13% of total global asset values, especially if it's a more run-of-the-mill flu.
A more likely story is that investors despise uncertainty, and the recent outbreaks in Europe, Asia, and the US have led to headline-induced panic selling. Companies can't really gauge what the impact will be, and even though it wouldn't be that big of a deal if they lost the entire year of earnings (which they probably won't), investors prefer to sell the unknown.
To buttress this argument, it's worthwhile to do a little data digging. First, to cast a really wide net, I just wanted to look at all possible months where the S&P lost at least 3% in an otherwise solid year of gains. There have been 41 such months, and something happened in each that really got investors on edge. To gauge whether such events manifested in terrible economic outcomes, I looked at the average returns over the subsequent one, three, six, and one year periods.
Average Forward Returns After a Month of >3% Loss in the S&P 500
| 1mth | 3mth | 6mth | 1yr |
|---|---|---|---|
| 1.17% | 4.67% | 9.08% | 13.55% |
On average, you fully recover the loss between three and six months, and there's nothing to suggest that these kinds of "sudden" events are good predictors of worse to come. That said, it is interesting to narrow down the data set to only the periods when you did go on to lose money over the next 3 or 6 months to see if some pattern emerges.
All Months of >3% Loss in the S&P 500 that were Followed by Additional Losses
| Month | Fed Tightening? | Recession? |
|---|---|---|
| 8/1/1956 | X | |
| 9/1/1959 | X | X |
| 4/1/1962 | ||
| 5/1/1966 | X | |
| 6/1/1969 | X | X |
| 7/1/1971 | X | |
| 1/1/1973 | X | X |
| 1/1/1977 | X | |
| 8/1/1981 | X | |
| 9/1/2000 | X | X |
| 7/1/2007 | X | X |
| 5/1/2011 | ||
| 10/1/2018 | X |
Some mixture of inflation, an overheating economy, and a tightening Fed was the culprit in a whopping 85% of the cases! This makes sense since recessions require financial stress almost by definition; there is no modern case of a geopolitical event causing a full recession purely on its own.
Nonetheless, there were two instances of sustained losses that did not revolve around the Fed or the economy that are worth exploring. The first was called the "Kennedy Slide" in 1962, which an investigation by the SEC attributed to "an isolated, nonrecurring incident with precipitating causes that were unable to be confidently ascertained". What a way to categorize a market panic! The second was more recently in 2011, and was due to the European sovereign debt crisis, and more closely resembles the anxiety resulting from the Coronavirus. The fear is that the geopolitical event will set off a chain reaction, eventually setting off a number of financial triggers that will begin to spiral downward independently of the initial catalyst.
While such fears are frustratingly common to market pullbacks, they have never been realized due to geopolitical factors for two important reasons. The first is that such events are very directly influenced by market participants. For example, the higher panic rises about a virus, the more the public may engage in safety procedures and self-quarantines. It is not a self-perpetuating downward cycle in the same manner as financial contagion. The second is that the moment the problem can be called "under control", the negative pressures on the economy are almost instantly lifted because they were very direct.
It's little surprise that this usually winds up in market whiplash rather than anything more nefarious. A look at market performance in 2011 confirms this picture.
S&P 500 Performance, 2011 to 2013
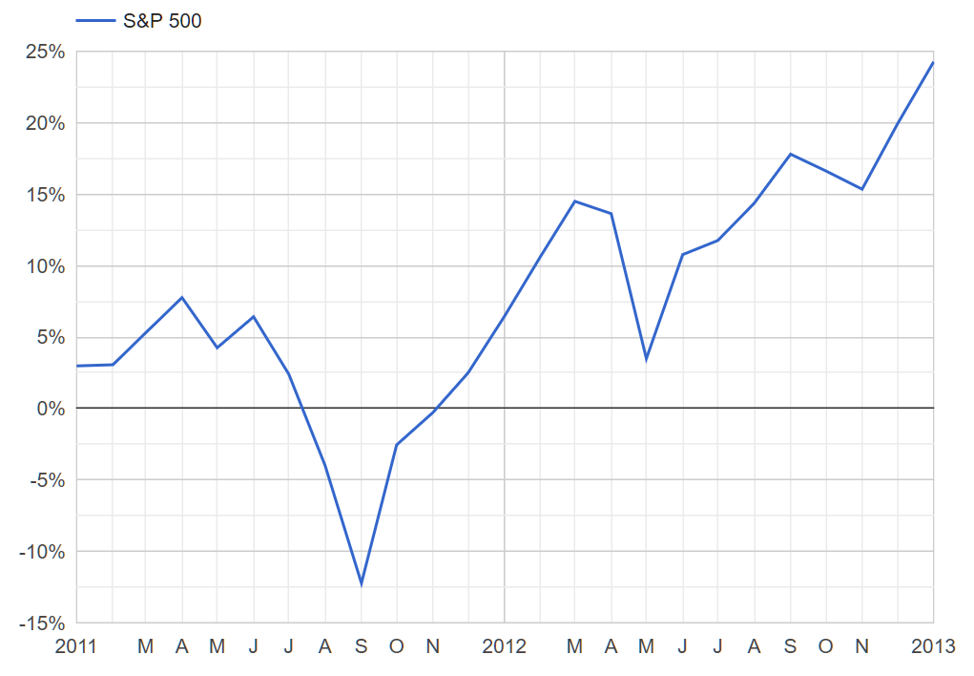
The terrible irony of these situations is that the "panic" is in some ways necessary to drive the appropriate response from policy makers and the public. Investors face a catch-22: they must drive prices down to account for the worst-case scenario, yet as prices are driven down, it becomes more and more likely that the situation will be controlled. This most often results in a frustrating "V" shape which seems silly in retrospect yet terrifying in the midst of it. There's inevitably a point where the level of loss becomes scary enough to drive more selling on its own despite the rational probabilities.
Thus, the question before us is whether this time will really be different. If we do wind up in a real recession caused by the virus, it would be the first of its kind since World War II, at the latest. For my money, I wouldn't bet on it. Fortunately, I don't even need to when I have both Hedgewise frameworks in use.
Evaluating Hedgewise Performance
While any level of loss will be somewhat difficult to endure, this stretch does provide a useful case study of the benefits of the Hedgewise Risk Parity framework. It picked up on elevated risk levels at the beginning of February, and adjusted exposure accordingly. It has successfully limited client drawdowns compared to the S&P 500 as well as outperformed comparable risk parity mutual funds year-to-date.
Hedgewise Risk Parity "High" Performance YTD
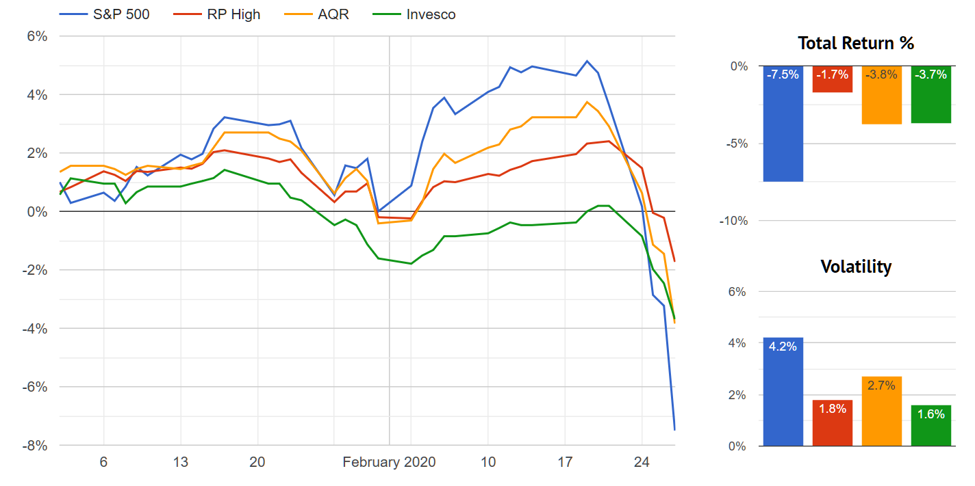
The primary benefit of Risk Parity is the ability to minimize deep losses, and this is exactly the kind of scenario in which that happens. It can be difficult to feel "good" about it, since you still usually lose some money as assets are correcting, but avoiding a few larger drawdowns is one of the primary drivers of the framework's long-term performance, and this represents another successful data point.
This also highlights why Hedgewise clients are typically recommended to hold at least 50% of their assets in a Risk Parity portfolio. I doubt we are in a "this time really is different" scenario, but if and when we do come to such a day, it makes sense to have this backstop. It can be easy to lose this insight when you already know how history unfolded.
The Momentum framework has experienced a much larger drawdown, with the "Max" risk level moving from a 6% YTD gain last Friday to an 11% YTD loss as of today. The reason is relatively simple: it is an equity-focused product, and unless risk signals demonstrate a substantial chance of an economic recession, it will be highly exposed. In this particular case, the fundamental macroeconomic trends before the virus broke out were quite positive (and remember it was only last Friday that the stock market was +5% YTD). Unless those fundamental trends change, it will continue to be positioned this way for precisely the logic discussed earlier; short-term geopolitical events have neither a theoretical basis nor a historical trend of being meaningful reasons to get out of equities.
To see how this has panned out historically, the following isolates all months when Momentum had the same level of its current equity exposure while equities lost 5% or more, and then examines the subsequent one month, three month, six month, and one year returns of the Momentum product.
Momentum "Max" Subsequent Returns after Similar Months of Loss
| Date | 1mth | 3mth | 6mth | 1yr |
|---|---|---|---|---|
| 1971-10-01 | 3.7% | 20.4% | 24.8% | 40.5% |
| 1975-07-01 | -6.2% | -0.7% | 23.7% | 32.0% |
| 1978-10-01 | -4.7% | 5.2% | 8.9% | 25.8% |
| 2002-04-01 | 0.6% | 3.4% | 18.5% | 20.3% |
| 2010-05-01 | -4.4% | 4.6% | 28.3% | 59.5% |
Note that there were frequently more losses in the first subsequent month. It is not the goal of the Momentum framework to minimize such events to the extent that they are likely to be short-lived. Market panic often lasts a month or two, but so long as true recession risk stays below a certain level, Momentum holds steady. By the six month or one year mark, the initial losses are easily and consistently reversed.
This logic allows the two frameworks to function elegantly together. Risk Parity is sensitive to expected market volatility, so it has a relatively high chance of proactively minimizing drawdowns from any source. Momentum is only sensitive to more deeply systematic risk, so it has a much higher tolerance to bear losses from temporary scares. One framework will probably be more "right" at a given point in time, though both perform well over the long run for different reasons. By diversifying across the two, you remain effectively hedged.
With this in mind, it is easier to contextualize the Coronavirus. It is a scary geopolitical risk, so Risk Parity exhibits caution while Momentum does not. If you were convinced that this time is really different, and equities were doomed, certainly Risk Parity makes more sense to express your view. Conversely if you think this will resolve without a lasting recession (just as all other geopolitical risks have), Momentum is in an excellent position to benefit. If you have no real clue but you are a long-term investor, you have your bases covered across the two. In the meantime, I suggest spending more time washing your hands than worrying about the market!
Disclosure
This information does not constitute investment advice or an offer to invest or to provide management services and is subject to correction, completion and amendment without notice. Hedgewise makes no warranties and is not responsible for your use of this information or for any errors or inaccuracies resulting from your use. Hedgewise may recommend some of the investments mentioned in this article for use in its clients' portfolios. Past performance is no indicator or guarantee of future results. Investing involves risk, including the risk of loss. All performance data shown prior to the inception of each Hedgewise framework (Risk Parity in October 2014, Momentum in November 2016) is based on a hypothetical model and there is no guarantee that such performance could have been achieved in a live portfolio, which would have been affected by material factors including market liquidity, bid-ask spreads, intraday price fluctuations, instrument availability, and interest rates. Model performance data is based on publicly available index or asset price information and all dividend or coupon payments are included and assumed to be reinvested monthly. Hedgewise products have substantially different levels of volatility and exposure to separate risk factors, such as commodity prices and the use of leverage via derivatives, compared to traditional benchmarks like the S&P 500. Any comparisons to benchmarks are provided as a generic baseline for a long-term investment portfolio and do not suggest that Hedgewise products will exhibit similar characteristics. When live client data is shown, it includes all fees, commissions, and other expenses incurred during management. Only performance figures from the earliest live client accounts available or from a composite average of all client accounts are used. Other accounts managed by Hedgewise will have performed slightly differently than the numbers shown for a variety of reasons, though all accounts are managed according to the same underlying strategy model. Hedgewise relies on sophisticated algorithms which present technological risk, including data availability, system uptime and speed, coding errors, and reliance on third party vendors.