


Summary
- Hedgewise has performed very well in 2021, with YTD gains of 15-20% within the higher target risk levels.
- Many clients worry that the "Fed bubble" and associated market froth will threaten these gains, which can feel especially acute after a month like September when many asset prices fell together.
- The reality is closer to the opposite: cross-asset drawdowns usually reverse, regardless of what happens subsequently to individual asset classes.
- Unlike traditional passive approaches, Risk Parity is far less sensitive to "bubbles", wherever they occur. Leaving cash on the sidelines tends to be a far bigger risk, regardless of current market conditions.
Introduction: A Terrifyingly Great Year
2021 has been a fantastic year of performance against a backdrop of extreme fear. Equity valuations are 15-25% higher than their historical averages, interest rates have nowhere to go but up, and price levels for all kinds of goods - groceries, cars, houses, you name it – have been skyrocketing. Intuitively, this feels like a terrible time to be an investor, and that may be true for individual asset classes. Fortunately, Hedgewise clients do not need to share these concerns.
The brutal contradiction of market bubbles is that it can be a terrible move to try and avoid them. Equities provide a nice case-in-point in 2021: earnings this year have come in about 20% higher than the initial analyst estimates in January, which accounts for almost all the YTD gains. Even if the "overvaluation" were to suddenly correct tomorrow, earnings have already made up for it. It would be painful to suddenly lose 20%, but if you had invested since January, you would merely return to breakeven.
The problem for traditional passive investors is that years like 2000 or 2008 exist as real possibilities: losses of that size can wipe out a decades' worth of gains or take a decade to recover. It seems natural to apply the same caveat to Risk Parity, though that would not be proper. The most powerful aspect of the Hedgewise approach is how dramatically it reduces the possibility of such extremes.
The ideas are simple: reduce exposure to assets as their inherent risk increases and balance the overall portfolio equally against any economic outcome (growth, recession, inflation, or deflation). Over the short-term, it can feel scary to trust how this works. Isn't it still vulnerable to an "everything bubble"? What if it happens suddenly? Yet a vast amount of data and theory demonstrates incredible persistence and shows why Hedgewise Risk Parity remains an excellent option, especially during times like these.
Reviewing 2021 YTD Performance
Here is a quick look at how Hedgewise has done compared to the other major asset classes year-to-date. The following shows the performance of the Risk Parity "Max+1" strategy, which is the active Hedgewise portfolio with the closest target volatility to the S&P 500.
Hedgewise RP Max+1 Performance vs. Other Asset Classes, 2021 Year-to-Date
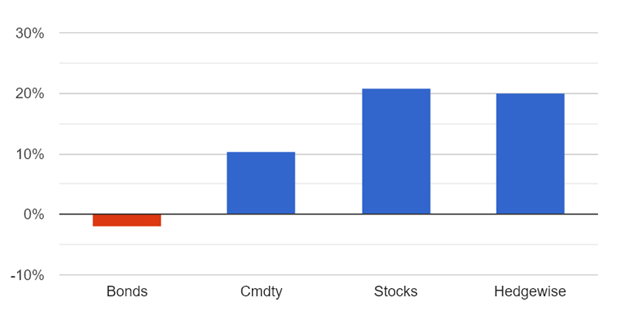
Hedgewise has managed to keep up with stocks despite an environment of high volatility and significant underperformance in bonds and commodities. Diving a little deeper, it has been a terrible year for gold and 30yr Treasuries, both of which represent significant pieces of the Hedgewise portfolio.
Performance of Gold and 30yr Treasury Bonds, YTD
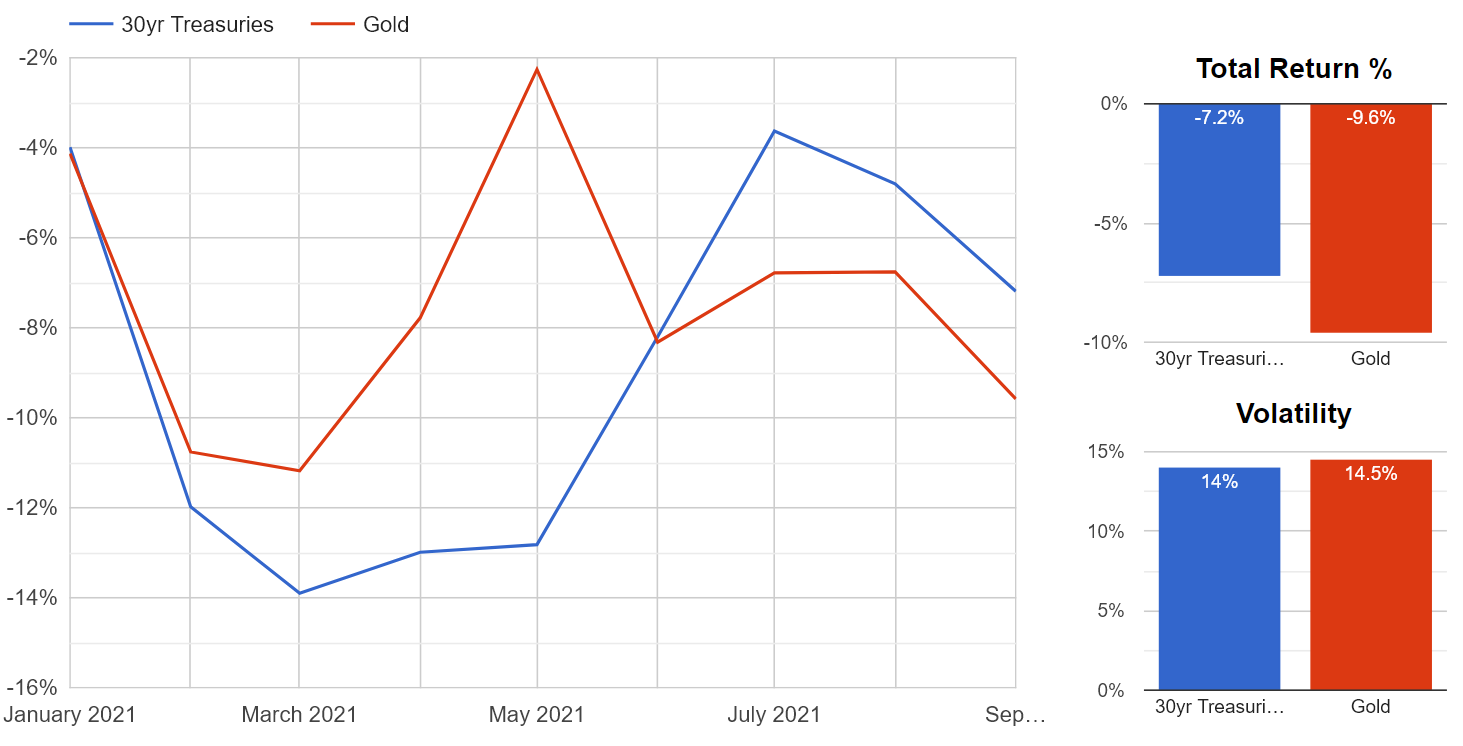
Both assets showed signs of elevated risk throughout the year, so neither drawdown had a significant impact on the Hedgewise portfolio. The growth assets that rallied alongside this (i.e., industrial commodities and equities) easily compensated for any losses.
These details paint the more nuanced story of the Risk Parity portfolio. At the start of 2021, it was true that bonds and gold were about to lose ~10%, but that also meant that growth would be strong enough to sustain rich equity valuations and drive significant earnings expansion. This balance is inherent in any given economic outcome; an "everything bubble" is only dangerous if they all somehow pop at once.
This can happen over a short timeframe, but it is fundamentally unlikely to persist. Usually, it is a sign that investors fear conflicting possibilities, but only one can happen. Last month presented an excellent case study for this pattern.
Why Did This Happen in September?
Investors are especially jittery about rising interest rates. In September, the Fed was a little more hawkish than expected, which activated a broad "risk-off" move. Bond investors fear higher yields, and stock and commodity investors fear lower global growth. This naturally resulted in a cross-asset drawdown.
Hedgewise RP Max+1 Performance vs. Other Asset Classes, September 2021
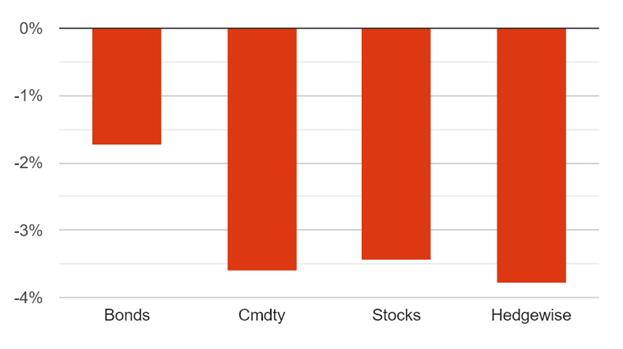
This performance suggests confusion because the Fed is raising rates to fight inflation, but inflationary assets like copper and gold are falling because of worries about global growth. This tug-of-war must eventually reconcile; either the economy can tolerate higher real interest rates, or growth slows down so much that the Fed must reverse course. At least one asset class should be rallying, but no one knows which one yet.
While this may need a few months to resolve, it always has. The following chart shows the six-month subsequent performance for each asset class following any month where stocks lost at least 3% and neither bonds nor gold rallied alongside.
Performance of Major Asset Classes, Six Months Following A Cross-Asset Drawdown
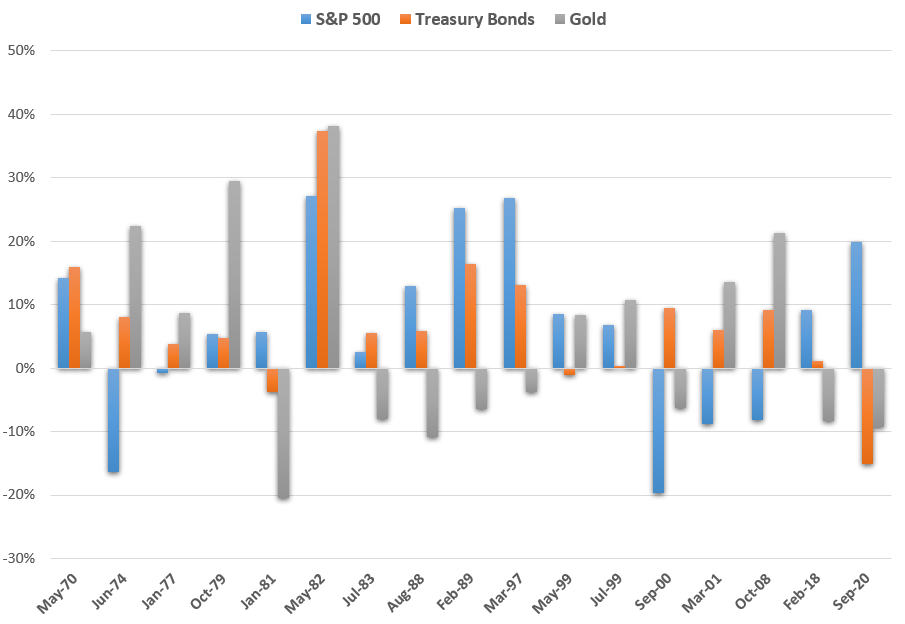
While it is difficult to predict which asset class will recover, the Hedgewise approach makes that unnecessary. Since at least one will rally, it is unlikely that Risk Parity will sustain much additional loss. This is in stark contrast to passive equity investors, as exhibited by the following chart.
Performance of S&P 500 vs. Risk Parity, Six Months Following A Cross-Asset Drawdown
Notice how the Risk Parity model mitigates every major drawdown in the S&P 500. This happens because bonds and gold tend to rally if the S&P 500 falls further, and because the strategy minimizes overall exposure in risky conditions. When utilized intelligently, these techniques function in any market environment. That said, "stagflation" (i.e., sluggish growth alongside high inflation) does introduce a few wrinkles, including the ”outlier" Risk Parity drawdown of 1981. This is worth exploring more deeply, especially since stagflation is one of our major present concerns.
What To Expect From Risk Parity During Stagflation
Stocks and bonds generally suffer losses during stagflation, but real assets like gold, energy, and industrial metals can outperform because those raw commodity prices are a significant piece of inflation. Alongside broader risk management, this explains how Risk Parity weathered the decade-long stagflation of the 1970s and provides a template for what to expect if it happens again. Risk Parity consistently outperformed the S&P 500, but also experienced frequent, sizeable drawdowns (the size of each loss is highlighted on the graph).
Performance of S&P 500 vs. Risk Parity, 1974-1982
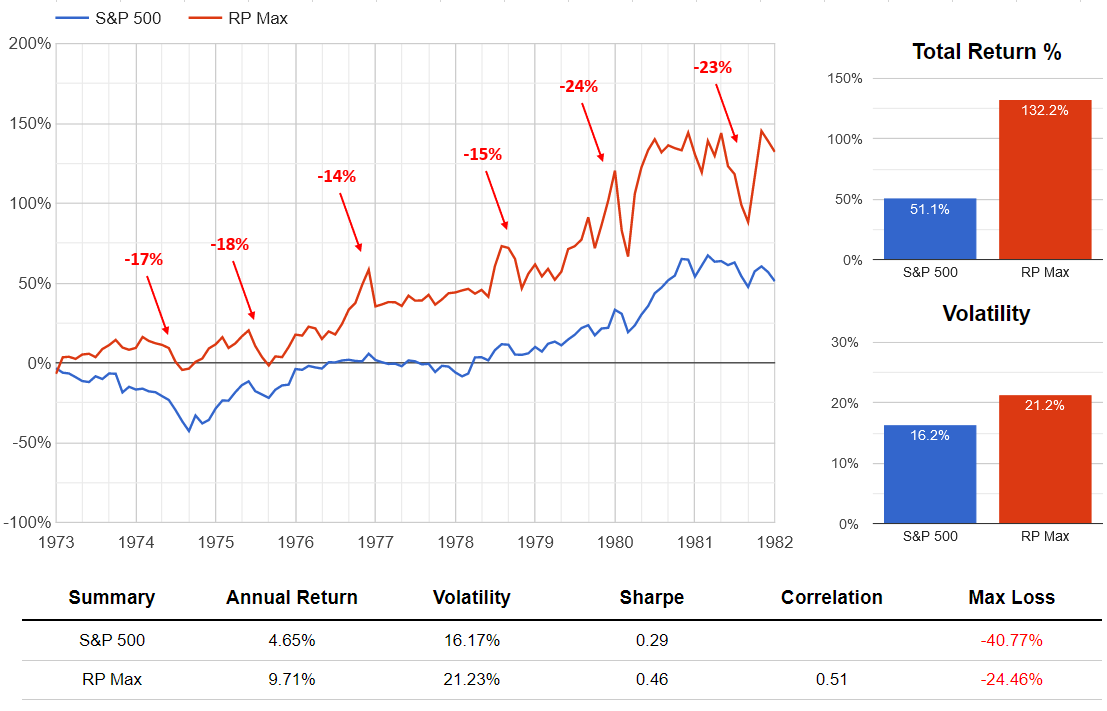
Notice how the drawdowns were short-lived and happened alongside annual gains of nearly 10%. This makes perfect sense! Investors were incredibly nervous, and the news was frequently bad: profit margins were under pressure, raw material prices were soaring, and no one knew how high interest rates needed to rise to get inflation under control. Amidst the resulting volatility, various asset classes became undervalued, and Hedgewise was well-positioned to participate in the ensuing rallies. To succeed in this environment, investors needed to constantly look past near-term losses with the understanding that these events had fundamental reasons to resolve.
The takeaway is that short-term drawdowns - even drawdowns of 20% or more - are par for the course, especially in an environment of stagflation. Even if you had invested at precisely the wrong moment in 1974, 1975, or 1977, you still accrued significant gains over any three-year period.
The high volatility presents a temptation to time the tops and bottoms, but this requires an immense degree of precision, and overlooks a significant opportunity cost. Whenever you have cash on the sidelines, you miss potential gains in every month outside of the drawdown. For example, the 15% loss from September to December 1978 was preceded by an even larger gain in the two months prior.
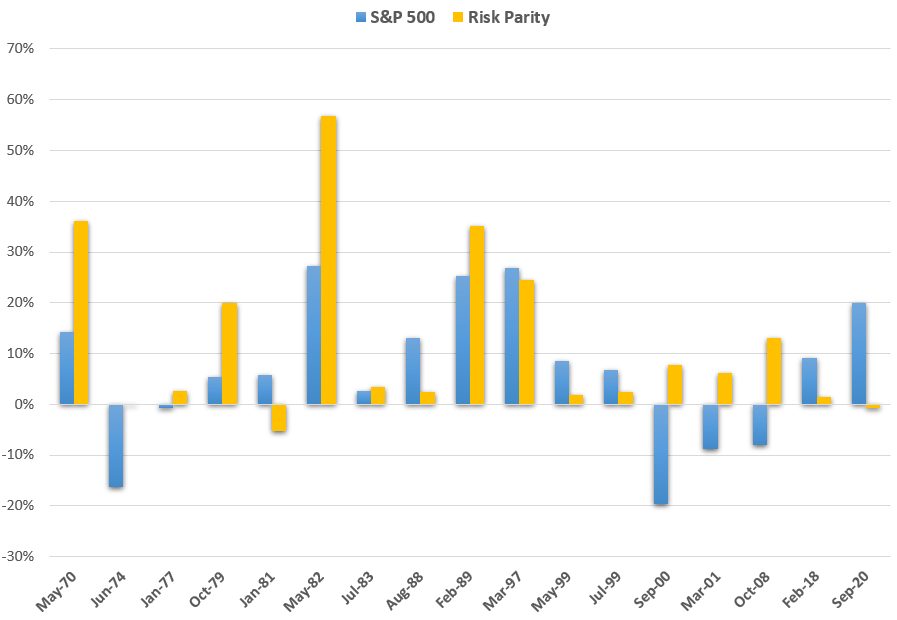
To provide broader historical context, the following table calculates this prior "breakeven period" for every major drawdown of the Risk Parity model since 1970. In other words, this shows how many months you needed to invest before each drawdown to completely offset it.
| Date | Total Loss | Months Invested Prior to Peak to Fully Offset Loss |
|---|---|---|
| September 1974 | -17% | 13 | October 1975 | -18% | 9 | February 1977 | -14% | 3 | December 1978 | -15% | 2 | April 1980 | -24% | 8 | October 1981 | -23% | 14 | July 1984 | -27% | 8 | September 1988 | -21% | 12 | May 1990 | -21% | 7 | December 1994 | -17% | 9 | September 1996 | -14% | 3 | November 2008 | -16% | 5 | November 2018 | -14% | 4 |
Even if you had perfect foresight, and could time every drawdown's exact top and bottom, you are usually better off investing earlier and ignoring the subsequent volatility (on average, the breakeven period is 7 months). Consider the experience in 2021: the same set of risks exists today as did back in January, and many investors have been sitting in cash since then in anticipation of bubbles popping. They have now foregone YTD gains of nearly 15% and will need to time a drawdown of at least that size to merely catch up, if such an event happens at all.
Obviously, returns would be better if you could participate in the upside and sidestep every dip, and it is painful to suffer big losses even when you have a large buffer of gains. But if worrying about this keeps you in cash for months or years at a time, you will usually lose much more in opportunity cost than you could ever recover with the most astute timing.
As a final contrast, this same logic does not apply to the S&P 500 in isolation. The crash of 1974 wiped out over 6 years of gains, and the crash of 2008 wiped out over 10 years of gains. The mechanics of Risk Parity dramatically reduce the chance of these extreme outcomes because it is constantly positioned for so many different economic scenarios. While drawdowns are still inevitable, there is a much higher probability that they will be both short-lived and moderate compared to prior gains.
It is sensible for traditional passive investors to fret about bubbles in the S&P 500, but Hedgewise clients have the luxury of different experience.
Wrapping Up
A powerful feature of the Risk Parity framework is how it can empower a shift of mentality. Drawdowns can feel less dramatic, and bubbles can be less important. It becomes easier to embrace this as you more deeply understand the methodology, but it is still difficult to reconcile how a broadly terrible investment environment can be perfectly fine for Hedgewise.
The most important idea is that something will perform well in every economic environment, and that means your portfolio gains protection if you hold everything in equal balance. When investors are highly uncertain, that can lead to pockets where all assets fall together, but this must resolve as the outcome becomes clearer.
Stagflation might seem like an outlier, but this is precisely the environment where gold, energy, and industrial metals do well. Short-term drawdowns may be bigger and more frequent, as they were in the 1970s, because investors are sorting through many conflicting possibilities in a generally stressful environment. However, they do not present the same kind of existential threat that equity investors face because the strategy is built on a different foundation.
The natural intuition may be to avoid these drawdowns, either by timing the market or leaving cash on the sidelines, but it is extremely difficult to overcome the opportunity cost along the way. On average, it takes a mere 7 months to gain more than the size of any subsequent loss. Historically, Hedgewise Risk Parity has never lost money over any three-year period. If you can build drawdowns into your expectation and invest without hesitation, you will almost certainly be better off over the long run.
Equities are probably overvalued. Interest rates will probably go up. The post-pandemic economy may be a twisted mess of snarled supply chains and sky-high prices. For many investors, it seems like there is nowhere to turn. For Hedgewise, it is just another regular year.
Disclosure
This information does not constitute investment advice or an offer to invest or to provide management services and is subject to correction, completion and amendment without notice. Hedgewise makes no warranties and is not responsible for your use of this information or for any errors or inaccuracies resulting from your use. Hedgewise may recommend some of the investments mentioned in this article for use in its clients' portfolios. Past performance is no indicator or guarantee of future results. Investing involves risk, including the risk of loss. All performance data shown prior to the inception of each Hedgewise framework (Risk Parity in October 2014, Momentum in November 2016) is based on a hypothetical model and there is no guarantee that such performance could have been achieved in a live portfolio, which would have been affected by material factors including market liquidity, bid-ask spreads, intraday price fluctuations, instrument availability, and interest rates. Model performance data is based on publicly available index or asset price information and all dividend or coupon payments are included and assumed to be reinvested monthly. Hedgewise products have substantially different levels of volatility and exposure to separate risk factors, such as commodity prices and the use of leverage via derivatives, compared to traditional benchmarks like the S&P 500. Any comparisons to benchmarks are provided as a generic baseline for a long-term investment portfolio and do not suggest that Hedgewise products will exhibit similar characteristics. When live client data is shown, it includes all fees, commissions, and other expenses incurred during management. Only performance figures from the earliest live client accounts available or from a composite average of all client accounts are used. Other accounts managed by Hedgewise will have performed slightly differently than the numbers shown for a variety of reasons, though all accounts are managed according to the same underlying strategy model. Hedgewise relies on sophisticated algorithms which present technological risk, including data availability, system uptime and speed, coding errors, and reliance on third party vendors.