


Summary
- We've just completed a significant amount of research to improve our ability to estimate and balance risk moving forward.
- We examined every significant market event going back to the 1950s to ensure that our risk model still made sense and that the strategy functioned as planned. We also expanded our view to the market history of other countries, such as Germany and Japan.
- This resulted in a number of adjustments to our model to account for very extreme environments, such as when interest rates approach zero.
- We are confident these changes will ensure that we are offering a best-in-class risk parity product, and we are now benchmarking our performance against billion-dollar competitive products to prove it.
Introduction: A Recap on Risk
We've published a number of articles on the basics of how risk parity works and why it has been so resilient through the decades. However, a common critique of the strategy is whether risk can really be measured. After rolling out a few improvements to our system his month, it seemed like an opportune time to address these concerns and to share some additional detail on how we view risk.
At the highest level, risk is quite simple - it is the chance that you will lose money. Generally, with a higher risk of loss, there also comes a greater potential for gain, since investors wouldn't be willing to take the chance otherwise. If the goal of diversification is to achieve balance in your portfolio, then you need fewer 'higher risk' assets to offset 'lower risk' assets.
While this is quite intuitive, the rub comes when you need to continually measure risk on an ongoing basis. How risky are bonds when interest rates are near zero? How risky are stocks when there is little market volatility? Because these questions are challenging, critics of risk parity often claim that it cannot be trusted.
Our position is that any kind of risk measurement needs to be founded in common sense. It is too extreme to say that risk cannot be measured, since a 5 year Treasury bond is obviously less risky than the S&P 500. However, it would be equally extreme to say that the S&P 500 is no longer risky if it experienced very low volatility for an extended period of time.
We begin with a fundamental understanding of how every asset class is priced by investors. Fixed income products, like Treasury bonds, are priced according to expected interest rates and the risk of default. If the US government stays solvent, there is no risk of losing your capital if you are willing to wait until your bond matures. Compare this to a small-cap stock, where the risk of bankruptcy is quite real and happens to a number of companies every year. We consider these risks 'permanent', and they construct the general framework for how we weight each asset in our portfolio. This framework ensures that we aren't doing anything crazy like saying 'risk is the same as volatility'.
With that starting point in place, we layer in the assumption that risk is dynamic. For example, when interest rates are extraordinarily low, there is a much higher chance that you will lose money on long duration bonds. Similarly, during times of extreme economic uncertainty, like the period from 2008 to 2009, equities have an increased level of risk. Our platform constantly takes all of this information into account and transforms it into an estimate of where risk is shifting in a given time period.
We find this framework quite intuitive. In normal market environments, bonds tend to be less risky than stocks, which tend to be less risky than commodities. As a result, a mix like 60% bonds, 30% stocks, and 10% commodities would be sensible. Interestingly, that exact mix has also been close to the optimal point of diversification for the past 60 years. However, if the markets begin to signal a rising interest rate environment, it would make lots of sense to ease back the relative exposure to bonds.
While this logic is fairly easy to understand, it is extremely important that the system is robust to any kind of economic environment. Naive models of risk parity may fail to properly account for extremes, like the 1970s, when interest rates went up 10% in the course of a single year. This is why we continuously research different time periods and pressure test our risk estimates.
With this in mind, a couple of events prompted our newest research efforts. First, the 10 year German Treasury bond hit interest rates of near 0% for the first time earlier in the year. Second, market risk levels in the US have been very elevated in every asset class since August. Both of these scenarios raised questions for which we wanted to make sure we had good answers.
Better Accounting for Zero Interest Rates
Compared to the traditional portfolio mix, the risk parity strategy has a much heavier allocation to bonds as a result of the balancing logic we discussed earlier. However, bonds are unique in that they have a strict lower bound at 0% interest (otherwise, you'd be literally paying the government every year). If rates near this lower bound, bonds become a guaranteed bad bet. Best case, you make very little, and worst case, you lose quite a lot.
Put another way, if it becomes absolutely certain that interest rates are going to rise, it no longer makes sense to hold bonds in your portfolio. The question becomes, when does this become a certainty? Yields on the 10 year US Treasury bond are currently around 2%, but reached as low as 1.6% earlier in the year. Many pundits are constantly claiming that rates can't get any lower, but if you take a quick look at Europe, you'll find that their 10 year yields have gotten far, far worse.
Interest Rate on 10yr German Bund, 2011 - Present
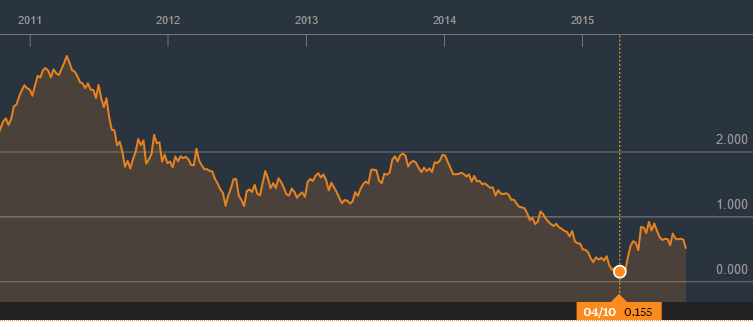
In April, the 10 year German Bund (their equivalent to Treasuries) reached a yield of 0.155%. While this demonstrates that current US yields may not be that low after all, the key dilemma is how to handle bond exposure on the way down. At what point do bonds become a bad bet? 1%? 0.5%? What is the right way to adjust your portfolio mix as a result?
To answer these questions, we took a deeper look at the interest rate history in Germany as well as Japan. What we found may seem quite obvious: as interest rates approach the lower bound, bonds become an increasingly risky bet, to the point of "infinite" risk if rates actually hit 0%. This provided us with a natural framework to better estimate risk at each point along the yield curve.
While our original model included some sense of this, our new research has helped to make it more precise and adaptive. We combine fundamental attributes of the bond market, such as duration and convexity, with the current yield curve to address even the most extreme environments. As interest rates fall to dangerous levels, we now adjust our portfolio mix to favor less risky bonds (e.g., 5yr vs. 10yr), and we also reduce our overall bond exposure across the board.
Compare this to the traditional portfolio for a retiree, which might be a static mix of 60% bonds and 40% stocks. In Germany, that would have meant that you had 60% of your investments in assets that could not possibly achieve a positive return! In environments like that one, it is quite clear that measuring risk is a necessity.
Optimizing Exposure in a High Risk Environment
Our second piece of research centered around the extremely elevated levels of asset risk we've seen over the past two months. Since around the middle of August, nearly every market has been quite volatile.
Market Risk Snapshot in the Hedgewise Dashboard, 10/3/2015
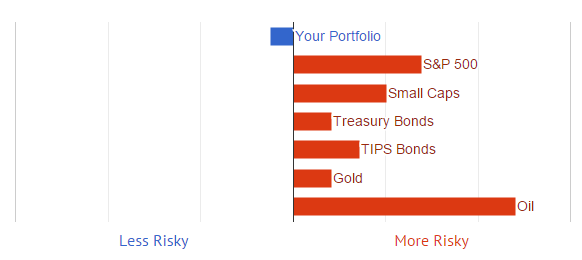
Because our strategy naturally reduces exposure in such environments, we began seeing some allocation to cash in our lower risk portfolios. We wanted to make sure this was being done intelligently, given that we tend to avoid any allocation to cash since it does not provide any expected return.
We found two things. First, every market is pricing in extreme risk - we are at levels typically only seen during significant market corrections or recessions. While such indicators are no guarantee, it certainly makes sense that our model is calling for extra caution.
Secondly, we have added in exposure to shorter term bonds, such as 5 year Treasuries, as a preferable alternative to cash. This ensures you are getting some yield on your cash regardless of the environment, as every little bit counts.
Removing our Retroactive Model Simulation
As a result of these changes, our model is now slightly different than the retroactive simulation we originally showed on a few pages of the Hedgewise website. In addition, the new model is more difficult to accurately replicate outside of a live market environment. Finally, there is a high likelihood that we will continue to make small adjustments to our framework as we continue to do research over time.
Rather than attempt to update our simulation, we will be exclusively posting our live performance data moving forward. This will ensure that any Hedgewise performance figures you see are based on live trades and account for all costs and fees.
However, to help validate that our approach to risk parity is consistent with that of much larger competitors, we have begun benchmarking our performance to other risk parity mutual funds. After all, we did not invent this framework - we are simply making it cheaper, more tax efficient, and more accessible. In fact, we encourage you to explore the competitive options, since they provide lots of additional information on why risk parity makes sense, while failing to give you all of the same benefits as Hedgewise.
For more information, we've also posted a separate article outlining how our strategy compares to other providers. We are confident that risk parity will continue to outperform the traditional portfolio mix over the long run, and that Hedgewise will be the one of best places to access it.
Disclosure
This information does not constitute investment advice or an offer to invest or to provide management services and is subject to correction, completion and amendment without notice. Hedgewise makes no warranties and is not responsible for your use of this information or for any errors or inaccuracies resulting from your use. Hedgewise may recommend some of the investments mentioned in this article for use in its clients' portfolios. Past performance is no indicator or guarantee of future results. Investing involves risk, including the risk of loss. All performance data shown prior to the inception of each Hedgewise framework (Risk Parity in October 2014, Momentum in November 2016) is based on a hypothetical model and there is no guarantee that such performance could have been achieved in a live portfolio, which would have been affected by material factors including market liquidity, bid-ask spreads, intraday price fluctuations, instrument availability, and interest rates. Model performance data is based on publicly available index or asset price information and all dividend or coupon payments are included and assumed to be reinvested monthly. Hedgewise products have substantially different levels of volatility and exposure to separate risk factors, such as commodity prices and the use of leverage via derivatives, compared to traditional benchmarks like the S&P 500. Any comparisons to benchmarks are provided as a generic baseline for a long-term investment portfolio and do not suggest that Hedgewise products will exhibit similar characteristics. When live client data is shown, it includes all fees, commissions, and other expenses incurred during management. Only performance figures from the earliest live client accounts available or from a composite average of all client accounts are used. Other accounts managed by Hedgewise will have performed slightly differently than the numbers shown for a variety of reasons, though all accounts are managed according to the same underlying strategy model. Hedgewise relies on sophisticated algorithms which present technological risk, including data availability, system uptime and speed, coding errors, and reliance on third party vendors.