


Summary
- After a stellar start to 2016, driven by rallies in the bond and commodity markets, we examine our expectations for the near future in our Risk Parity strategy.
- While US bonds yields continue to fall into unprecedented territory, they remain higher than nearly all other developed nations. Equities have much greater downside risk.
- Strong returns this year are no reason for concern moving forward.
Equities Remain a Bigger Risk Than Bonds
As bond yields have continued to dip, many clients are again wondering whether the Risk Parity framework is too vulnerable to rising interest rates. However, the reality is that US rates remain the highest in the developed world.
Comparison of 10yr Bond Yields
| Country | 10yr Yield |
|---|---|
| United States | 1.531% |
| Italy | 1.219% |
| Spain | 1.169% |
| Canada | 1.056% |
| United Kingdom | 0.794% |
| Japan | -0.257% |
| Germany | -0.36% |
If the economy should run into more significant headwinds, there is plenty of room for bonds to continue to rally. The Fed has precious little ammunition to provide stimulus, but has been concerned enough about tepid growth to delay rising interest rates any further. A number of significant, negative economic shocks have the potential to unfold this year, including the US presidential election, continued fallout from the Brexit, and hidden weakness in China. The risk of rapidly rising interest rates in the near future is almost nonexistent.
Hedgewise Risk Parity is Built to be Nimble
Another common concern is that low future return expectations in both the bond and equity markets make cash a more compelling alternative. However, it is important to understand that our strategy is constantly shifting to account for such risks. The power of these techniques can be more clearly understood by examining the monthly performance of the strategy during the 2008 recession.
Performance During 2008 Recession
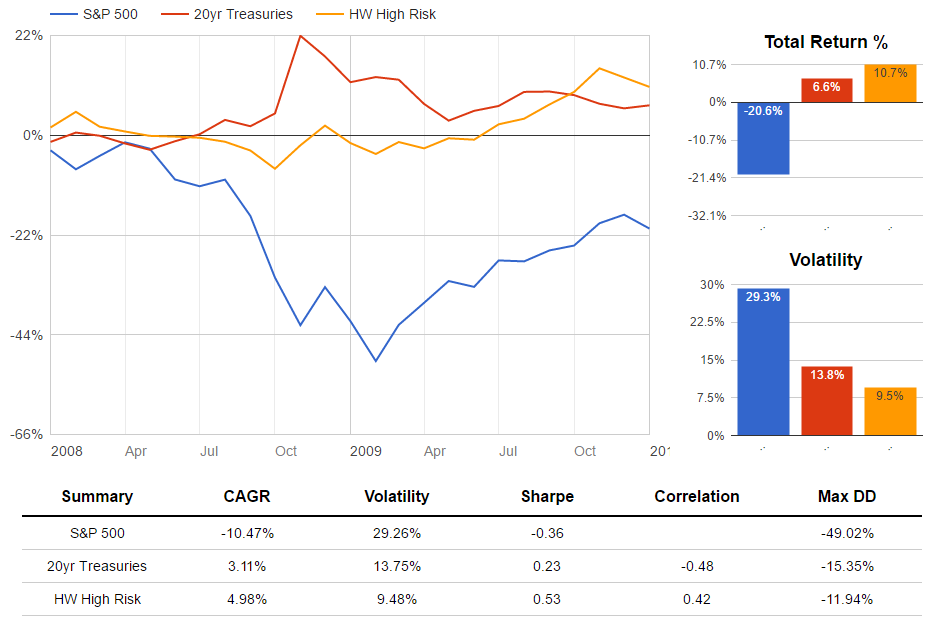
If you zoom in on the period from October to December 2008, there is a distinct stretch where both bonds and stocks were losing money simultaneously, yet the impact on the Risk Parity portfolio was relatively muted. How was this possible?
First, the expected volatility in the markets began to skyrocket in late summer. As a result, the overall exposure to every asset class was reduced in the Hedgewise portfolio. This ensured that big swings in either direction would still have a minimal impact on your returns.
Second, interest rates dropped dramatically lower in November 2008, resulting in a huge gain for bonds that month. As interest rates reach certain thresholds, Hedgewise automatically begins trimming exposure by moving to shorter durations and increasing its risk estimates. Thus, the pursuant dip in the following month was muted.
As a result of these adjustments, our strategy still yielded a positive return over this timeframe despite extraordinarily difficult market conditions. This helps to reinforce that Risk Parity is not a bet on any particular asset class; it is simply seeking constant balance between them. Losses only tend to occur when asset classes fall out of balance, but this happens unpredictably and infrequently.
Is There a Risk of Imbalance Moving Forward?
Over the course of 2015, our main message was to remain patient as markets rarely remain out of balance for long. One of our favorite statistics is that Risk Parity has never lost money for two consecutive years. In fact, there have only been 8 years of the past 50 or so when the strategy lost more than 10%. Whenever that happened, it consistently led to positive returns in the year following.
| Year | 1yr Trailing Loss | Following Year Return |
|---|---|---|
| 1974 | -24% | 7% |
| 1981 | -20% | 40% |
| 1984 | -18% | 20% |
| 1994 | -14% | 56% |
| 2013 | -11% | 9% |
| 2016 | -11% | TBD |
This is expected because any time a loss occurs in a risk-balanced framework, it suggests that markets are out-of-sync. However, it is fair to then ask the opposite question: do outsized gains mean there is a greater risk of future loss? Fortunately, this isn't the case. Investing is a positive-sum game, which means that positive returns are what you expect. This is easy to see by studying a few historical return patterns.
We isolated every month since 1970 where the prior year's return was 10% or greater. We then looked at the following year's return to see how frequently this predicted a reversal and subsequent loss. The years of gain were followed by a year of loss only 30% of the time; 70% of the time, gains continued to accrue. This pattern remains true no matter how high the prior year return has been.
The takeaway is quite clear: there's no need to worry about a year of gains, but it almost never makes sense to sell during a year of losses.
So What's Coming Next?
At this point, there are two most likely possibilities. Either we are heading into another recession, or we avoid the negative economic shocks and continue to trickle ahead slowly. If a recession is coming, Risk Parity is absolutely one of the best places to be, and there's no reason to expect it will sustain heavy losses. If we continue our pattern of slow growth, Risk Parity will accrue some of those gains without concentrating your risk in any single asset class. In both cases, it is wisest to stay steady and avoid worrying about what might happen next.
While interest rates tend to be a persistent and reasonable concern for our clients, there is no scenario in which they will represent an outsized risk.
Disclosure
This information does not constitute investment advice or an offer to invest or to provide management services and is subject to correction, completion and amendment without notice. Hedgewise makes no warranties and is not responsible for your use of this information or for any errors or inaccuracies resulting from your use. Hedgewise may recommend some of the investments mentioned in this article for use in its clients' portfolios. Past performance is no indicator or guarantee of future results. Investing involves risk, including the risk of loss. All performance data shown prior to the inception of each Hedgewise framework (Risk Parity in October 2014, Momentum in November 2016) is based on a hypothetical model and there is no guarantee that such performance could have been achieved in a live portfolio, which would have been affected by material factors including market liquidity, bid-ask spreads, intraday price fluctuations, instrument availability, and interest rates. Model performance data is based on publicly available index or asset price information and all dividend or coupon payments are included and assumed to be reinvested monthly. Hedgewise products have substantially different levels of volatility and exposure to separate risk factors, such as commodity prices and the use of leverage via derivatives, compared to traditional benchmarks like the S&P 500. Any comparisons to benchmarks are provided as a generic baseline for a long-term investment portfolio and do not suggest that Hedgewise products will exhibit similar characteristics. When live client data is shown, it includes all fees, commissions, and other expenses incurred during management. Only performance figures from the earliest live client accounts available or from a composite average of all client accounts are used. Other accounts managed by Hedgewise will have performed slightly differently than the numbers shown for a variety of reasons, though all accounts are managed according to the same underlying strategy model. Hedgewise relies on sophisticated algorithms which present technological risk, including data availability, system uptime and speed, coding errors, and reliance on third party vendors.